Home > Comparison > Financial Services > BAC vs C
The strategic rivalry between Bank of America Corporation and Citigroup Inc. defines the current trajectory of the diversified banking sector. Bank of America operates a broad consumer and institutional banking model with extensive retail and wealth management services. Citigroup focuses on global consumer banking combined with a strong institutional client group across multiple continents. This analysis will clarify which business model delivers superior risk-adjusted returns for a diversified portfolio amid evolving financial landscapes.

Table of contents
Companies Overview
Bank of America and Citigroup dominate as diversified banking giants with broad global reach and multifaceted financial services.
Bank of America Corporation: Comprehensive Financial Services Leader
Bank of America stands as a diversified banking powerhouse, generating revenue primarily through consumer banking, global wealth management, and corporate lending. Its core strength lies in a vast retail network supporting 67M clients and digital platforms with 41M active users. In 2021, it prioritized expanding digital capabilities and enhancing treasury and risk management solutions to deepen client relationships.
Citigroup Inc.: Global Consumer and Institutional Bank
Citigroup operates as a diversified financial services holding company, earning revenue from global consumer banking and institutional client services. It leverages extensive branch networks across the Americas and Asia to provide retail and wholesale banking products. Its 2020 focus targeted strengthening international presence and integrating advanced trading and advisory services for institutional clients.
Strategic Collision: Similarities & Divergences
Both banks emphasize diversification across consumer and institutional segments, yet Bank of America invests heavily in digital retail scale, while Citigroup pursues global geographic expansion. Their primary battleground is corporate and institutional services where innovation and client breadth matter most. This divergence shapes distinct investment profiles: Bank of America as a retail-digital hybrid, Citigroup as a global wholesale specialist.
Income Statement Comparison
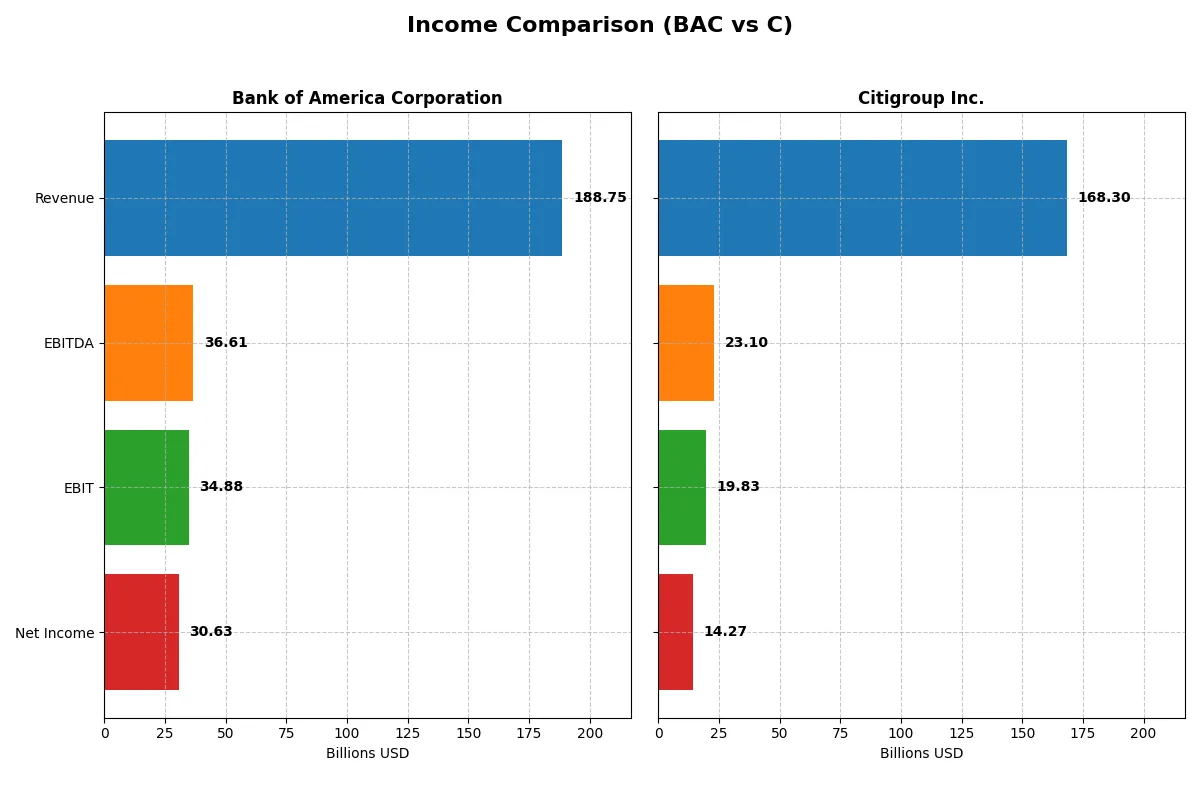
The following data dissects the core profitability and scalability of both corporate engines to reveal who dominates the bottom line:
| Metric | Bank of America Corporation (BAC) | Citigroup Inc. (C) |
|---|---|---|
| Revenue | 189B | 168B |
| Cost of Revenue | 84B | 93B |
| Operating Expenses | 70B | 55B |
| Gross Profit | 105B | 75B |
| EBITDA | 37B | 23B |
| EBIT | 35B | 20B |
| Interest Expense | 78B | 83B |
| Net Income | 31B | 14B |
| EPS | 3.88 | 7.23 |
| Fiscal Year | 2025 | 2025 |
Income Statement Analysis: The Bottom-Line Duel
This income statement comparison reveals which corporate engine delivers superior profitability and operational efficiency in the current financial landscape.
Bank of America Corporation Analysis
Bank of America’s revenue grew impressively by 101% from 2021 to 2025 but dipped slightly by 1.9% in the last year. Its gross margin stands strong at 55.4%, with net margin reaching 16.2%, indicating robust profitability. The 2025 year showed solid momentum, with net income rising 15% and EPS growing nearly 19%, reflecting improved operational efficiency.
Citigroup Inc. Analysis
Citigroup’s revenue climbed 111% over five years but declined 1.4% in 2025. Gross margin lags at 44.6%, and net margin sits at a modest 8.5%, signaling tighter profitability. Despite lower margins, 2025 net income grew 14% and EPS jumped 17.5%, showing positive earnings momentum but from a lower profitability base compared to peers.
Margin Strength vs. Growth Trajectory
Bank of America outperforms Citigroup with higher gross and net margins, translating into better bottom-line efficiency. While both companies saw revenue declines last year, BAC’s superior margin expansion and EPS growth position it as the fundamental winner in profitability. Investors seeking a stronger profit profile will find Bank of America’s efficiency more compelling than Citigroup’s revenue growth momentum.
Financial Ratios Comparison
These vital ratios act as a diagnostic tool to expose the underlying fiscal health, valuation premiums, and capital efficiency of the companies compared below:
| Ratios | Bank of America Corporation (BAC) | Citigroup Inc. (C) |
|---|---|---|
| ROE | 10.1% | 6.7% |
| ROIC | 3.4% | 0.9% |
| P/E | 13.2 | 14.9 |
| P/B | 1.34 | 1.00 |
| Current Ratio | 0.42 | 0.48 |
| Quick Ratio | 0.42 | 0.48 |
| D/E | 1.21 | 3.37 |
| Debt-to-Assets | 10.7% | 26.9% |
| Interest Coverage | 0.44 | 0.24 |
| Asset Turnover | 0.055 | 0.063 |
| Fixed Asset Turnover | 15.1 | 5.05 |
| Payout Ratio | 26.0% | 29.6% |
| Dividend Yield | 1.96% | 1.99% |
| Fiscal Year | 2025 | 2025 |
Efficiency & Valuation Duel: The Vital Signs
Financial ratios act as a company’s DNA, uncovering hidden risks and revealing operational strengths that define investment potential.
Bank of America Corporation
Bank of America exhibits solid profitability with a 10.1% ROE and a favorable 16.23% net margin, signaling operational competence. Its P/E of 13.23 and P/B of 1.34 mark the stock as attractively valued. The 1.96% dividend yield offers steady shareholder returns, balancing reinvestment with cash distribution.
Citigroup Inc.
Citigroup shows weaker profitability, with a 6.72% ROE and an 8.48% net margin, indicating below-par efficiency. The stock trades at a slightly higher P/E of 14.89 but maintains a fair P/B of 1.0. A 1.99% dividend yield supports shareholder income despite challenges in capital returns and leverage.
Balanced Valuation Meets Operational Strength
Bank of America delivers a stronger profitability profile and attractive valuation metrics compared to Citigroup, which struggles with lower returns. Investors prioritizing operational efficiency may favor Bank of America, while those focused on consistent dividend income might consider Citigroup’s steadier yield despite weaker fundamentals.
Which one offers the Superior Shareholder Reward?
I compare Bank of America (BAC) and Citigroup (C) focusing on their dividend yields, payout ratios, and buyback intensity. BAC yields 1.96% with a 26% payout ratio, while C yields 1.99% but with a higher 30% payout. Both sustain dividends through moderate payout ratios. BAC’s buyback program remains consistent, supporting shareholder returns amid stable free cash flow. Citigroup’s higher leverage and volatility in operating cash flow raise sustainability concerns despite a slightly higher dividend yield. I find BAC’s balanced distribution and healthier margins offer a more sustainable, superior total return in 2026.
Comparative Score Analysis: The Strategic Profile
The radar chart reveals the fundamental DNA and trade-offs of Bank of America Corporation and Citigroup Inc., highlighting their core financial strengths and vulnerabilities:
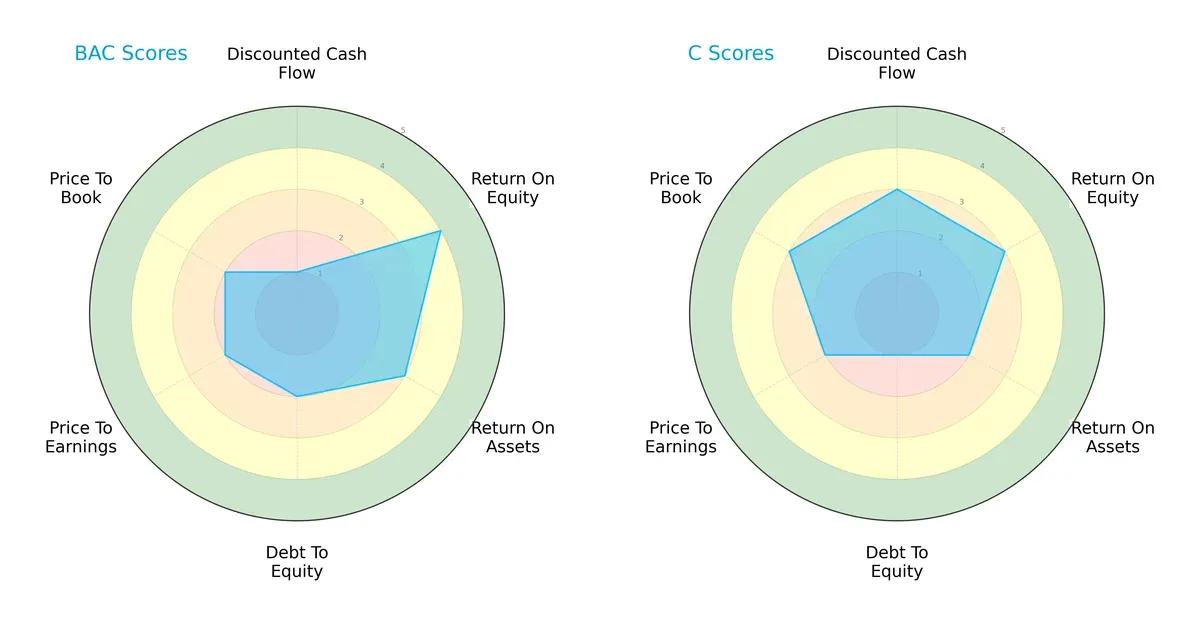
Bank of America shows a stronger Return on Equity (4 vs. 3) and Return on Assets (3 vs. 2), indicating better profitability and asset efficiency. Citigroup leads in Discounted Cash Flow (3 vs. 1) and Price-to-Book (3 vs. 2), suggesting slightly better valuation metrics. Both firms have moderate overall scores, but Bank of America presents a more balanced profile, while Citigroup relies on valuation edges amid weaker leverage control (Debt/Equity score 1 vs. 2).
Bankruptcy Risk: Solvency Showdown
Both companies reside in the distress zone with negative Altman Z-Scores, signaling elevated bankruptcy risk in this economic cycle:
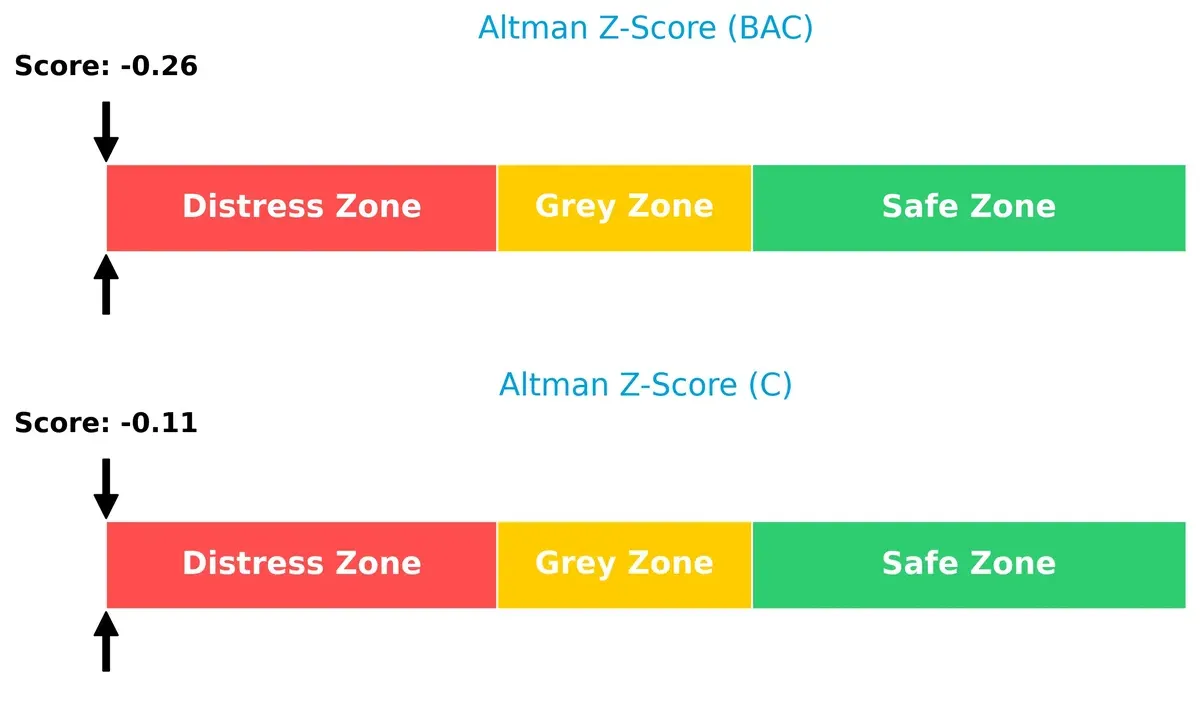
Bank of America’s score (-0.26) is marginally weaker than Citigroup’s (-0.11), implying slightly higher financial distress. These scores warn investors to exercise caution given ongoing solvency challenges in the banking sector.
Financial Health: Quality of Operations
Bank of America’s Piotroski F-Score (7) outperforms Citigroup’s (5), indicating stronger operational quality and financial health:
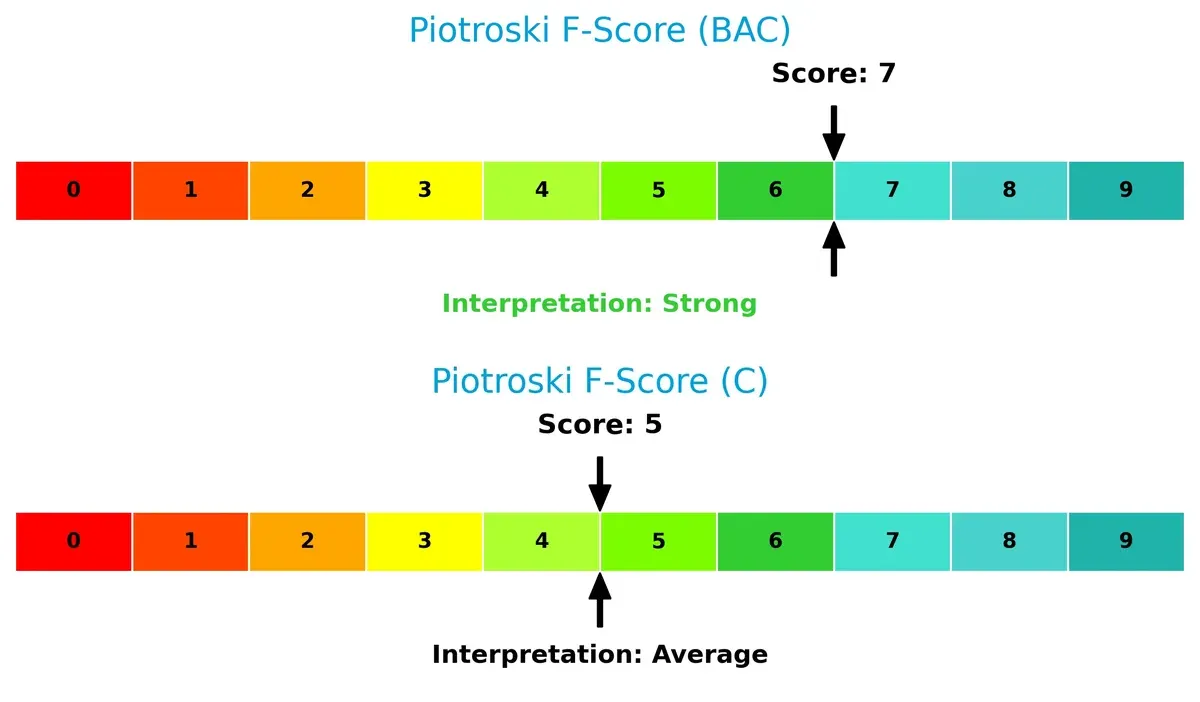
A score of 7 reflects robust profitability, liquidity, and efficiency metrics for Bank of America. Citigroup’s average score of 5 raises red flags about internal weaknesses and operational risks compared to its peer.
How are the two companies positioned?
This section dissects BAC and C’s operational DNA by comparing their revenue distribution and internal dynamics. The goal is to confront their economic moats and reveal which business model delivers the most resilient competitive advantage today.
Revenue Segmentation: The Strategic Mix
This visual comparison dissects how Bank of America Corporation and Citigroup Inc. diversify their income streams and where their primary sector bets lie:
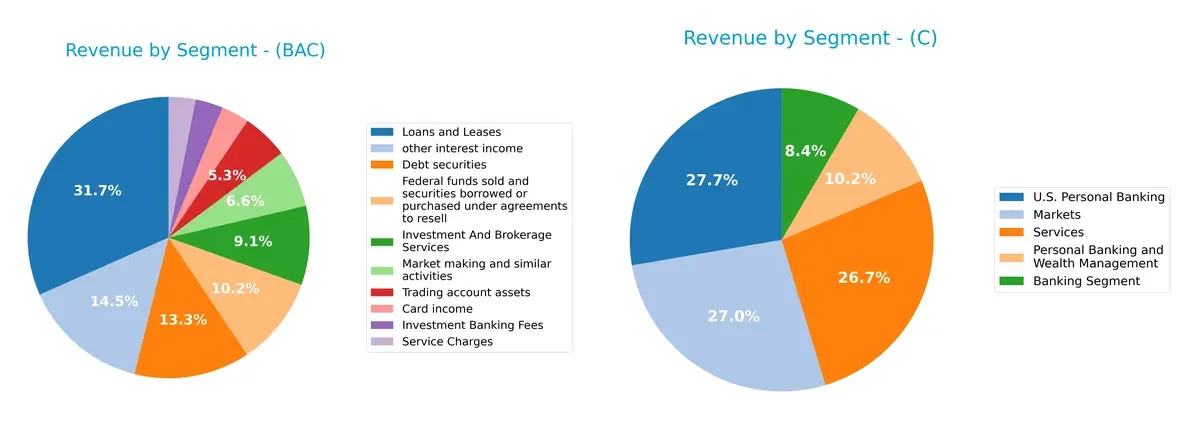
Bank of America anchors revenue in “Loans and Leases” at $62B, complemented by robust “Investment And Brokerage Services” at $17.8B, showing a balanced diversification across lending, trading, and fees. Citigroup pivots heavily on “U.S. Personal Banking” with $20.4B and nearly equal stakes in “Markets” ($19.8B) and “Services” ($19.6B), but its “Banking Segment” lags at $6.2B. BAC’s broader product spread reduces concentration risk, while C’s focus on personal banking and markets reflects a strategic bet on ecosystem lock-in in consumer and institutional services.
Strengths and Weaknesses Comparison
This table compares the strengths and weaknesses of Bank of America Corporation (BAC) and Citigroup Inc. (C):
BAC Strengths
- Favorable net margin at 16.23%
- Robust U.S. revenue at 88B USD
- Diverse product segments including loans and investment services
- Favorable fixed asset turnover at 15.08
- Moderate dividend yield near 2%
- Favorable debt-to-assets ratio at 10.73%
C Strengths
- Favorable price-to-earnings and price-to-book ratios
- Balanced global revenue split near 40B USD domestic and international
- Favorable debt-to-assets ratio at 26.94%
- Solid fixed asset turnover at 5.05
- Dividend yield close to 2%
- Extensive global presence with significant international revenues
BAC Weaknesses
- Unfavorable ROIC below WACC at 3.41% vs 14.53%
- Low current and quick ratios at 0.42 indicating liquidity concerns
- High debt-to-equity at 1.21
- Weak interest coverage at 0.44
- Asset turnover very low at 0.06
- Slightly unfavorable overall financial ratios at 50%
C Weaknesses
- Lower net margin at 8.48%
- Unfavorable ROE and ROIC below WACC
- Very high debt-to-equity at 3.37
- Low current and quick ratios at 0.48
- Weak interest coverage at 0.24
- Asset turnover also low at 0.06
- Slightly unfavorable overall financial ratios at 50%
Both banks demonstrate strengths in valuation metrics and dividend yields, with BAC showing stronger profitability and U.S. market dominance. However, both face liquidity and operational efficiency challenges. These factors underline their strategies’ need to address financial leverage and asset utilization.
The Moat Duel: Analyzing Competitive Defensibility
A structural moat is the only reliable shield protecting long-term profits from relentless competitive erosion in banking:
Bank of America Corporation: Cost Advantage and Scale Moat
Bank of America’s moat stems from its massive scale and efficient capital allocation, reflected in relatively stable margins despite industry pressure. However, its ROIC has declined, signaling rising challenges in sustaining value in 2026.
Citigroup Inc.: Global Diversification and Network Effects
Citigroup relies on broad geographic diversification and network effects in global markets, contrasting BAC’s U.S.-centric focus. Yet, its steeper ROIC decline warns of intensifying competition and margin compression ahead.
Scale and Diversification: The Clash of Banking Titans
Despite both banks showing declining ROICs below WACC, Bank of America’s scale grants it a deeper moat than Citigroup’s stretched international network. BAC stands better positioned to defend market share amid tightening financial sector competition.
Which stock offers better returns?
Both Bank of America Corporation and Citigroup Inc. showed strong price appreciation over the past year, with Citigroup exhibiting a more volatile and accelerated upward movement.
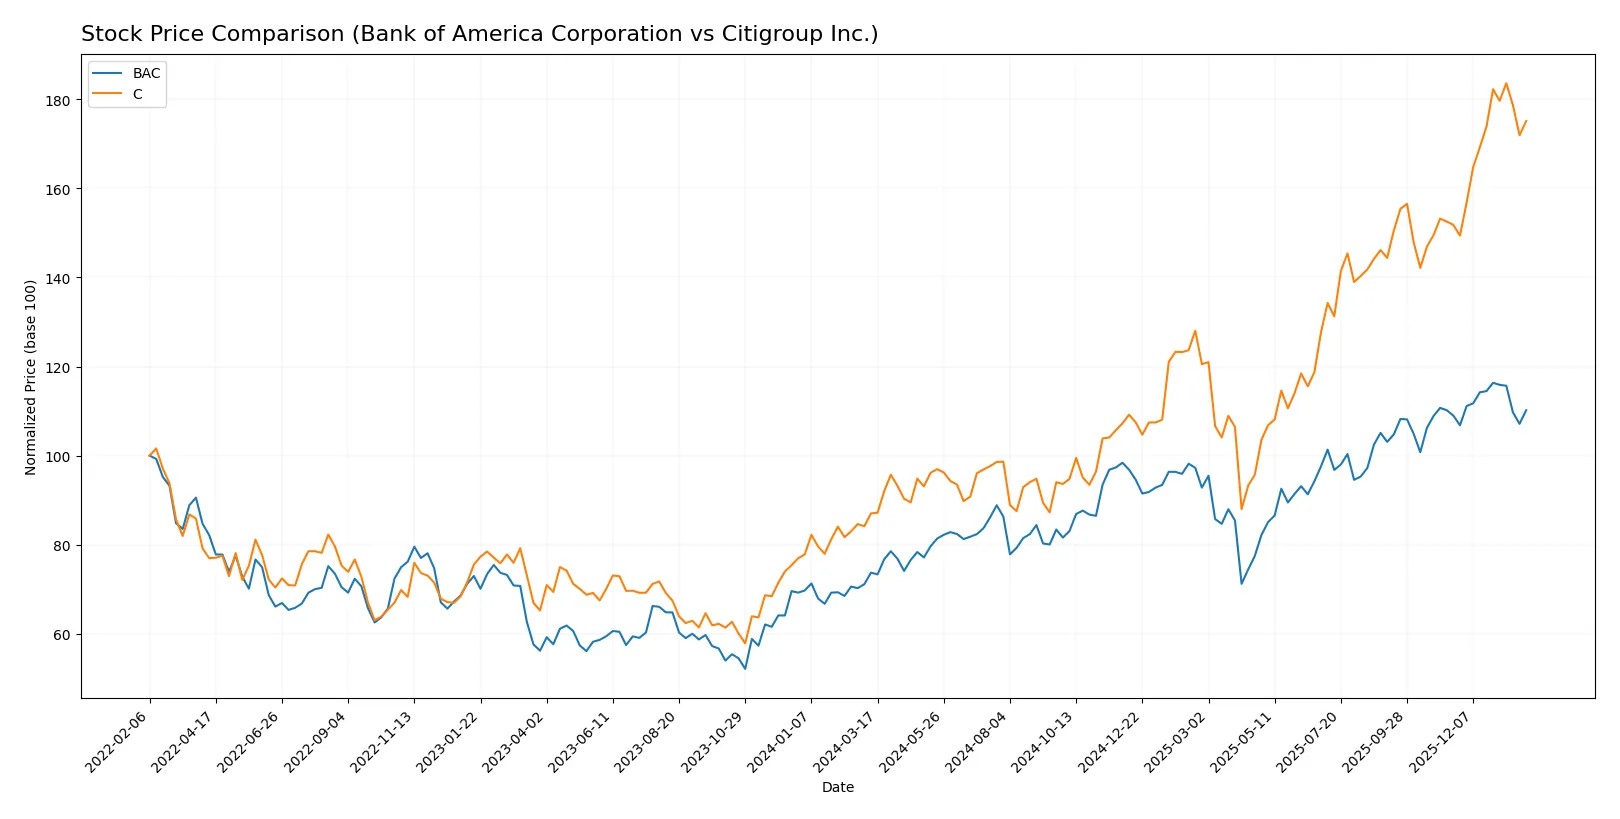
Trend Comparison
Bank of America’s stock rose 49.44% over the past 12 months, marking a bullish trend with decelerating momentum and a standard deviation of 5.66. The highest price hit 56.17, while the lowest was 34.39.
Citigroup’s stock surged 101.2% over the same period, showing a bullish trend with accelerating gains and higher volatility at a standard deviation of 18.09. The price ranged from 57.51 to a peak of 121.32.
Citigroup outperformed Bank of America in market returns and acceleration, delivering the highest gains despite greater price volatility during the year.
Target Prices
Analysts present a generally bullish consensus for Bank of America and Citigroup, reflecting optimism in diversified banking.
| Company | Target Low | Target High | Consensus |
|---|---|---|---|
| Bank of America Corporation | 50 | 71 | 60.33 |
| Citigroup Inc. | 87 | 150 | 130.55 |
Bank of America’s consensus target of 60.33 suggests modest upside from the current 53.2 stock price. Citigroup’s 130.55 consensus indicates significant growth potential versus its 115.71 price.

Don’t Let Luck Decide Your Entry Point
Optimize your entry points with our advanced ProRealTime indicators. You’ll get efficient buy signals with precise price targets for maximum performance. Start outperforming now!
How do institutions grade them?
Bank of America Corporation Grades
Here are the recent institutional grades assigned to Bank of America Corporation:
| Grading Company | Action | New Grade | Date |
|---|---|---|---|
| Keefe, Bruyette & Woods | maintain | Outperform | 2026-01-15 |
| Truist Securities | maintain | Buy | 2026-01-15 |
| Piper Sandler | maintain | Neutral | 2026-01-15 |
| TD Cowen | maintain | Buy | 2026-01-15 |
| Evercore ISI Group | maintain | Outperform | 2026-01-15 |
| Morgan Stanley | maintain | Overweight | 2026-01-15 |
| Wolfe Research | downgrade | Peer Perform | 2026-01-07 |
| TD Cowen | maintain | Buy | 2026-01-07 |
| Truist Securities | maintain | Buy | 2026-01-06 |
| Goldman Sachs | maintain | Buy | 2026-01-06 |
Citigroup Inc. Grades
Below are the recent institutional grades assigned to Citigroup Inc.:
| Grading Company | Action | New Grade | Date |
|---|---|---|---|
| RBC Capital | maintain | Outperform | 2026-01-15 |
| Oppenheimer | maintain | Outperform | 2026-01-15 |
| Morgan Stanley | maintain | Overweight | 2026-01-15 |
| Truist Securities | maintain | Buy | 2026-01-06 |
| Goldman Sachs | maintain | Buy | 2026-01-06 |
| Barclays | maintain | Overweight | 2026-01-05 |
| Wells Fargo | maintain | Overweight | 2026-01-05 |
| Piper Sandler | maintain | Overweight | 2025-12-30 |
| Truist Securities | maintain | Buy | 2025-12-18 |
| Keefe, Bruyette & Woods | maintain | Outperform | 2025-12-17 |
Which company has the best grades?
Both companies receive strong institutional support, but Citigroup shows a slightly higher concentration of Outperform and Overweight grades. This may attract investors seeking firms with consistent analyst confidence.
Risks specific to each company
The following categories identify the critical pressure points and systemic threats facing both firms in the 2026 market environment:
1. Market & Competition
Bank of America Corporation
- Faces intense competition in diversified banking, benefiting from a large retail base and digital platforms.
Citigroup Inc.
- Competes globally with a strong presence in emerging markets but faces pressure from regional players and fintech disruption.
2. Capital Structure & Debt
Bank of America Corporation
- Moderate debt-to-equity ratio (1.21) with favorable debt-to-assets (10.73%), but low interest coverage (0.44) raises red flags.
Citigroup Inc.
- High debt-to-equity (3.37) signals elevated financial risk despite favorable debt-to-assets (26.94%); interest coverage is weaker at 0.24.
3. Stock Volatility
Bank of America Corporation
- Beta at 1.295 indicates slightly higher volatility than the market; trading range suggests moderate price fluctuation.
Citigroup Inc.
- Slightly lower beta at 1.166 signals marginally less volatility; wider price range reflects episodic market swings.
4. Regulatory & Legal
Bank of America Corporation
- Subject to stringent US banking regulations; compliance costs and potential fines remain ongoing risks.
Citigroup Inc.
- Operates in multiple jurisdictions increasing regulatory complexity and exposure to cross-border compliance risks.
5. Supply Chain & Operations
Bank of America Corporation
- Robust domestic operations with over 4,200 financial centers; digital platform stability is critical.
Citigroup Inc.
- More geographically diversified operations increase operational complexity and dependence on third-party providers abroad.
6. ESG & Climate Transition
Bank of America Corporation
- Increasing ESG investments; pressure to reduce carbon footprint and align lending with climate goals.
Citigroup Inc.
- Faces challenges integrating ESG across global operations, especially in regions with weaker environmental regulations.
7. Geopolitical Exposure
Bank of America Corporation
- Primarily US-focused with limited direct geopolitical risk but vulnerable to US policy shifts.
Citigroup Inc.
- High international exposure across volatile regions heightens geopolitical and currency risks.
Which company shows a better risk-adjusted profile?
Bank of America’s biggest risk lies in its weak interest coverage and liquidity ratios, signaling potential financial strain. Citigroup’s elevated leverage and geopolitical exposure pose the greatest threats. Despite both having “slightly unfavorable” financial ratios, Bank of America’s stronger capital structure and domestic focus grant it a better risk-adjusted profile. Notably, both firms dwell in the Altman Z-Score distress zone, but Bank of America’s stronger Piotroski score (7 vs. 5) reflects relatively superior financial health and operational stability.
Final Verdict: Which stock to choose?
Bank of America Corporation (BAC) stands out for its operational resilience and steady cash generation. Its superpower lies in efficient cost management and improving profitability despite challenging industry conditions. However, its low liquidity ratios warrant vigilance. BAC suits investors targeting aggressive growth with a tolerance for cyclical risks.
Citigroup Inc. (C) offers a strategic moat through diversified global operations and a strong focus on recurring revenue streams. It appears comparatively riskier due to higher leverage but provides a cushion of relative stability versus BAC’s volatility. C fits well within a GARP (Growth at a Reasonable Price) portfolio seeking balanced growth and income.
If you prioritize operational efficiency and improving margin dynamics, BAC is the compelling choice due to its stronger income growth and cost discipline. However, if you seek diversification with a focus on recurring revenue and moderate risk, C offers better stability and a more defensive profile. Both stocks show value challenges, demanding careful risk assessment aligned with your investment strategy.
Disclaimer: Investment carries a risk of loss of initial capital. The past performance is not a reliable indicator of future results. Be sure to understand risks before making an investment decision.
Go Further
I encourage you to read the complete analyses of Bank of America Corporation and Citigroup Inc. to enhance your investment decisions: