Home > Comparison > Consumer Cyclical > SW vs BALL
The strategic rivalry between Smurfit Westrock Plc and Ball Corporation shapes the packaging sector’s competitive landscape. Smurfit Westrock operates as a capital-intensive manufacturer of paper-based packaging, serving diverse consumer markets globally. In contrast, Ball Corporation focuses on high-margin aluminum packaging with aerospace technology diversification. This analysis will clarify which company’s operational model delivers superior risk-adjusted returns, guiding portfolio allocation in a sector balancing tradition and innovation.
Table of contents
Companies Overview
Smurfit Westrock and Ball Corporation both hold critical roles in the global packaging industry, shaping how consumer goods reach markets.
Smurfit Westrock Plc: Global Paper-Based Packaging Leader
Smurfit Westrock dominates the paper-based packaging sector, manufacturing containerboard and corrugated products. It generates revenue through selling packaging materials to food, beverage, e-commerce, and industrial clients. In 2026, its strategic focus remains on expanding sustainable paper packaging solutions and boosting recycling capabilities to meet rising environmental demands.
Ball Corporation: Aluminum Packaging and Aerospace Innovator
Ball Corporation specializes in aluminum packaging primarily for beverages, alongside a significant aerospace technology segment. It earns revenue by supplying aluminum containers globally and developing aerospace hardware and systems. The company emphasizes innovation in lightweight beverage packaging and advanced aerospace technologies to strengthen its diversified industrial footprint.
Strategic Collision: Similarities & Divergences
Both firms compete in packaging but diverge in their material focus—Smurfit Westrock prioritizes paper, while Ball leads in aluminum. Their primary battle is for market share in sustainable consumer packaging. Smurfit Westrock leverages volume and recycling; Ball relies on technological innovation and aerospace diversification. These distinctions create contrasting investment profiles: one rooted in traditional packaging scale, the other in high-tech and specialty markets.
Income Statement Comparison
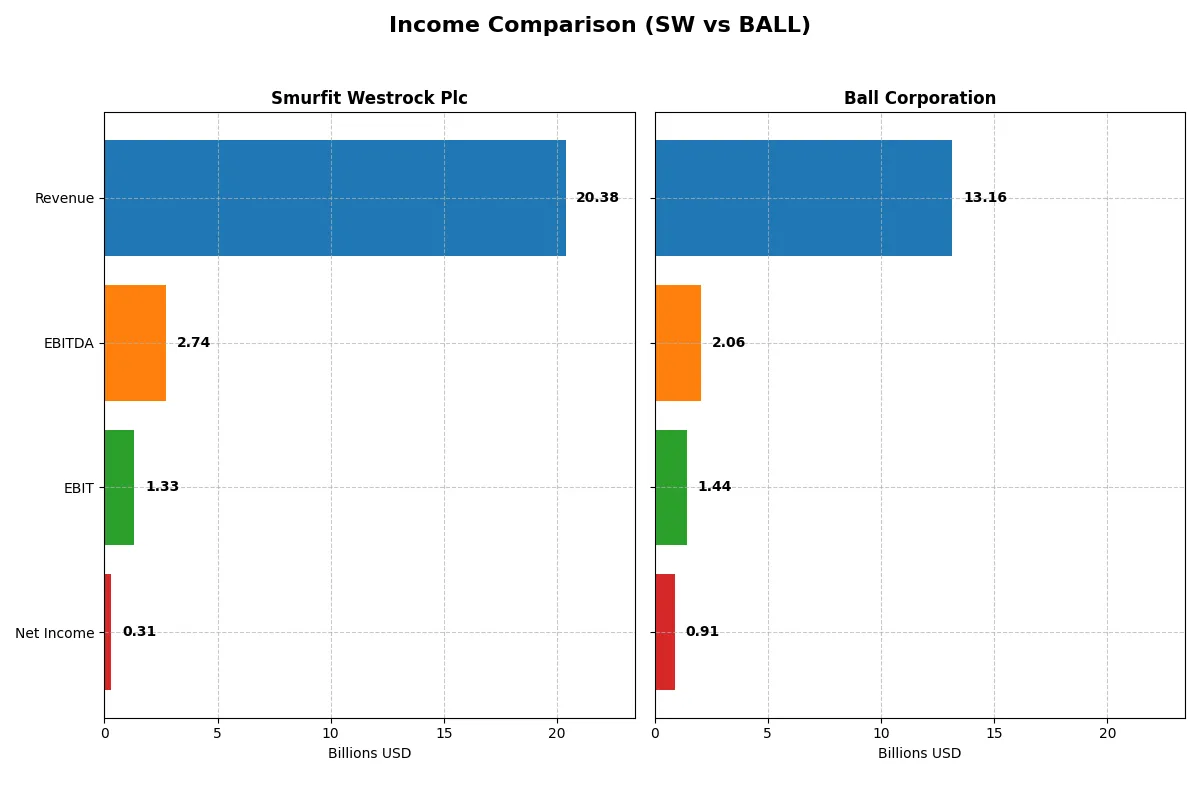
This data dissects the core profitability and scalability of both corporate engines to reveal who dominates the bottom line:
| Metric | Smurfit Westrock Plc (SW) | Ball Corporation (BALL) |
|---|---|---|
| Revenue | 20.4B | 13.2B |
| Cost of Revenue | 16.3B | 11.2B |
| Operating Expenses | 3.1B | 566M |
| Gross Profit | 4.0B | 2.0B |
| EBITDA | 2.7B | 2.1B |
| EBIT | 1.3B | 1.4B |
| Interest Expense | 507M | 314M |
| Net Income | 308M | 912M |
| EPS | 0.80 | 3.33 |
| Fiscal Year | 2024 | 2025 |
Income Statement Analysis: The Bottom-Line Duel
This income statement comparison exposes which company converts revenue into profit more efficiently and sustains margin strength under shifting market conditions.
Smurfit Westrock Plc Analysis
Smurfit Westrock’s revenue surged 86% from 2023 to 2024, reaching $20.4B, yet net income plunged 78% to $308M. Gross margin held steady near 20%, but net margin collapsed to 1.5%. Despite strong top-line momentum, rising operating expenses eroded bottom-line profitability in 2024, signaling efficiency challenges.
Ball Corporation Analysis
Ball Corporation posted a solid 11.5% revenue increase to $13.2B in 2025, with net income at $912M. Gross margin hovered around 15%, while net margin improved to nearly 7%. EBIT grew sharply by 72%, reflecting operational leverage and disciplined cost control, which underpinned a favorable income statement trend overall.
Margin Resilience vs. Growth Volatility
Ball Corporation delivers a more balanced profile with consistent margin expansion and moderate revenue growth. Smurfit Westrock’s explosive revenue gain contrasts sharply with its collapsing net margin and earnings. For investors prioritizing profitability stability, Ball’s disciplined margin management offers a more attractive earnings foundation.
Financial Ratios Comparison
These vital ratios act as a diagnostic tool to expose the underlying fiscal health, valuation premiums, and capital efficiency of the companies compared below:
| Ratios | Smurfit Westrock Plc (SW) | Ball Corporation (BALL) |
|---|---|---|
| ROE | 1.77% | 16.82% |
| ROIC | 1.48% | 7.83% |
| P/E | 67.5 | 15.9 |
| P/B | 1.20 | 2.68 |
| Current Ratio | 1.37 | 1.11 |
| Quick Ratio | 0.89 | 0.75 |
| D/E (Debt-to-Equity) | 0.78 | 1.29 |
| Debt-to-Assets | 31.1% | 35.9% |
| Interest Coverage | 1.92 | 4.43 |
| Asset Turnover | 0.47 | 0.67 |
| Fixed Asset Turnover | 0.90 | 1.98 |
| Payout Ratio | 211% | 24% |
| Dividend Yield | 3.13% | 1.51% |
| Fiscal Year | 2024 | 2025 |
Efficiency & Valuation Duel: The Vital Signs
Financial ratios act as a company’s DNA, uncovering hidden risks and operational excellence beyond surface-level metrics.
Smurfit Westrock Plc
Smurfit Westrock shows weak profitability, with ROE at 1.77% and a stretched P/E of 67.5, signaling an expensive valuation. Margins suffer, reflecting operational inefficiencies. Its dividend yield of 3.13% provides steady shareholder returns, offsetting low reinvestment in growth or R&D.
Ball Corporation
Ball Corporation exhibits strong profitability, boasting a favorable ROE of 16.82% and a reasonable P/E near 16, indicating fair valuation. Margins are stable with a neutral net margin at 6.93%. Dividend yield at 1.51% complements moderate reinvestment, balancing shareholder returns and future growth.
Balanced Operational Efficiency vs. Valuation Discipline
Ball Corporation offers a superior balance of risk and reward, combining efficient profitability with a fair valuation. Smurfit Westrock’s high valuation and weak returns suggest greater risk. Investors favoring steady income may prefer Smurfit Westrock; those seeking growth and operational efficiency align better with Ball.
Which one offers the Superior Shareholder Reward?
I see Smurfit Westrock Plc (SW) delivers a stronger dividend yield near 4% with a sustainable payout ratio around 52%. Their buybacks are modest but consistent, supporting shareholder value steadily. Ball Corporation (BALL) yields under 1.5%, with a low payout ratio near 24%, favoring reinvestment and growth. BALL’s buybacks are more aggressive but less predictable, adding volatility. Historically, SW’s balanced distribution approach provides a more reliable total return in 2026’s uncertain markets. I judge SW offers the superior shareholder reward due to its blend of healthy dividends and prudent buybacks.
Comparative Score Analysis: The Strategic Profile
The radar chart reveals the fundamental DNA and trade-offs of Smurfit Westrock Plc and Ball Corporation, highlighting their strategic strengths and weaknesses across key financial metrics:
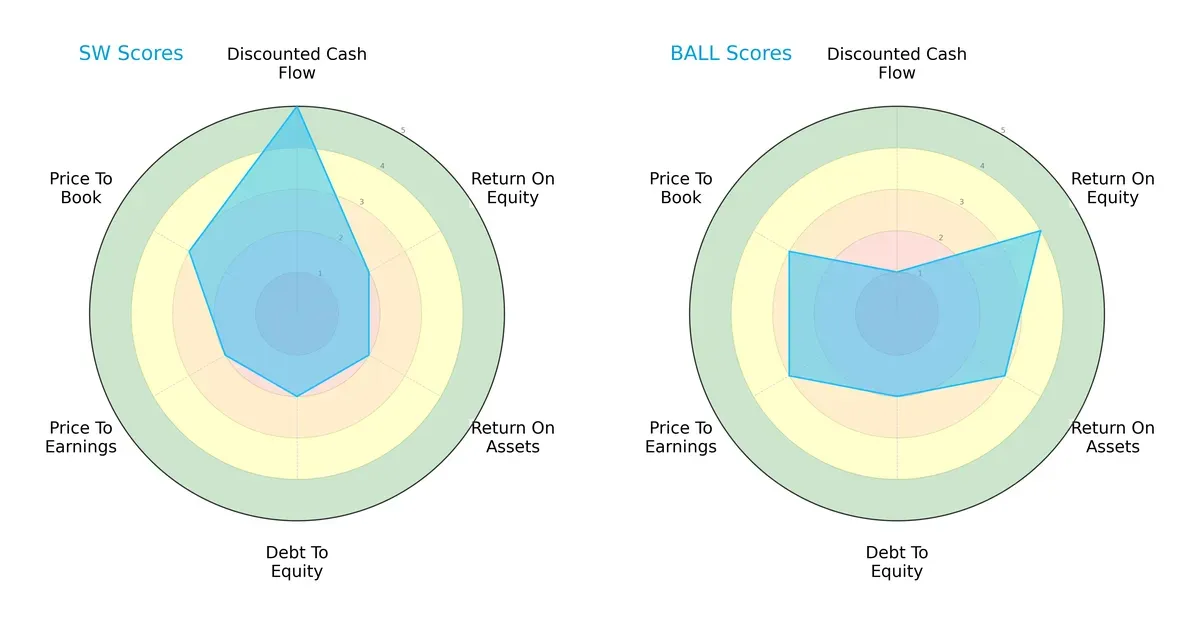
Smurfit Westrock excels in discounted cash flow valuation, scoring a very favorable 5, but lags in profitability and leverage metrics with low ROE, ROA, and debt-to-equity scores at 2 each. Ball Corporation shows strength in profitability, with a robust ROE of 4 and decent ROA of 3, but suffers from a very unfavorable DCF score of 1. Both companies share moderate valuation scores, but Ball’s profile is more balanced due to its higher operational efficiency, while Smurfit Westrock relies heavily on cash flow valuation.
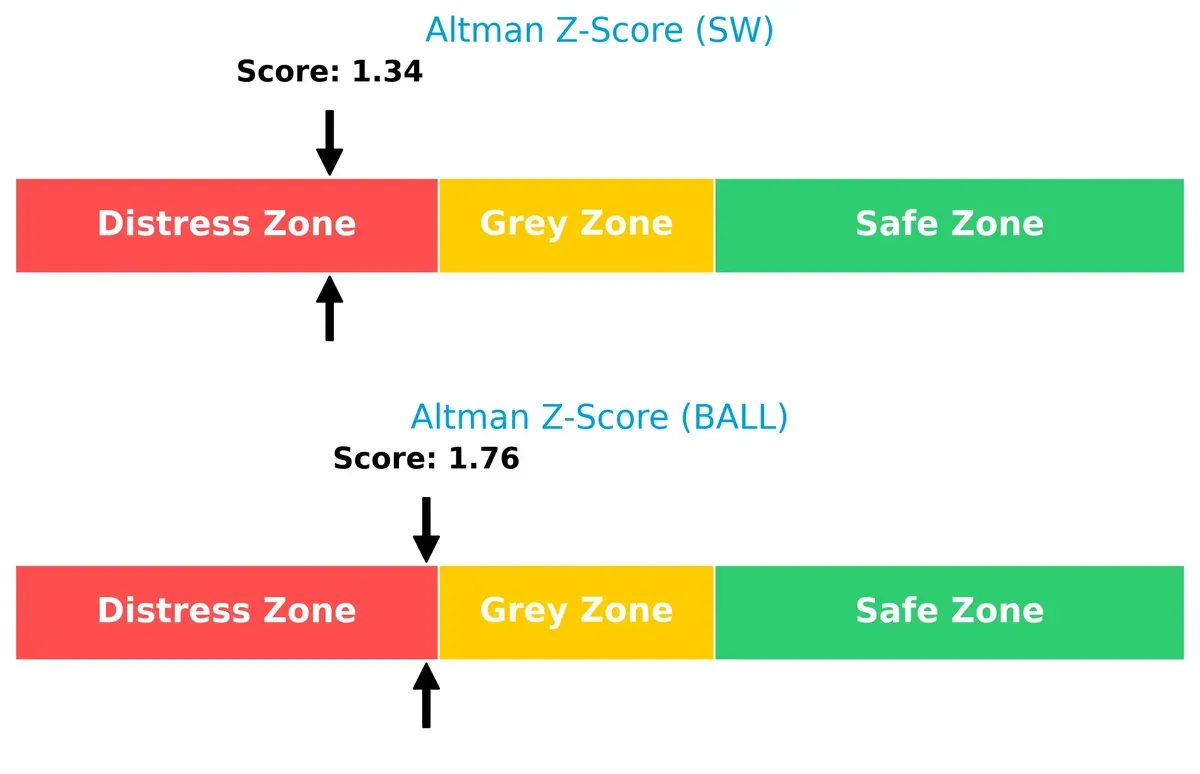
Bankruptcy Risk: Solvency Showdown
The Altman Z-Scores place both firms in the distress zone, with Smurfit Westrock at 1.34 and Ball Corporation at 1.76, signaling elevated bankruptcy risk in the current economic cycle:
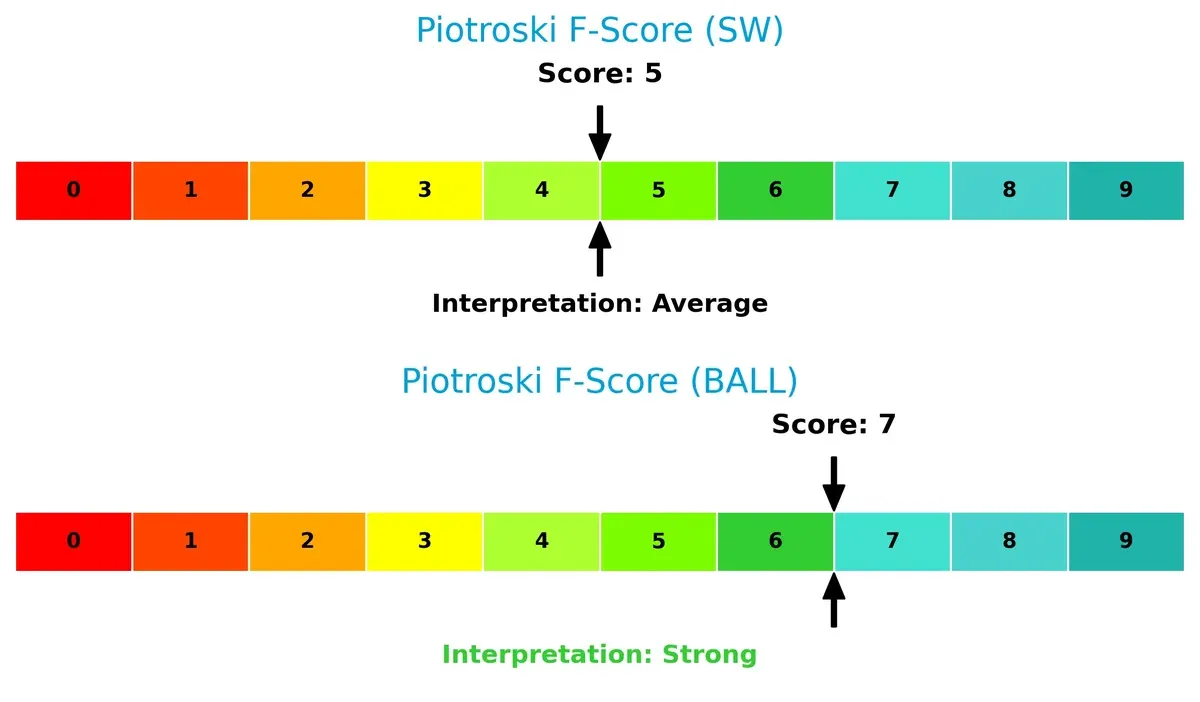
Financial Health: Quality of Operations
Ball Corporation leads with a Piotroski F-Score of 7, indicating strong financial health and operational quality. Smurfit Westrock’s score of 5 is average, suggesting some internal weaknesses versus its peer:
How are the two companies positioned?
This section dissects the operational DNA of Smurfit Westrock and Ball by comparing their revenue distribution and internal dynamics. The final objective is to confront their economic moats to identify which model offers the most resilient, sustainable competitive advantage today.
Revenue Segmentation: The Strategic Mix
This visual comparison dissects how Smurfit Westrock Plc and Ball Corporation diversify income streams and highlights their primary sector bets:
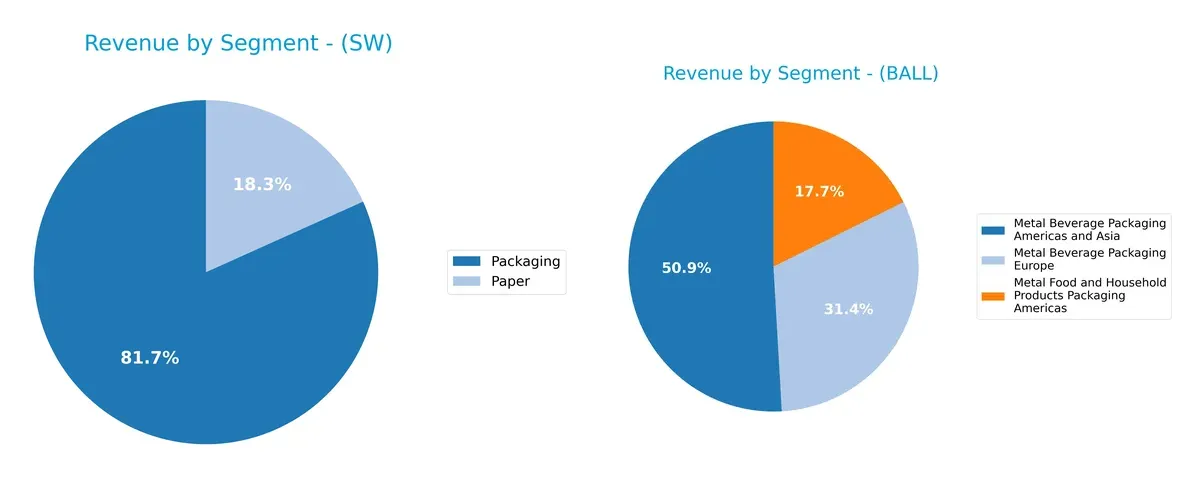
Smurfit Westrock anchors 82% of revenue in Packaging (€17.3B) with Paper trailing at €3.9B, showing moderate diversification. Ball Corporation divides revenue across three metal packaging segments, with Metal Beverage Packaging Americas and Asia dominating at $5.6B. Ball’s broader segment spread reduces concentration risk. Smurfit’s focus reveals strength in packaging innovation but higher exposure to paper market cycles, while Ball leverages geographic and product diversity for resilience.
Strengths and Weaknesses Comparison
This table compares the Strengths and Weaknesses of Smurfit Westrock Plc and Ball Corporation:
Smurfit Westrock Plc Strengths
- Strong global presence with diverse revenues across Americas, Europe, and MEA/APAC
- Favorable WACC at 5.66% supports cost-efficient capital
- Solid dividend yield of 3.13% attracts income investors
Ball Corporation Strengths
- Robust profitability with 16.8% ROE and 7.8% ROIC
- Diverse product segments across beverage and food packaging
- Favorable WACC at 7.71% indicating capital efficiency
Smurfit Westrock Plc Weaknesses
- Low profitability metrics: 1.5% net margin, 1.8% ROE, and 1.5% ROIC are unfavorable
- High P/E ratio at 67.5 suggests overvaluation risk
- Weak asset turnover ratios limit operational efficiency
Ball Corporation Weaknesses
- Elevated debt-to-equity ratio at 1.29 signals higher leverage risk
- Quick ratio of 0.75 indicates potential short-term liquidity constraints
- Moderate net margin at 6.9% and P/B at 2.68 remain neutral
Both companies present contrasting profiles. Smurfit Westrock shows broader geographic diversification and attractive dividend yield but struggles with profitability and efficiency. Ball Corporation delivers stronger returns and product diversification but carries higher leverage and liquidity risks. These factors shape their strategic positioning differently in the packaging sector.
The Moat Duel: Analyzing Competitive Defensibility
A structural moat is the only shield protecting long-term profits from relentless competition erosion. Let’s dissect the core moats of two packaging giants:
Smurfit Westrock Plc: Asset-Heavy Scale and Vertical Integration
Smurfit Westrock’s moat stems from its extensive asset base and vertical integration in paper-based packaging. This manifests as stable gross margins near 20%, yet eroding returns and declining ROIC warn of weakening defensibility. Expansion into new markets in 2026 may strain margins further unless operational efficiencies improve.
Ball Corporation: Innovation-Driven Aluminum Packaging and Aerospace Synergies
Ball’s moat relies on innovation and diversification into aerospace alongside aluminum containers, differentiating it from Smurfit Westrock’s traditional focus. It sustains higher EBIT margins near 11% and shows a slight ROIC growth trend, signaling improving competitive positioning. Future growth hinges on leveraging aerospace tech and expanding beverage packaging globally.
Asset Scale vs. Innovation Edge: Which Moat Holds Stronger?
Smurfit Westrock’s scale-based moat is deep but deteriorating fast, with value destruction evident in declining ROIC. Ball Corporation, though not yet a fortress, shows a widening moat through rising profitability and diversification. I view Ball as better equipped to defend and grow its market share in 2026.
Which stock offers better returns?
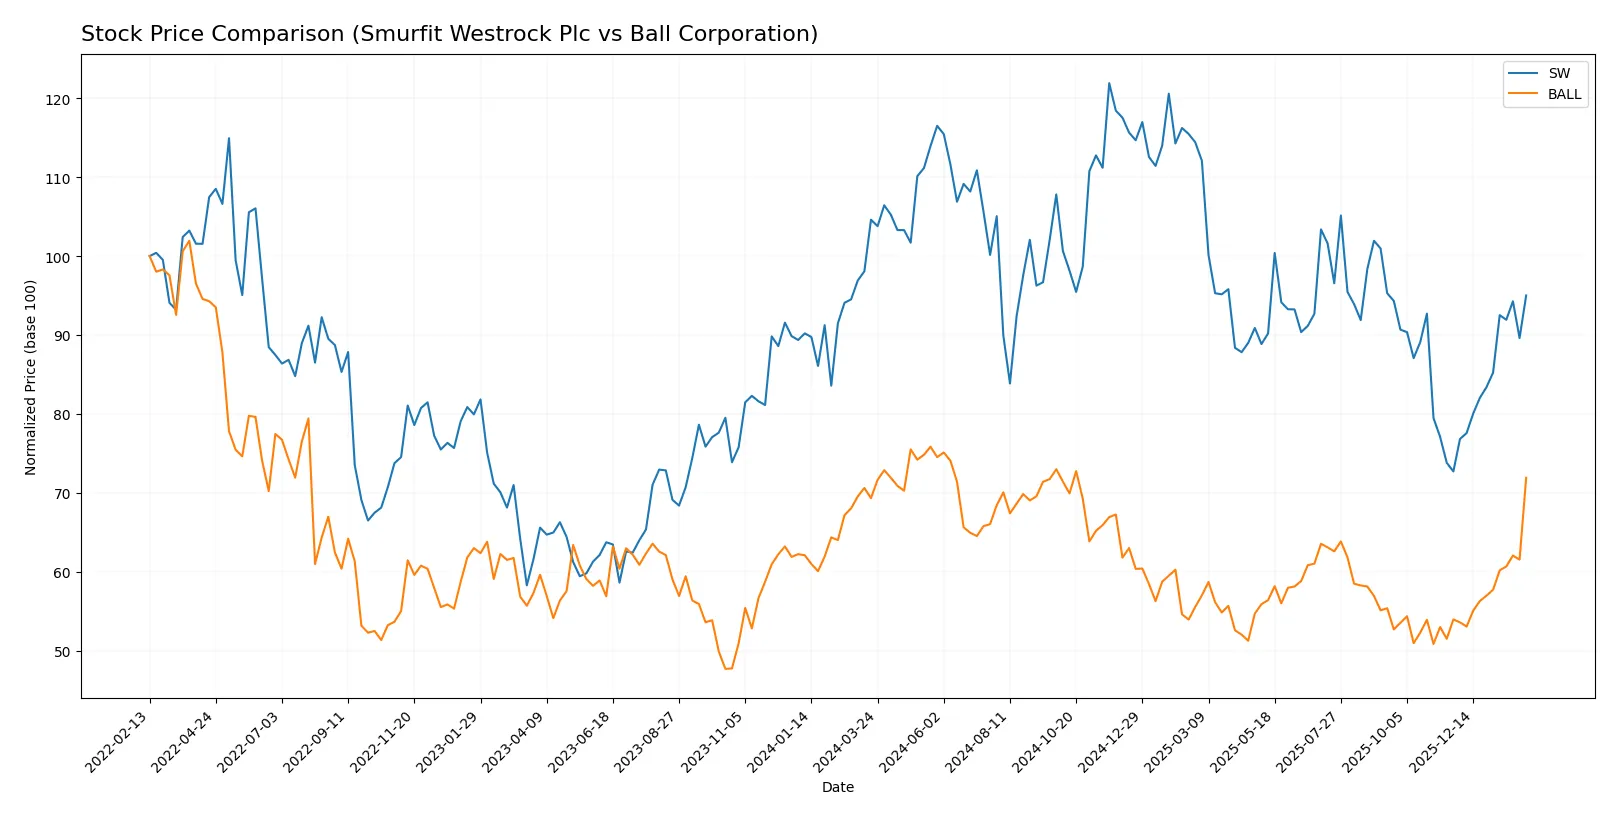
Over the past 12 months, Smurfit Westrock Plc and Ball Corporation exhibited divergent price movements, with notable acceleration in recent months and distinct trading volume dynamics.
Trend Comparison
Smurfit Westrock Plc’s stock declined 9.18% over the past year, marking a bearish trend with accelerating downward momentum and a high volatility of 5.32%. The price ranged from 56.64 to 33.78.
Ball Corporation’s stock rose 3.73% over the same period, showing a bullish trend with accelerating gains and higher volatility at 6.67%. Its price fluctuated between 47.0 and 70.11.
Ball Corporation outperformed Smurfit Westrock Plc in total market returns over the past year, delivering positive growth versus a significant decline in SW’s stock price.
Target Prices
Analysts present a clear target price consensus for Smurfit Westrock Plc and Ball Corporation.
| Company | Target Low | Target High | Consensus |
|---|---|---|---|
| Smurfit Westrock Plc | 45 | 60 | 51 |
| Ball Corporation | 66 | 75 | 69.86 |
Smurfit Westrock’s consensus target of 51 sits above its current 44.14 price, signaling upside potential. Ball Corporation’s target near 70 also exceeds its 66.47 stock price, reflecting moderate growth expectations.

Don’t Let Luck Decide Your Entry Point
Optimize your entry points with our advanced ProRealTime indicators. You’ll get efficient buy signals with precise price targets for maximum performance. Start outperforming now!
How do institutions grade them?
The following tables summarize the latest institutional grades assigned to Smurfit Westrock Plc and Ball Corporation:
Smurfit Westrock Plc Grades
This table presents recent grades and rating actions from major financial institutions for Smurfit Westrock Plc.
| Grading Company | Action | New Grade | Date |
|---|---|---|---|
| Truist Securities | Maintain | Buy | 2026-01-06 |
| Wells Fargo | Maintain | Overweight | 2026-01-06 |
| Citigroup | Maintain | Buy | 2026-01-06 |
| Argus Research | Maintain | Buy | 2025-12-09 |
| Barclays | Maintain | Overweight | 2025-11-10 |
| Truist Securities | Maintain | Buy | 2025-10-30 |
| RBC Capital | Maintain | Outperform | 2025-10-30 |
| Wells Fargo | Maintain | Overweight | 2025-10-30 |
| Truist Securities | Maintain | Buy | 2025-10-13 |
| Wells Fargo | Upgrade | Overweight | 2025-10-07 |
Ball Corporation Grades
This table summarizes the latest institutional grades and rating changes for Ball Corporation.
| Grading Company | Action | New Grade | Date |
|---|---|---|---|
| Citigroup | Maintain | Buy | 2026-02-05 |
| JP Morgan | Maintain | Neutral | 2026-02-04 |
| Wells Fargo | Maintain | Overweight | 2026-02-04 |
| Mizuho | Maintain | Outperform | 2026-02-04 |
| Truist Securities | Maintain | Buy | 2026-02-04 |
| Jefferies | Maintain | Buy | 2026-02-04 |
| UBS | Maintain | Neutral | 2026-01-12 |
| Truist Securities | Maintain | Buy | 2026-01-06 |
| Citigroup | Upgrade | Buy | 2026-01-06 |
| Wells Fargo | Upgrade | Overweight | 2026-01-06 |
Which company has the best grades?
Both companies benefit from predominantly positive grades, with strong buy and overweight ratings common. Ball Corporation shows a slightly broader support from diverse firms, including recent upgrades. Investors may see this as a signal of sustained confidence in Ball’s prospects relative to Smurfit Westrock.
Risks specific to each company
The following categories identify critical pressure points and systemic threats facing Smurfit Westrock Plc and Ball Corporation in the 2026 market environment:
1. Market & Competition
Smurfit Westrock Plc
- Faces intense competition in paper-based packaging, pressured by low net margins and weak asset turnover.
Ball Corporation
- Competes in aluminum packaging and aerospace, benefiting from higher profitability and diversified segments.
2. Capital Structure & Debt
Smurfit Westrock Plc
- Moderate debt with neutral debt-to-assets and interest coverage ratios; manageable but not conservative leverage.
Ball Corporation
- Higher debt-to-equity ratio signals greater financial risk; interest coverage is better but leverage remains a concern.
3. Stock Volatility
Smurfit Westrock Plc
- Beta near 1.0 indicates average volatility aligned with the market.
Ball Corporation
- Slightly higher beta at 1.14 suggests elevated stock price sensitivity to market swings.
4. Regulatory & Legal
Smurfit Westrock Plc
- Exposure to international packaging regulations, especially in EU markets; paper industry environmental rules tightening.
Ball Corporation
- Aerospace segment faces strict defense and export controls; packaging units contend with US and global compliance demands.
5. Supply Chain & Operations
Smurfit Westrock Plc
- Relies heavily on recycled paper supply; operational efficiency is low given unfavorable fixed asset turnover.
Ball Corporation
- More efficient asset use; diversified supply chains in metals and aerospace components reduce bottleneck risk.
6. ESG & Climate Transition
Smurfit Westrock Plc
- Faces pressure to reduce carbon footprint in paper production; recycling focus is a competitive advantage but costly.
Ball Corporation
- Aluminum production’s environmental impact is significant; aerospace segment invests in sustainable technologies to offset risks.
7. Geopolitical Exposure
Smurfit Westrock Plc
- International operations expose the firm to Brexit and EU trade policy volatility.
Ball Corporation
- US-based with global operations; aerospace exposure to geopolitical tensions and export restrictions is material.
Which company shows a better risk-adjusted profile?
Smurfit Westrock’s greatest risk lies in weak profitability and operational inefficiencies amid evolving environmental regulations. Ball Corporation’s highest risk is elevated financial leverage combined with geopolitical sensitivity in aerospace. Despite its higher debt, Ball’s stronger profitability and operational metrics offer a more balanced risk-adjusted profile. Notably, Smurfit Westrock’s Altman Z-Score in the distress zone signals urgent financial vulnerability, underscoring my caution.
Final Verdict: Which stock to choose?
Smurfit Westrock Plc’s superpower lies in its robust cash generation and solid dividend yield, appealing to those valuing income streams. However, its declining profitability and value destruction flag caution. It suits investors with a higher risk tolerance focused on turnaround potential and income.
Ball Corporation boasts a strategic moat with improving profitability and operational efficiency, underpinned by a growing ROIC trend. Its relative financial stability and stronger returns position it as a safer pick. It fits well within Growth at a Reasonable Price (GARP) portfolios seeking steady expansion.
If you prioritize income generation with potential upside from operational improvements, Smurfit Westrock might be compelling despite its risks. However, if you seek a more stable growth trajectory with improving capital efficiency, Ball Corporation offers better stability and a clearer path to value creation.
Disclaimer: Investment carries a risk of loss of initial capital. The past performance is not a reliable indicator of future results. Be sure to understand risks before making an investment decision.
Go Further
I encourage you to read the complete analyses of Smurfit Westrock Plc and Ball Corporation to enhance your investment decisions: