Home > Comparison > Consumer Cyclical > PKG vs BALL
The strategic rivalry between Packaging Corporation of America and Ball Corporation defines the current trajectory of the packaging sector. Packaging Corporation of America operates as a containerboard and corrugated packaging manufacturer focused on diversified consumer goods. Ball Corporation blends aluminum beverage packaging with a significant aerospace technology division. This analysis evaluates their contrasting corporate models to identify which offers superior risk-adjusted returns for a balanced portfolio.
Table of contents
Companies Overview
Packaging Corporation of America and Ball Corporation stand as key players in the packaging industry, each commanding significant market influence.
Packaging Corporation of America: Leader in Corrugated Packaging
Packaging Corporation of America dominates the US containerboard and corrugated packaging market. It generates revenue by producing shipping containers, retail displays, and specialty packaging for food and industrial goods. In 2026, its strategic focus sharpened on direct sales and expanding its paper products segment, reinforcing its competitive edge in sustainable and versatile packaging solutions.
Ball Corporation: Aluminum Packaging & Aerospace Innovator
Ball Corporation excels in aluminum beverage packaging globally, serving carbonated drinks and beer markets. Its diversified revenue streams include aerospace technologies and defense systems, broadening its industrial footprint. The company’s 2026 strategy emphasizes growth in beverage packaging across international markets while advancing aerospace and satellite technology capabilities.
Strategic Collision: Similarities & Divergences
Both companies thrive in packaging but pursue different philosophies: Packaging Corp. centers on corrugated and paper-based solutions while Ball leverages aluminum and aerospace diversification. Their core battle lies in sustainable packaging innovation and global market penetration. Packaging Corp. offers a focused packaging play, whereas Ball presents a hybrid industrial and packaging investment profile.
Income Statement Comparison
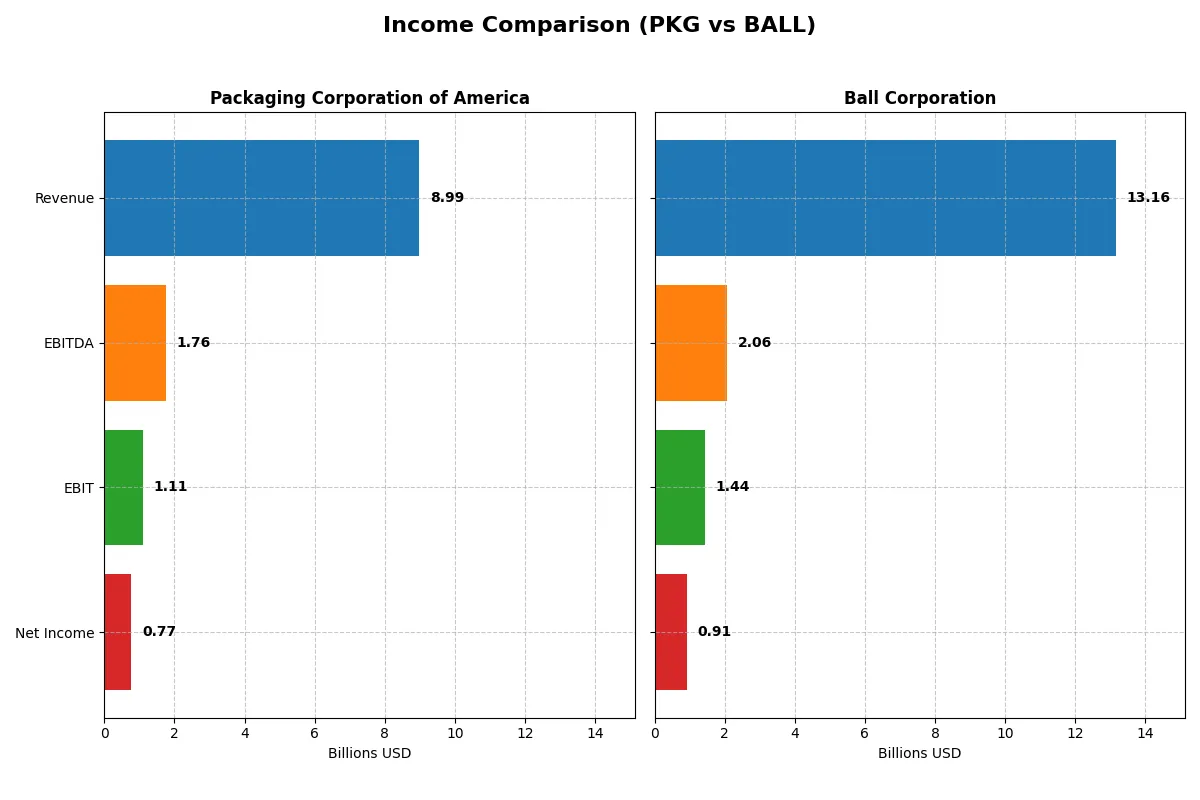
This data dissects the core profitability and scalability of both corporate engines to reveal who dominates the bottom line:
| Metric | Packaging Corporation of America (PKG) | Ball Corporation (BALL) |
|---|---|---|
| Revenue | 8.99B | 13.16B |
| Cost of Revenue | 7.10B | 11.21B |
| Operating Expenses | 634M | 566M |
| Gross Profit | 1.89B | 1.96B |
| EBITDA | 1.76B | 2.06B |
| EBIT | 1.11B | 1.44B |
| Interest Expense | 79M | 314M |
| Net Income | 769M | 912M |
| EPS | 8.61 | 3.33 |
| Fiscal Year | 2025 | 2025 |
Income Statement Analysis: The Bottom-Line Duel
This income statement comparison reveals the true efficiency and profitability of Packaging Corporation of America and Ball Corporation’s business engines.
Packaging Corporation of America Analysis
Packaging Corporation’s revenue grew steadily from 7.7B in 2021 to 8.9B in 2025, showing consistent top-line expansion. Gross margins remain healthy near 21%, supporting solid operating profits and an EBIT margin of 12.3% in 2025. Despite a 7.2% revenue increase last year, net income fell 10.9%, signaling margin pressure and some earnings momentum loss.
Ball Corporation Analysis
Ball Corporation posted higher revenues, peaking at 13.2B in 2025 after a dip in 2022. Gross margins hover lower at 14.9%, but EBIT margin improved to nearly 11%, reflecting operational gains. The firm’s revenue grew 11.6% last year, with EBIT surging 72%, though net margin and EPS suffered sharp declines, indicating volatility in bottom-line performance.
Margin Strength vs. Revenue Momentum
Packaging Corporation delivers superior margin stability and consistent profit generation, while Ball Corporation leverages higher revenue scale and recent EBIT acceleration. Packaging’s solid margins translate to steadier net income, despite a recent dip, making it a fundamentally sound performer. Ball’s profile suits investors favoring growth potential but exposed to earnings swings.
Financial Ratios Comparison
These vital ratios act as a diagnostic tool to expose the underlying fiscal health, valuation premiums, and capital efficiency of each company:
| Ratios | Packaging Corporation of America (PKG) | Ball Corporation (BALL) |
|---|---|---|
| ROE | 18.28% (2024) | 16.82% (2025) |
| ROIC | 10.53% (2024) | 7.83% (2025) |
| P/E | 24.92 (2024) | 15.93 (2025) |
| P/B | 4.55 (2024) | 2.68 (2025) |
| Current Ratio | 3.23 (2024) | 1.11 (2025) |
| Quick Ratio | 2.10 (2024) | 0.75 (2025) |
| D/E | 0.63 (2024) | 1.29 (2025) |
| Debt-to-Assets | 31.38% (2024) | 35.91% (2025) |
| Interest Coverage | 26.60 (2024) | 4.43 (2025) |
| Asset Turnover | 0.95 (2024) | 0.67 (2025) |
| Fixed Asset Turnover | 1.94 (2024) | 1.98 (2025) |
| Payout Ratio | 55.74% (2024) | 24.12% (2025) |
| Dividend Yield | 2.24% (2024) | 1.51% (2025) |
| Fiscal Year | 2024 | 2025 |
Efficiency & Valuation Duel: The Vital Signs
Financial ratios serve as a company’s DNA, uncovering hidden risks and revealing operational excellence beneath surface-level numbers.
Packaging Corporation of America
Packaging Corporation of America shows a mixed profile with neutral net margin at 8.55% but an unfavorable zero ROE and ROIC. The stock trades at a stretched P/E of 30.64, signaling expensive valuation. A 2.42% dividend yield offers steady shareholder returns, highlighting a preference for income over aggressive reinvestment.
Ball Corporation
Ball Corporation delivers a favorable 16.82% ROE and a neutral 7.83% ROIC, reflecting decent profitability. Its P/E of 15.93 suggests reasonable valuation compared to peers. The modest 1.51% dividend yield complements the company’s balanced approach, with reinvestment aimed at sustaining growth rather than maximizing immediate payouts.
Balanced Profitability vs. Valuation Discipline
Ball Corporation offers a better balance of profitability and valuation, avoiding stretched multiples seen in Packaging Corporation. Investors seeking operational efficiency and reasonable price may prefer Ball, while income-focused investors might consider Packaging’s higher dividend yield.
Which one offers the Superior Shareholder Reward?
I compare Packaging Corporation of America (PKG) and Ball Corporation (BALL) on shareholder distributions. PKG yields 2.4% with a 74% payout ratio and robust buybacks fueled by solid free cash flow. BALL yields 1.5%, pays a lower 24% dividend payout, but reinvests heavily in capex and growth. PKG’s higher, well-covered dividend and steady buybacks suggest a more sustainable, attractive total return in 2026. BALL’s riskier leverage and weaker cash flow coverage limit its shareholder reward potential. I favor PKG for superior long-term value creation.
Comparative Score Analysis: The Strategic Profile
The radar chart reveals the fundamental DNA and trade-offs of Packaging Corporation of America and Ball Corporation, highlighting their strategic financial profiles:
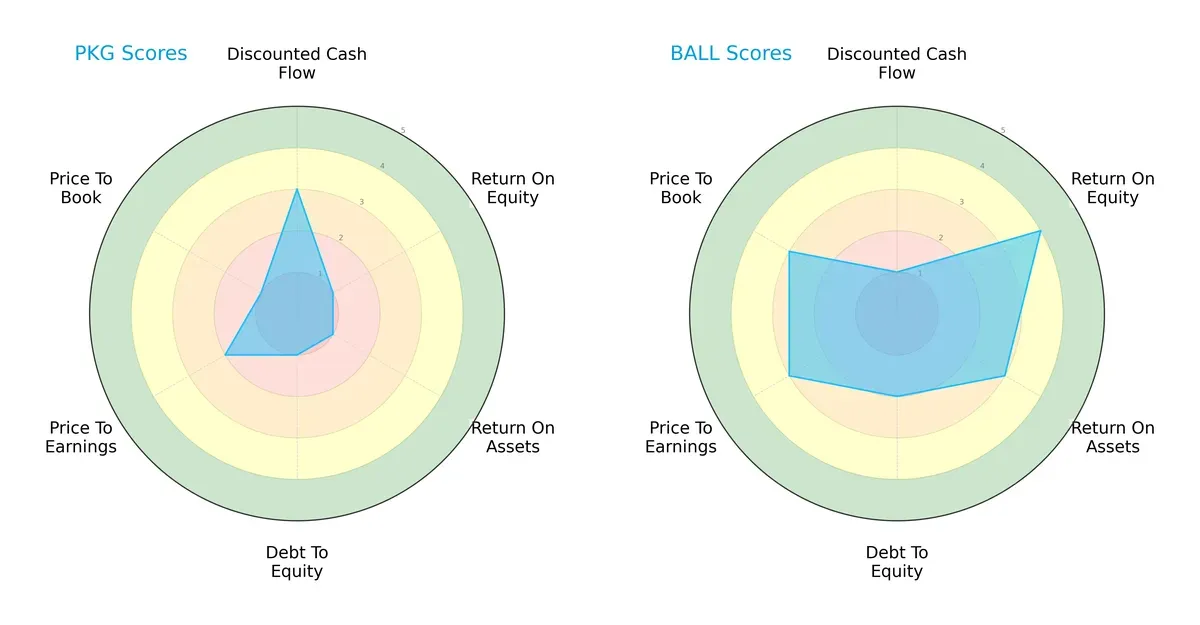
Packaging Corporation of America shows moderate strength in discounted cash flow but struggles with profitability and leverage, scoring very low on ROE, ROA, and debt-to-equity. Ball Corporation demonstrates a more balanced and favorable profile with higher ROE and ROA scores, moderate leverage, and better valuation metrics. Ball leans on operational efficiency and valuation balance, while Packaging relies mainly on cash flow projections but faces significant financial risks.
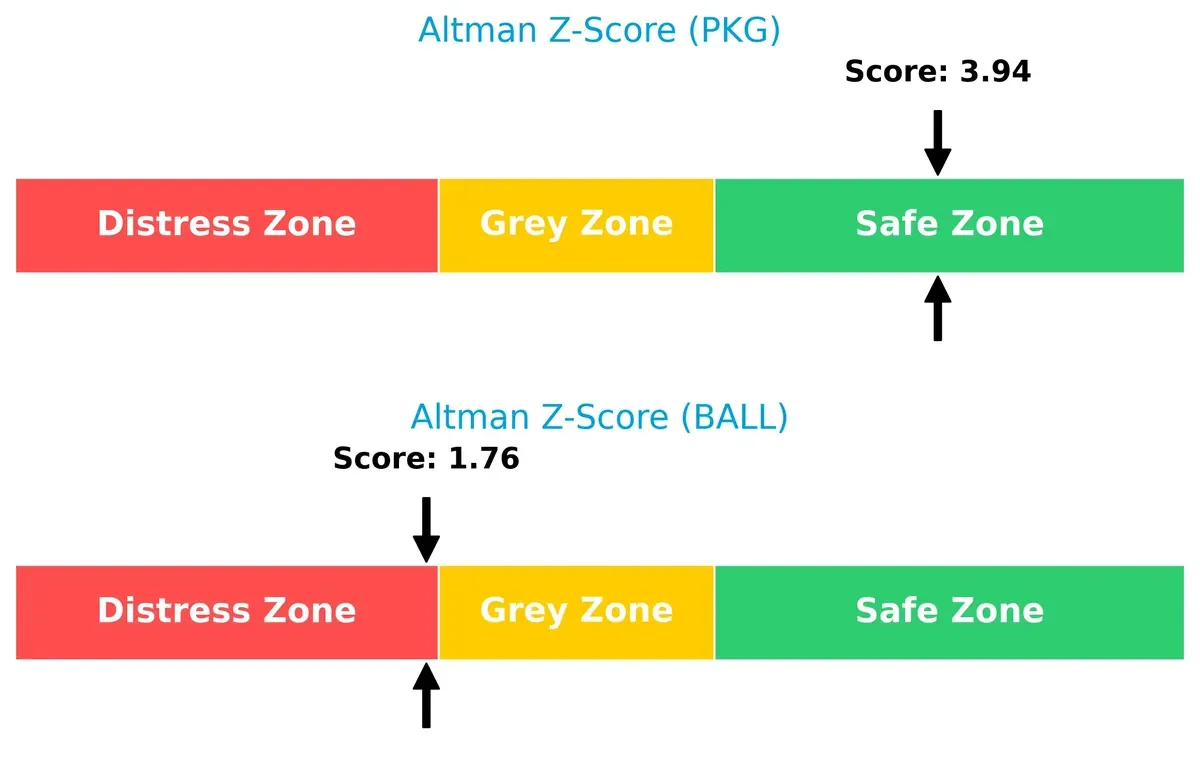
Bankruptcy Risk: Solvency Showdown
The Altman Z-Score delta highlights a stark solvency contrast: Packaging Corporation of America scores 3.94, firmly in the safe zone, signaling strong long-term survival prospects. Ball Corporation’s 1.76 places it in the distress zone, indicating elevated bankruptcy risk amid current market pressures:
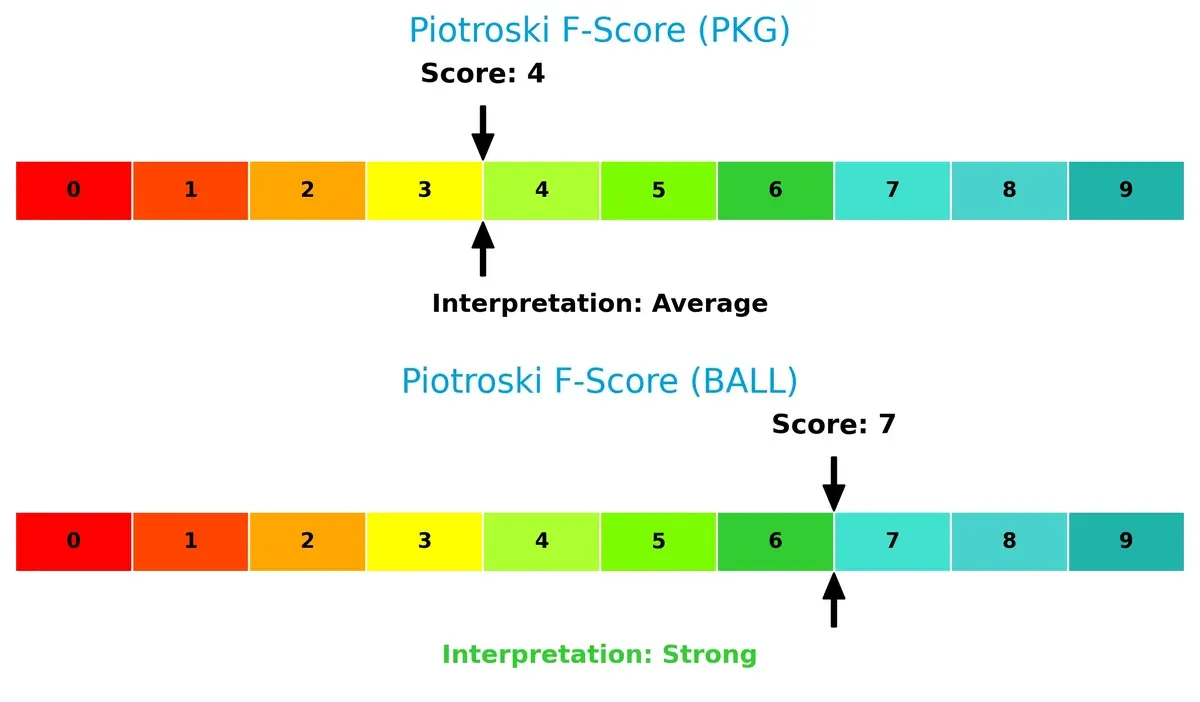
Financial Health: Quality of Operations
Ball Corporation outperforms with a Piotroski F-Score of 7, indicating strong operational quality and internal financial health. Packaging Corporation of America scores 4, signaling average health and potential red flags in efficiency and profitability metrics compared to Ball:
How are the two companies positioned?
This section dissects the operational DNA of PKG and BALL by comparing their revenue distribution by segment and internal dynamics. The goal is to confront their economic moats and identify which model offers the most resilient competitive advantage today.
Revenue Segmentation: The Strategic Mix
The following visual comparison dissects how Packaging Corporation of America and Ball Corporation diversify their income streams and where their primary sector bets lie:
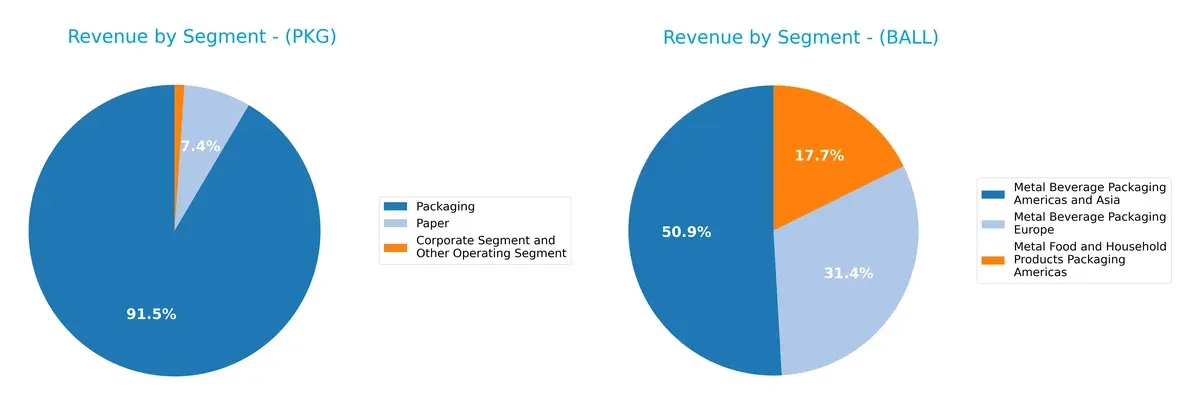
Packaging Corporation of America anchors its revenue heavily in Packaging with $7.69B, supplemented modestly by Paper at $625M, revealing a concentrated but slightly diversified model. Ball Corporation spreads revenue more evenly across three metal packaging segments, with $5.62B in Americas and Asia beverage packaging, $3.47B in Europe beverage packaging, and $1.95B in food and household packaging. Ball’s broader diversification reduces concentration risk and leverages global packaging ecosystems, unlike Packaging Corp’s reliance on a dominant packaging segment.
Strengths and Weaknesses Comparison
This table compares the strengths and weaknesses of Packaging Corporation of America and Ball Corporation:
Packaging Corporation of America Strengths
- Strong packaging segment revenue of 7.69B USD in 2024
- Favorable debt-to-assets and interest coverage ratios
- Dividend yield of 2.42% supports shareholder returns
Ball Corporation Strengths
- Diversified metal packaging product lines across regions
- Favorable ROE of 16.82% and WACC of 7.71%
- Balanced geographic revenue including 5.48B USD from the US in 2024
Packaging Corporation of America Weaknesses
- Unfavorable ROE and ROIC at 0%, indicating low profitability
- Poor liquidity ratios with current and quick ratios at 0
- High P/E at 30.64 signals possible overvaluation
- Asset turnover ratios unavailable or unfavorable
Ball Corporation Weaknesses
- Debt-to-equity ratio unfavorable at 1.29, indicating higher leverage
- Quick ratio below 1, suggesting liquidity challenges
- Neutral to unfavorable profitability with net margin at 6.93%
- Dividend yield lower at 1.51%
Packaging Corporation of America shows strong balance sheet metrics and dividend yield but suffers from weak profitability and liquidity. Ball Corporation presents solid profitability and diversification but carries higher leverage and liquidity risks. Each company’s financial profile reflects distinct strategic trade-offs.
The Moat Duel: Analyzing Competitive Defensibility
A strong structural moat is the sole barrier protecting long-term profits from relentless competition and margin erosion:
Packaging Corporation of America: Intangible Assets and Operational Efficiency
Packaging Corporation leans on intangible assets and operational scale, reflected in stable gross margins near 21%. However, declining ROIC signals rising competitive pressure in 2026.
Ball Corporation: Cost Advantage and Geographic Diversification
Ball’s moat stems from cost advantage and global diversification, driving a slightly favorable ROIC trend and strong EBIT growth. Expansion into aerospace technology deepens its competitive edge.
Operational Scale vs. Cost Leadership: Who Holds the Moat Edge?
Ball Corporation shows a deeper moat with improving ROIC and diversified revenue streams. Packaging Corp’s operational scale faces margin pressure, making Ball better positioned to defend market share in 2026.
Which stock offers better returns?
Both Packaging Corporation of America and Ball Corporation exhibit bullish price trends over the past year, with accelerating momentum and distinct trading volume dynamics.
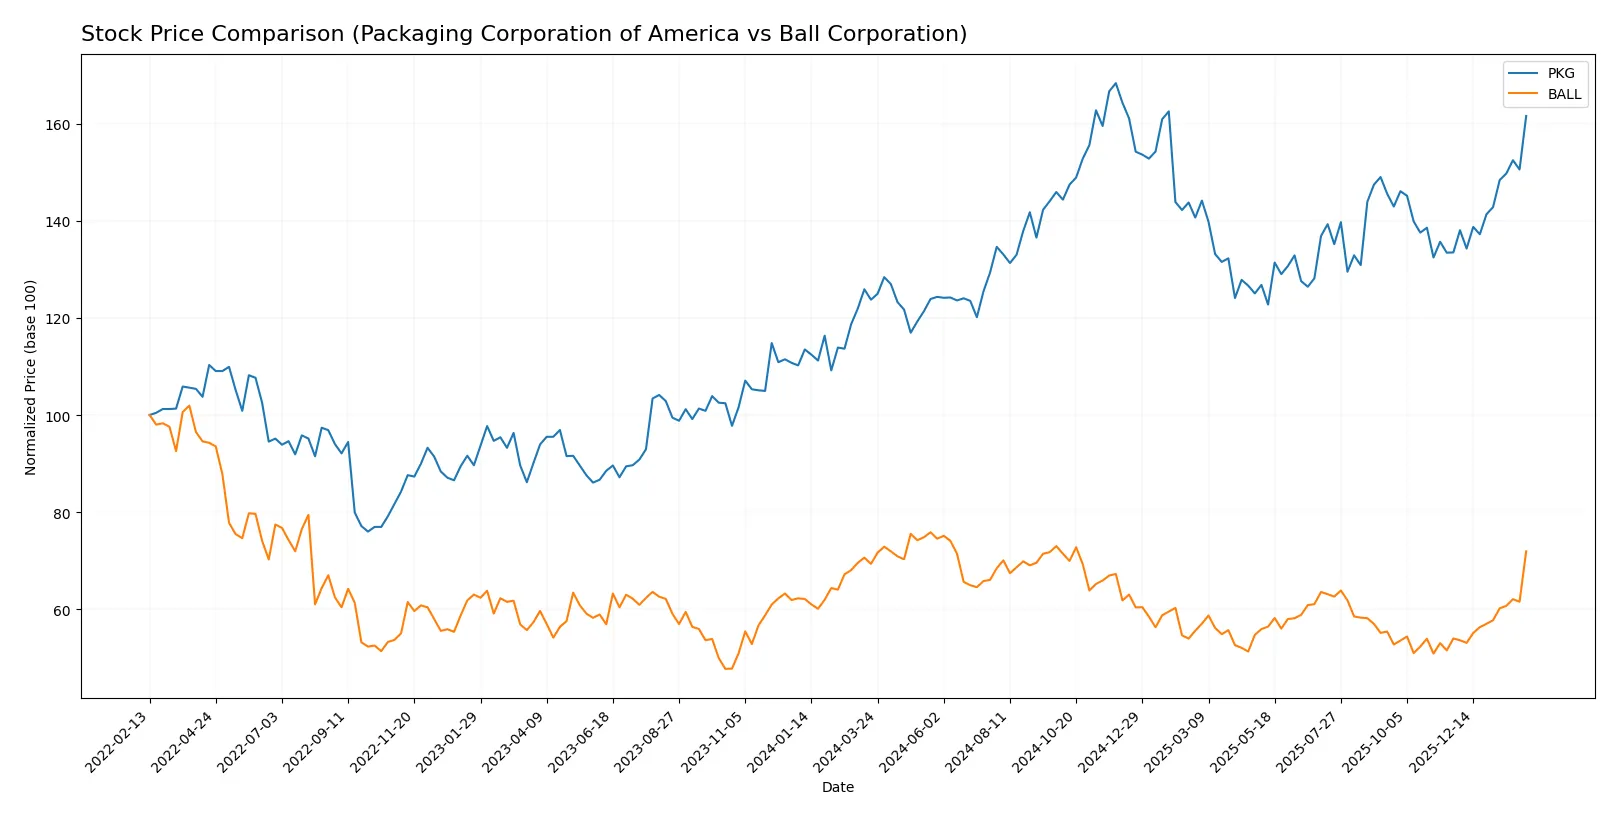
Trend Comparison
Packaging Corporation of America’s stock rose 30.59% over the last 12 months, showing acceleration and a high volatility level (18.04 std deviation). It peaked at 248.85 and bottomed at 172.85.
Ball Corporation’s stock increased 3.73% over the same period, also accelerating but with lower volatility (6.67 std deviation). The price ranged between 47.0 and 70.11 during the year.
Packaging Corporation of America has delivered a higher market return with stronger acceleration and greater price appreciation than Ball Corporation.
Target Prices
Analysts present a moderate upside for both Packaging Corporation of America and Ball Corporation based on current consensus targets.
| Company | Target Low | Target High | Consensus |
|---|---|---|---|
| Packaging Corporation of America | 233 | 270 | 246 |
| Ball Corporation | 66 | 75 | 69.86 |
Packaging Corporation of America’s consensus target of 246 slightly exceeds its current price of 239, suggesting modest growth potential. Ball Corporation’s consensus target of 69.86 also indicates a small upside from its current 66.47 level.

Don’t Let Luck Decide Your Entry Point
Optimize your entry points with our advanced ProRealTime indicators. You’ll get efficient buy signals with precise price targets for maximum performance. Start outperforming now!
How do institutions grade them?
Packaging Corporation of America Grades
The following table summarizes recent grades from major institutions for Packaging Corporation of America.
| Grading Company | Action | New Grade | Date |
|---|---|---|---|
| Wells Fargo | maintain | Overweight | 2026-01-29 |
| Citigroup | maintain | Neutral | 2026-01-29 |
| Truist Securities | maintain | Buy | 2026-01-29 |
| UBS | maintain | Neutral | 2026-01-12 |
| Truist Securities | maintain | Buy | 2026-01-06 |
| Citigroup | maintain | Neutral | 2026-01-06 |
| Wells Fargo | upgrade | Overweight | 2026-01-06 |
| JP Morgan | maintain | Overweight | 2025-12-05 |
| UBS | maintain | Neutral | 2025-10-24 |
| UBS | maintain | Neutral | 2025-10-16 |
Ball Corporation Grades
Below is a summary of the latest institutional grades for Ball Corporation.
| Grading Company | Action | New Grade | Date |
|---|---|---|---|
| Citigroup | maintain | Buy | 2026-02-05 |
| JP Morgan | maintain | Neutral | 2026-02-04 |
| Wells Fargo | maintain | Overweight | 2026-02-04 |
| Mizuho | maintain | Outperform | 2026-02-04 |
| Truist Securities | maintain | Buy | 2026-02-04 |
| Jefferies | maintain | Buy | 2026-02-04 |
| UBS | maintain | Neutral | 2026-01-12 |
| Truist Securities | maintain | Buy | 2026-01-06 |
| Citigroup | upgrade | Buy | 2026-01-06 |
| Wells Fargo | upgrade | Overweight | 2026-01-06 |
Which company has the best grades?
Ball Corporation generally receives stronger grades, including multiple Buy and Outperform ratings. Packaging Corporation of America’s grades cluster around Neutral and Overweight. Investors may view Ball’s higher ratings as a signal of greater institutional confidence.
Risks specific to each company
The following categories identify the critical pressure points and systemic threats facing both firms in the 2026 market environment:
1. Market & Competition
Packaging Corporation of America
- Faces pressure from fluctuating demand in containerboard and corrugated packaging amid evolving retail trends.
Ball Corporation
- Confronts intense global competition in aluminum packaging and aerospace tech, requiring continual innovation.
2. Capital Structure & Debt
Packaging Corporation of America
- Exhibits favorable debt metrics with low leverage and strong interest coverage, enhancing financial stability.
Ball Corporation
- Displays higher debt-to-equity ratio (1.29), indicating elevated financial risk and tighter interest coverage.
3. Stock Volatility
Packaging Corporation of America
- Beta of 0.898 suggests lower volatility, providing relative stability in turbulent markets.
Ball Corporation
- Beta of 1.138 signals higher volatility, exposing investors to greater market swings.
4. Regulatory & Legal
Packaging Corporation of America
- Subject to US packaging regulations with moderate compliance risks.
Ball Corporation
- Faces complex regulatory challenges across multiple geographies and aerospace defense sectors.
5. Supply Chain & Operations
Packaging Corporation of America
- Supply chain risks include raw material costs and logistics for containerboard products.
Ball Corporation
- Complex global supply chain for aluminum and aerospace components increases operational vulnerabilities.
6. ESG & Climate Transition
Packaging Corporation of America
- Pressure to adopt sustainable packaging solutions to meet consumer and regulatory demands.
Ball Corporation
- Greater ESG scrutiny due to aerospace emissions and aluminum recycling challenges.
7. Geopolitical Exposure
Packaging Corporation of America
- Primarily US-focused, with limited direct geopolitical risk.
Ball Corporation
- Significant international exposure, especially in Europe, Latin America, and aerospace defense markets.
Which company shows a better risk-adjusted profile?
Packaging Corporation of America faces its greatest risk in competitive market pressures and operational inefficiencies, despite a strong balance sheet. Ball Corporation’s largest risk lies in elevated leverage and geopolitical exposure. Overall, Packaging Corporation of America presents a better risk-adjusted profile, supported by its safer Altman Z-Score (3.94 vs. 1.76). Ball’s stronger Piotroski Score (7 vs. 4) suggests operational strength but does not offset financial vulnerabilities.
Final Verdict: Which stock to choose?
Packaging Corporation of America (PKG) excels as a cash-generating powerhouse in its sector, demonstrating resilience through steady revenue growth and strong operating margins. Its main point of vigilance lies in its declining return on invested capital, signaling potential challenges in capital efficiency. PKG suits investors with an appetite for aggressive growth seeking operational strength.
Ball Corporation (BALL) benefits from a strategic moat driven by improving profitability and a consistent rise in return on invested capital, reflecting better capital allocation over time. Compared to PKG, BALL presents a more balanced risk profile with moderate leverage and solid earnings growth. It fits well within GARP portfolios prioritizing steady growth at reasonable valuations.
If you prioritize operational cash flow strength and aggressive expansion, PKG is the compelling choice due to its robust margin profile and market momentum. However, if you seek better capital efficiency and a more stable risk-return balance, BALL offers superior sustainability and improving profitability metrics. Both appeal to distinct investor profiles, calling for cautious alignment with individual strategy and risk tolerance.
Disclaimer: Investment carries a risk of loss of initial capital. The past performance is not a reliable indicator of future results. Be sure to understand risks before making an investment decision.
Go Further
I encourage you to read the complete analyses of Packaging Corporation of America and Ball Corporation to enhance your investment decisions: