Home > Comparison > Energy > BKR vs FTI
The strategic rivalry between Baker Hughes Company and TechnipFMC plc defines the current trajectory of the Energy sector. Baker Hughes operates as a diversified oilfield services and equipment provider with a broad technological portfolio. TechnipFMC focuses on subsea and surface technologies with a leaner operational model. This analysis pits Baker Hughes’ scale against TechnipFMC’s specialization to reveal which path delivers superior risk-adjusted returns for a balanced portfolio.
Table of contents
Companies Overview
Baker Hughes and TechnipFMC stand as pivotal players in the global oil and gas equipment and services market.
Baker Hughes Company: Integrated Energy Technology Leader
Baker Hughes commands a diverse portfolio spanning Oilfield Services, Equipment, Turbomachinery, and Digital Solutions. Its revenue derives from exploration, drilling, subsea equipment, and digital monitoring services worldwide. In 2026, the company focuses on integrating advanced digital technology with traditional oilfield services to enhance operational efficiency and lifecycle management.
TechnipFMC plc: Subsea and Surface Systems Specialist
TechnipFMC excels in subsea systems and surface technologies, generating revenue through design, manufacturing, and life-of-field services for oil and gas infrastructure. Its 2026 strategy emphasizes expanding digital-enabled pressure control systems and advancing Carbon Capture and Storage solutions via strategic alliances, reflecting a strong push into sustainable energy technology.
Strategic Collision: Similarities & Divergences
Both firms operate in oilfield equipment and services but diverge sharply in scope and approach. Baker Hughes targets an integrated service model combining traditional equipment with digital solutions. TechnipFMC pursues a specialized focus on subsea and surface systems with a sustainability lens. Their primary battleground is subsea technology innovation, shaping distinct risk and growth profiles for investors seeking exposure to evolving energy infrastructure.
Income Statement Comparison
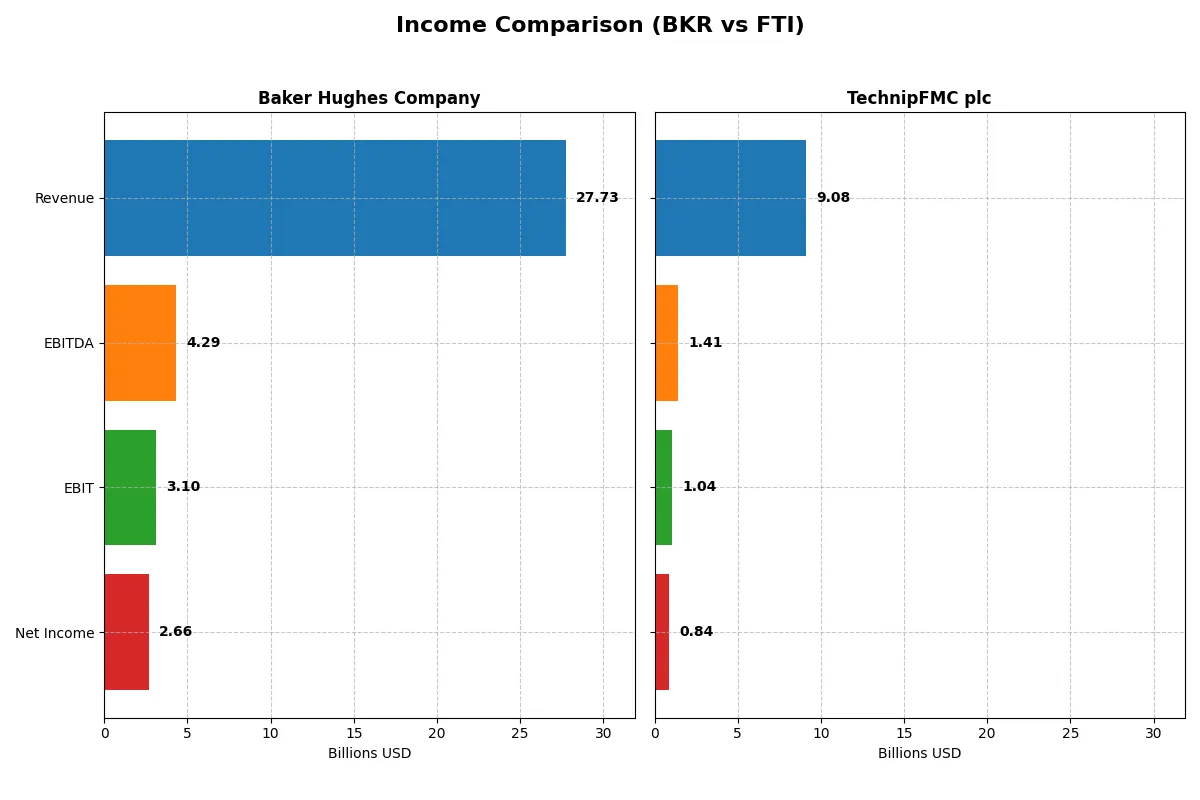
This detailed breakdown dissects the core profitability and scalability of both corporate engines to reveal who dominates the bottom line:
| Metric | Baker Hughes Company (BKR) | TechnipFMC plc (FTI) |
|---|---|---|
| Revenue | 27.7B | 9.1B |
| Cost of Revenue | 21.2B | 7.4B |
| Operating Expenses | 3.2B | 0.7B |
| Gross Profit | 6.5B | 1.7B |
| EBITDA | 4.3B | 1.4B |
| EBIT | 3.1B | 1.0B |
| Interest Expense | 222M | 97M |
| Net Income | 2.7B | 843M |
| EPS | 2.62 | 1.96 |
| Fiscal Year | 2025 | 2024 |
Income Statement Analysis: The Bottom-Line Duel
This income statement comparison reveals the true efficiency and profitability of Baker Hughes Company and TechnipFMC plc’s business models over recent years.
Baker Hughes Company Analysis
Baker Hughes grew revenue by 35% from 2021 to 2025, with net income surging over 1300%, reflecting a strong operational turnaround. The 2025 gross margin stands robust at 23.6%, while net margin holds a favorable 9.6%. Despite a slight 0.3% revenue dip in 2025, Baker Hughes maintains solid profitability and margin discipline, although EBIT and net margin declined modestly last year.
TechnipFMC plc Analysis
TechnipFMC posted a healthy 39% revenue growth from 2020 to 2024, paired with a net income increase of 126%. Its 2024 gross margin is slightly lower at 18.8%, but EBIT margin improves to 11.4%, indicating efficient cost management. The company accelerated earnings sharply in 2024, with net margin growth exceeding 3000%, showing strong recent momentum and operational leverage.
Verdict: Margin Power vs. Revenue Scale
Baker Hughes commands larger scale and superior gross margins, reflecting entrenched operational strength. TechnipFMC excels in recent margin expansion and earnings acceleration, showcasing nimble profitability growth. Baker Hughes’s size and margin consistency offer stability, while TechnipFMC’s rapid margin gains appeal to investors seeking high momentum in profitability.
Financial Ratios Comparison
These vital ratios act as a diagnostic tool to expose the underlying fiscal health, valuation premiums, and capital efficiency of the companies compared below:
| Ratios | Baker Hughes Company (BKR) | TechnipFMC plc (FTI) |
|---|---|---|
| ROE | 12.31% | 27.24% |
| ROIC | 11.01% | 16.09% |
| P/E | 16.91 | 14.73 |
| P/B | 2.08 | 4.01 |
| Current Ratio | 1.36 | 1.12 |
| Quick Ratio | 1.00 | 0.88 |
| D/E | 0.28 | 0.58 |
| Debt-to-Assets | 14.89% | 18.15% |
| Interest Coverage | 15.05 | 9.94 |
| Asset Turnover | 0.68 | 0.92 |
| Fixed Asset Turnover | 5.21 | 3.07 |
| Payout Ratio | 34.21% | 10.19% |
| Dividend Yield | 2.02% | 0.69% |
| Fiscal Year | 2025 | 2024 |
Efficiency & Valuation Duel: The Vital Signs
Financial ratios act as a company’s DNA, uncovering hidden risks and operational strengths that shape investment decisions.
Baker Hughes Company
Baker Hughes shows a neutral 12.3% ROE with a solid 9.6% net margin, reflecting steady profitability. Its P/E of 16.9 signals a fair valuation, neither expensive nor cheap. The company returns value via a 2.02% dividend yield, balancing shareholder payouts with 2.16% revenue reinvestment in R&D for growth.
TechnipFMC plc
TechnipFMC delivers a strong 27.2% ROE and a 9.3% net margin, indicating high efficiency. Its P/E of 14.7 suggests a modest valuation, though a 4.01 PB ratio flags potential overvaluation. Dividend yield is low at 0.69%, hinting at reinvestment focus, with 0.81% revenue spent on R&D to fuel future growth.
Valuation Balance: Steady Returns vs. Growth Efficiency
Both companies present slightly favorable ratios but differ in risk profiles. Baker Hughes offers a balanced mix of dividends and growth investment, while TechnipFMC leans on superior profitability and reinvestment, despite a stretched book value. Investors seeking income may prefer Baker Hughes; growth-oriented profiles might favor TechnipFMC.
Which one offers the Superior Shareholder Reward?
Baker Hughes (BKR) delivers a stronger shareholder reward than TechnipFMC (FTI) in 2026. BKR yields ~2.0% with a prudent 34% payout ratio, fully covered by free cash flow (3.9/share). It pairs solid dividends with aggressive buybacks, supporting sustainable long-term returns. FTI’s yield lags at 0.7%, with a low 10% payout and modest buybacks, favoring reinvestment in growth over distributions. I see BKR’s balanced distribution approach as more reliable for total shareholder return in this sector’s current cycle.
Comparative Score Analysis: The Strategic Profile
The radar chart reveals the fundamental DNA and trade-offs of Baker Hughes Company and TechnipFMC plc, highlighting their core financial strengths and weaknesses:
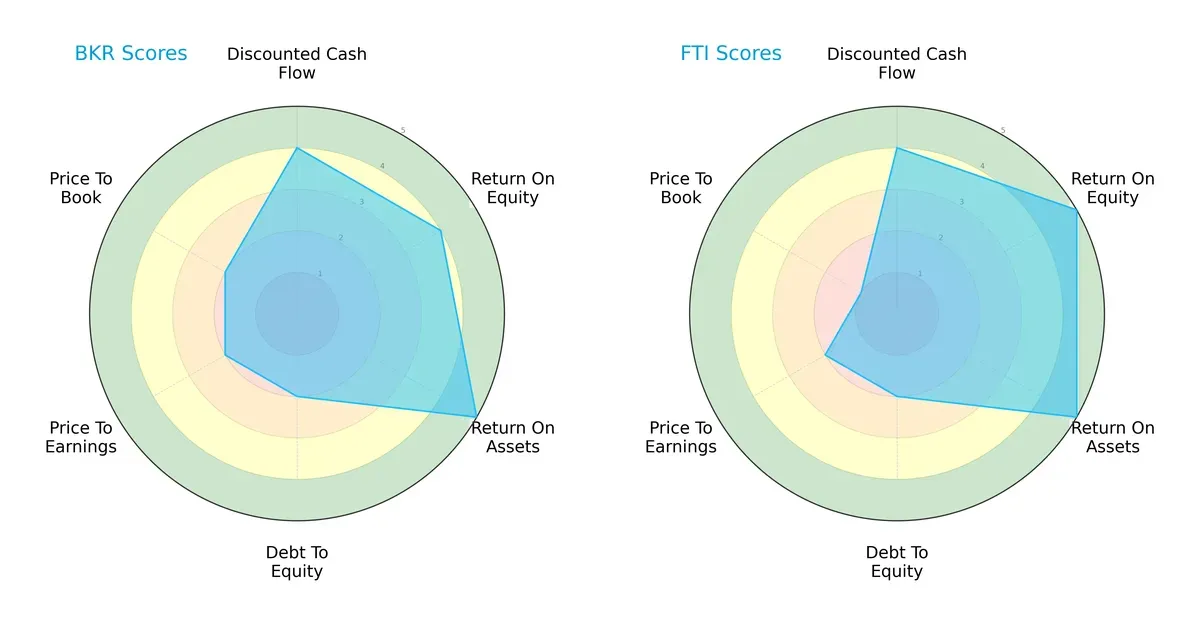
Baker Hughes and TechnipFMC share a balanced overall score of 3, reflecting moderate financial health. Both score equally on discounted cash flow (4) and moderate debt-to-equity (2), indicating similar valuation discipline and leverage management. TechnipFMC edges out with a higher return on equity (5 vs. 4) and matches Baker Hughes’ top-tier return on assets (5), signaling slightly better operational efficiency. However, Baker Hughes shows a more balanced valuation profile with moderate P/E and P/B scores (both 2), while TechnipFMC’s very unfavorable P/B score (1) points to potential market perception risks or overvaluation in book value terms.
—
Bankruptcy Risk: Solvency Showdown
The Altman Z-Scores place both firms in the grey zone, suggesting moderate bankruptcy risk in the current cycle:
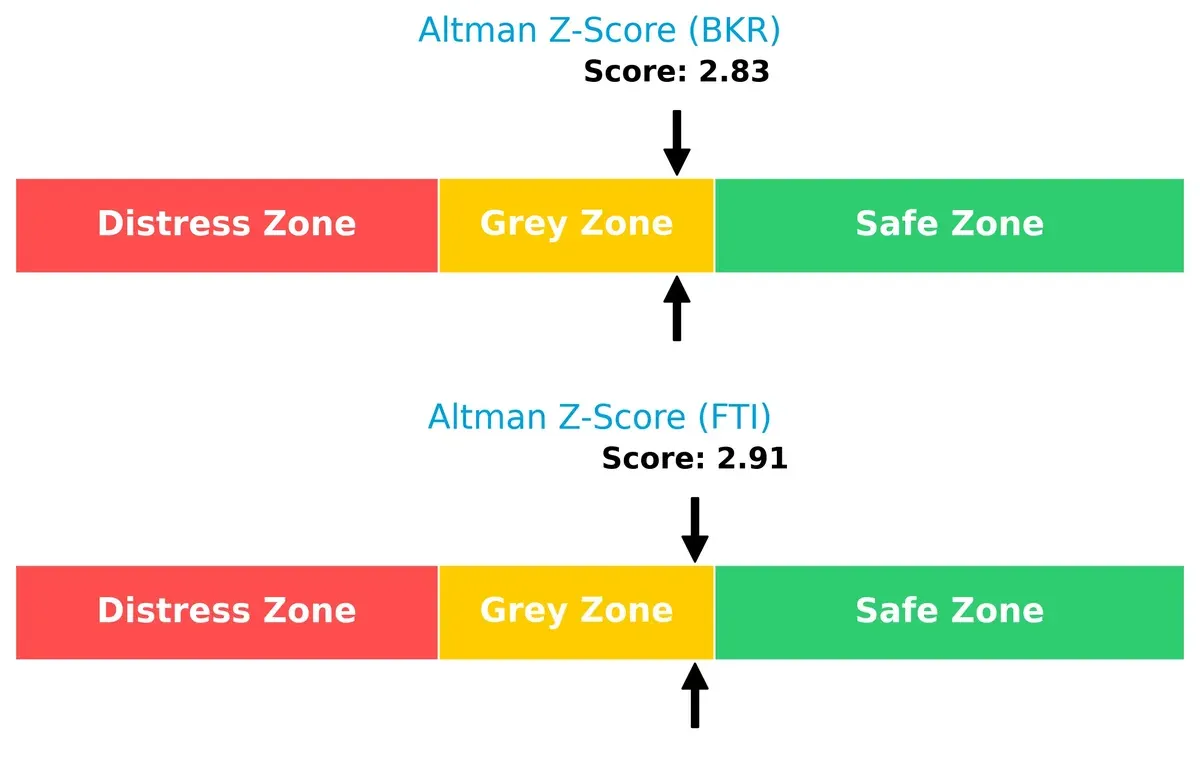
Baker Hughes posts a 2.83 Z-Score, slightly below TechnipFMC’s 2.91, reflecting a marginally higher financial distress risk. Historically in capital-intensive industries like oilfield services, hovering near the grey zone signals caution but not immediate danger. Both companies must navigate operational and macroeconomic headwinds prudently to maintain solvency.
—
Financial Health: Quality of Operations
Both firms demonstrate very strong financial health with identical Piotroski F-Scores of 8, underscoring robust internal financial metrics and operational efficiency:
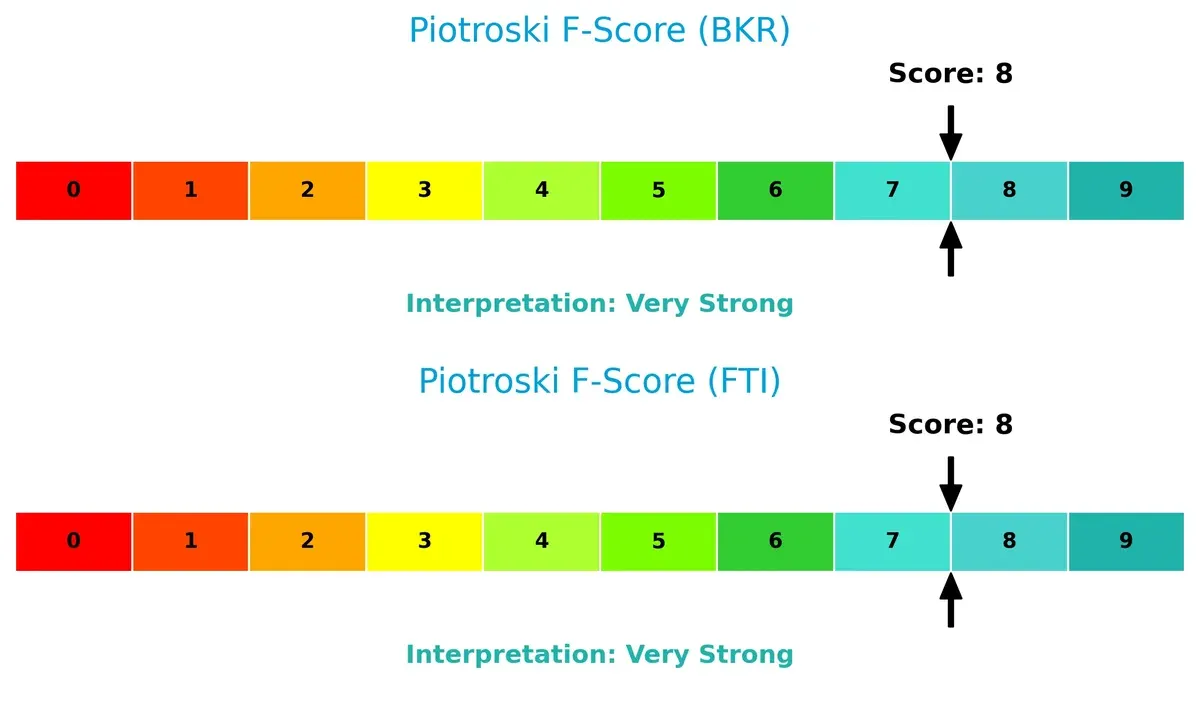
An 8 out of 9 score indicates excellent profitability, liquidity, and leverage management for both Baker Hughes and TechnipFMC. I see no red flags in their internal fundamentals. This strength supports confidence in their resilience through market cycles and their ability to sustain value creation.
How are the two companies positioned?
This section dissects the operational DNA of Baker Hughes Company (BKR) and TechnipFMC plc (FTI) by comparing their revenue distribution and internal strengths and weaknesses. The goal is to confront their economic moats to reveal which business model offers the most resilient and sustainable competitive advantage today.
Revenue Segmentation: The Strategic Mix
This visual comparison dissects how Baker Hughes Company and TechnipFMC plc diversify their income streams and reveals where their primary sector bets lie:
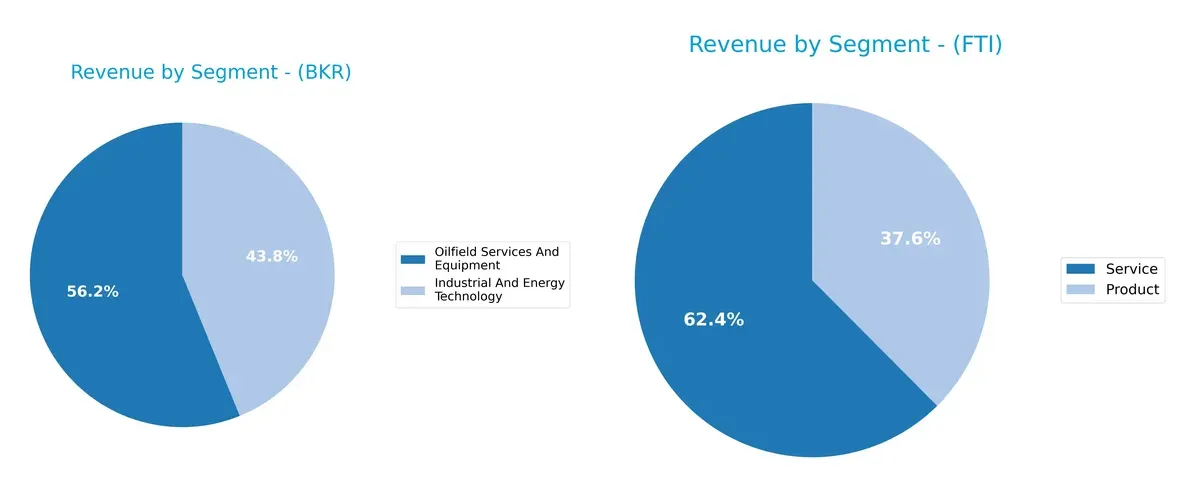
Baker Hughes anchors revenue in “Oilfield Services And Equipment” with $15.6B in 2024, complemented by a sizable $12.2B from “Industrial And Energy Technology.” This mix shows moderate diversification with a clear reliance on oilfield services. TechnipFMC pivots between “Service” at $5.5B and “Product” at $3.3B, reflecting a balanced but narrower scope. Baker Hughes’ scale supports infrastructure dominance, while TechnipFMC’s split signals exposure to product-service cycle risks.
Strengths and Weaknesses Comparison
This table compares the strengths and weaknesses of Baker Hughes Company and TechnipFMC plc:
BKR Strengths
- Diverse revenue streams across Industrial Technology and Oilfield Services
- Strong global presence with 20B Non-US revenue in 2024
- Favorable ROIC vs. WACC indicates efficient capital allocation
- Solid interest coverage ratio supports debt management
FTI Strengths
- High profitability with 27.24% ROE and 16.09% ROIC
- Favorable WACC and strong net margin support competitive edge
- Diversified product and service offerings including Subsea and Surface Technologies
- Global footprint with significant revenues across multiple countries
BKR Weaknesses
- Neutral net margin and ROE suggest moderate profitability
- Lower asset turnover compared to FTI may limit operational efficiency
- Neutral liquidity ratios require monitoring for short-term obligations
- Dividend yield higher but may pressure cash flow
FTI Weaknesses
- Higher debt-to-equity ratio and unfavorable PB ratio signal leverage concerns
- Lower quick ratio indicates potential liquidity risk
- Dividend yield under 1% may deter income-focused investors
- Less favorable current ratio compared to BKR
Baker Hughes shows a balanced financial profile with strong capital efficiency and global diversification. TechnipFMC excels in profitability but carries higher leverage and liquidity risks. These contrasts shape each company’s strategic priorities in capital management and growth.
The Moat Duel: Analyzing Competitive Defensibility
A structural moat alone defends long-term profits from relentless competition erosion and market pressures. Let’s dissect the moats of Baker Hughes and TechnipFMC:
Baker Hughes Company: Diversified Technological Moat
Baker Hughes leverages intangible assets and broad service integration across upstream to digital solutions. Its ROIC exceeds WACC by 3.6%, reflecting efficient capital use and margin stability. Expansion into digital and turbomachinery boosts moat resilience in 2026 but faces pressure from sector cyclicality.
TechnipFMC plc: Specialized Subsea Engineering Moat
TechnipFMC’s moat centers on specialized subsea infrastructure and engineering expertise, delivering a ROIC premium of 9.5% over WACC, surpassing Baker Hughes. Its focused innovation in subsea and surface technologies powers rapid margin and EPS growth, positioning it well for global offshore expansion and carbon capture projects.
Verdict: Integrated Services vs. Subsea Focused Engineering
TechnipFMC holds a deeper moat, demonstrated by a higher ROIC premium and sharper growth trajectory. Baker Hughes’ diversified portfolio offers stability but less concentrated competitive advantage. TechnipFMC appears better equipped to defend and expand its niche market share through specialized innovation.
Which stock offers better returns?
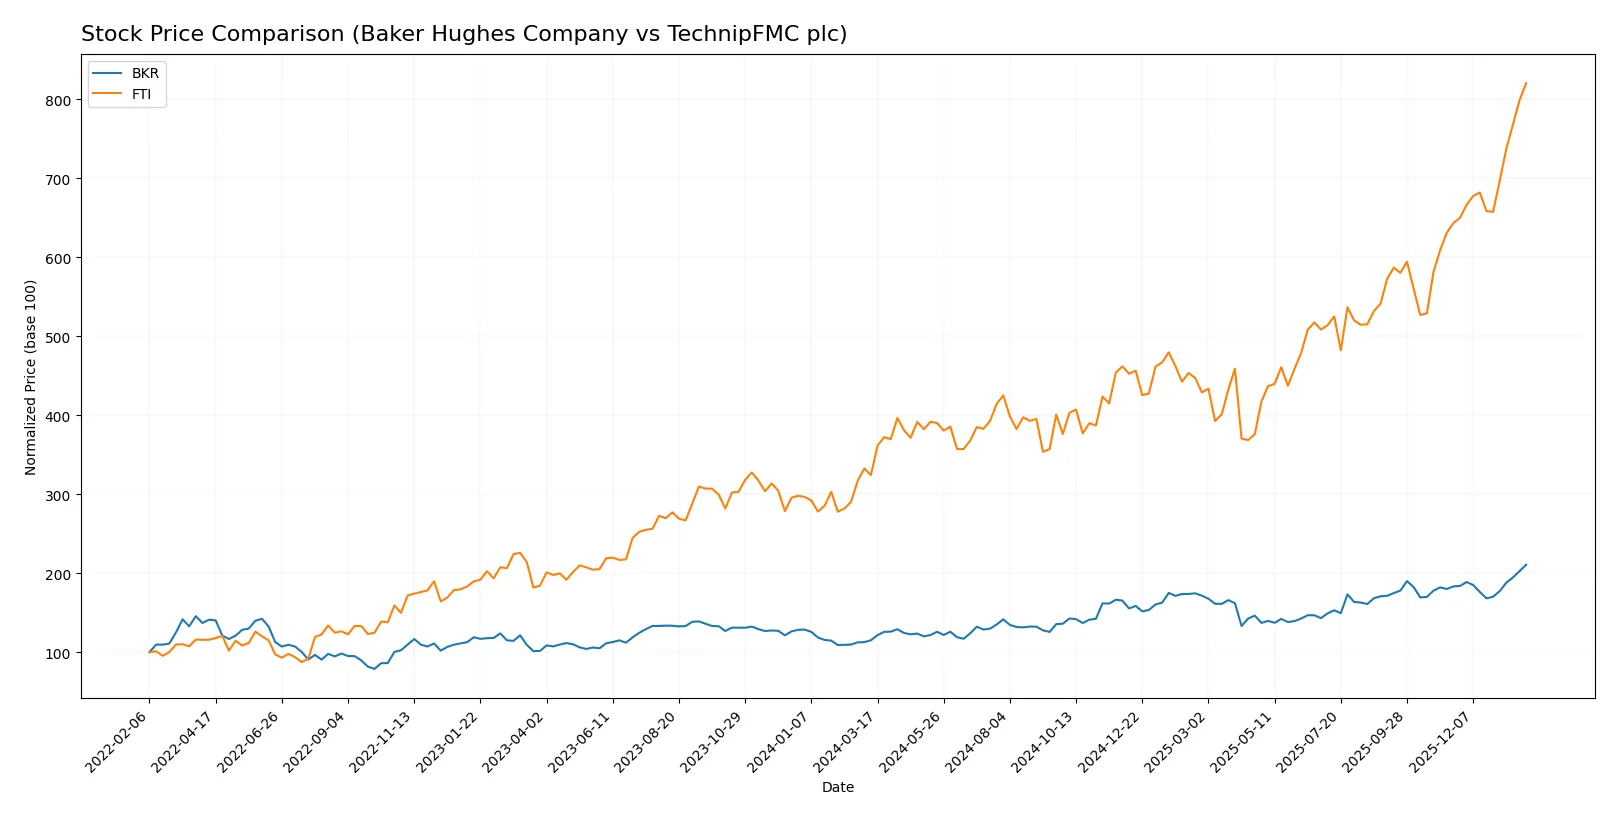
The past year saw strong bullish momentum for both Baker Hughes Company and TechnipFMC plc, with accelerating upward trends and significant price gains.
Trend Comparison
Baker Hughes Company’s stock rose 83.14% over the past 12 months, showing a clear bullish trend with accelerating gains. The price ranged between 30.6 and 56.04, supported by a moderate volatility of 5.94.
TechnipFMC plc outperformed with a 153.04% increase, also exhibiting acceleration and higher volatility at 7.43. Its price moved from a low of 22.02 to a high of 55.72, reflecting stronger momentum.
TechnipFMC’s stock delivered the highest market performance, surpassing Baker Hughes by nearly 70 percentage points in annual gains. Both show acceleration, but FTI leads in returns.
Target Prices
Analysts present a cautiously optimistic target consensus for Baker Hughes Company and TechnipFMC plc.
| Company | Target Low | Target High | Consensus |
|---|---|---|---|
| Baker Hughes Company | 52 | 67 | 58.9 |
| TechnipFMC plc | 47 | 56 | 49.83 |
Baker Hughes trades slightly below its 58.9 consensus target, implying moderate upside potential. TechnipFMC’s consensus target sits just below its current price, signaling limited near-term gains.

Don’t Let Luck Decide Your Entry Point
Optimize your entry points with our advanced ProRealTime indicators. You’ll get efficient buy signals with precise price targets for maximum performance. Start outperforming now!
How do institutions grade them?
This section compares the latest institutional grades for Baker Hughes Company and TechnipFMC plc:
Baker Hughes Company Grades
The following table lists recent grades assigned to Baker Hughes Company by major firms.
| Grading Company | Action | New Grade | Date |
|---|---|---|---|
| Citigroup | Maintain | Buy | 2026-01-28 |
| UBS | Maintain | Neutral | 2026-01-28 |
| BMO Capital | Maintain | Outperform | 2026-01-27 |
| JP Morgan | Maintain | Overweight | 2026-01-27 |
| Susquehanna | Maintain | Positive | 2026-01-27 |
| Barclays | Maintain | Overweight | 2026-01-27 |
| Stifel | Maintain | Buy | 2026-01-27 |
| Stifel | Maintain | Buy | 2026-01-21 |
| Susquehanna | Maintain | Positive | 2026-01-07 |
| TD Cowen | Maintain | Buy | 2026-01-07 |
TechnipFMC plc Grades
Below are recent institutional grades issued for TechnipFMC plc by recognized firms.
| Grading Company | Action | New Grade | Date |
|---|---|---|---|
| TD Cowen | Maintain | Buy | 2026-01-07 |
| Susquehanna | Maintain | Positive | 2026-01-07 |
| Piper Sandler | Maintain | Overweight | 2025-12-18 |
| Jefferies | Maintain | Buy | 2025-11-03 |
| Citigroup | Maintain | Buy | 2025-10-29 |
| RBC Capital | Maintain | Outperform | 2025-10-28 |
| Barclays | Maintain | Overweight | 2025-10-27 |
| Piper Sandler | Maintain | Overweight | 2025-10-24 |
| JP Morgan | Maintain | Overweight | 2025-10-02 |
| Barclays | Maintain | Overweight | 2025-07-25 |
Which company has the best grades?
Baker Hughes holds a broad consensus of Buy and Outperform ratings from top firms, reflecting strong institutional confidence. TechnipFMC also garners mostly Buy and Overweight grades, but with slightly older dates. Baker Hughes’s fresher and consistent positive grades may offer investors more current affirmation.
Risks specific to each company
The following categories identify the critical pressure points and systemic threats facing both firms in the 2026 market environment:
1. Market & Competition
Baker Hughes Company (BKR)
- Larger market cap (55.3B) supports scale and innovation leadership.
TechnipFMC plc (FTI)
- Smaller market cap (22.9B) limits competitive reach but allows niche focus.
2. Capital Structure & Debt
Baker Hughes Company (BKR)
- Low debt-to-equity (0.28) implies strong balance sheet and financial flexibility.
TechnipFMC plc (FTI)
- Higher debt-to-equity (0.58) raises leverage risk despite manageable interest coverage.
3. Stock Volatility
Baker Hughes Company (BKR)
- Beta 0.89 shows moderate market sensitivity, slightly closer to market risk.
TechnipFMC plc (FTI)
- Lower beta 0.66 indicates less price volatility and more defensive behavior.
4. Regulatory & Legal
Baker Hughes Company (BKR)
- US-based, exposed to intense environmental and energy regulations.
TechnipFMC plc (FTI)
- UK-based with broad geographic exposure, facing complex multi-jurisdictional regulations.
5. Supply Chain & Operations
Baker Hughes Company (BKR)
- Diversified segments reduce supply chain concentration risk.
TechnipFMC plc (FTI)
- Heavy subsea and surface tech reliance may increase operational complexity.
6. ESG & Climate Transition
Baker Hughes Company (BKR)
- Active in digital solutions and industrial tech for cleaner energy transition.
TechnipFMC plc (FTI)
- Strategic alliances in carbon capture suggest strong ESG positioning but execution risk.
7. Geopolitical Exposure
Baker Hughes Company (BKR)
- Primarily US-based but global operations expose to trade and political risks.
TechnipFMC plc (FTI)
- Diverse international footprint increases geopolitical uncertainty but spreads risk.
Which company shows a better risk-adjusted profile?
Baker Hughes faces its biggest risk in regulatory compliance amid US energy policy shifts. TechnipFMC’s largest threat lies in its higher leverage and geopolitical complexities. I see Baker Hughes’ stronger balance sheet and scale as giving it a better risk-adjusted profile. Its more favorable debt metrics and stable stock volatility support this conclusion.
Final Verdict: Which stock to choose?
Baker Hughes Company (BKR) excels as a capital-efficient operator with a durable competitive advantage, evidenced by its steadily growing ROIC well above WACC. Its superpower lies in disciplined capital allocation and strong free cash flow generation. A point of vigilance is its recent revenue softness, which could pressure near-term growth. BKR suits investors targeting steady industrial growth with moderate risk tolerance.
TechnipFMC plc (FTI) stands out for its robust return on equity and a strategic moat anchored in operational agility and improving profitability. Its faster revenue and earnings growth create a strong growth momentum. Compared to BKR, FTI carries a slightly higher balance sheet leverage and valuation premium, signaling a need for cautious monitoring. It fits well with Growth at a Reasonable Price (GARP) investors seeking growth with some valuation discipline.
If you prioritize capital efficiency and stable cash flow generation, Baker Hughes Company is the compelling choice due to its proven value creation and resilient moat. However, if you seek accelerated earnings growth and superior ROE, TechnipFMC offers better growth potential, albeit with slightly elevated financial risk. Both companies present favorable scenarios for different investor profiles, warranting close attention to sector cyclicality and macro risks.
Disclaimer: Investment carries a risk of loss of initial capital. The past performance is not a reliable indicator of future results. Be sure to understand risks before making an investment decision.
Go Further
I encourage you to read the complete analyses of Baker Hughes Company and TechnipFMC plc to enhance your investment decisions: