Home > Comparison > Energy > SLB vs BKR
The strategic rivalry between SLB N.V. and Baker Hughes Company shapes the Energy sector’s equipment and services landscape. SLB operates as a global technology powerhouse focusing on integrated oilfield solutions. In contrast, Baker Hughes emphasizes diversified energy technologies spanning oilfield services, turbomachinery, and digital solutions. This analysis assesses which company’s operational model offers a superior risk-adjusted investment opportunity amid evolving energy market dynamics.
Table of contents
Companies Overview
SLB N.V. and Baker Hughes Company stand as pivotal players in the global oilfield services and equipment sector.
SLB N.V.: Global Energy Technology Leader
SLB dominates the Oil & Gas Equipment & Services industry with a vast portfolio spanning digital integration, reservoir performance, and well construction. Its revenue stems from advanced technology and engineering solutions supporting hydrocarbon production and carbon management. In 2026, SLB sharpened its focus on integrated energy systems and subsurface data analytics to enhance operational efficiency and sustainability.
Baker Hughes Company: Comprehensive Energy Solutions Provider
Baker Hughes commands a broad market presence delivering exploration, drilling, and production services through four core segments. Its income primarily derives from oilfield services, equipment manufacturing, turbomachinery, and digital process solutions. Strategic emphasis in 2026 centers on expanding digital solutions and life-of-field services to optimize asset performance and reduce environmental impact.
Strategic Collision: Similarities & Divergences
Both companies compete fiercely in oilfield services but diverge in approach; SLB prioritizes technology integration and subsurface analytics, while Baker Hughes balances diversified equipment and digital process solutions. The primary battleground is operational efficiency in upstream and midstream sectors. Investors should note SLB’s larger scale and innovation edge versus Baker Hughes’ breadth and industrial diversification.
Income Statement Comparison
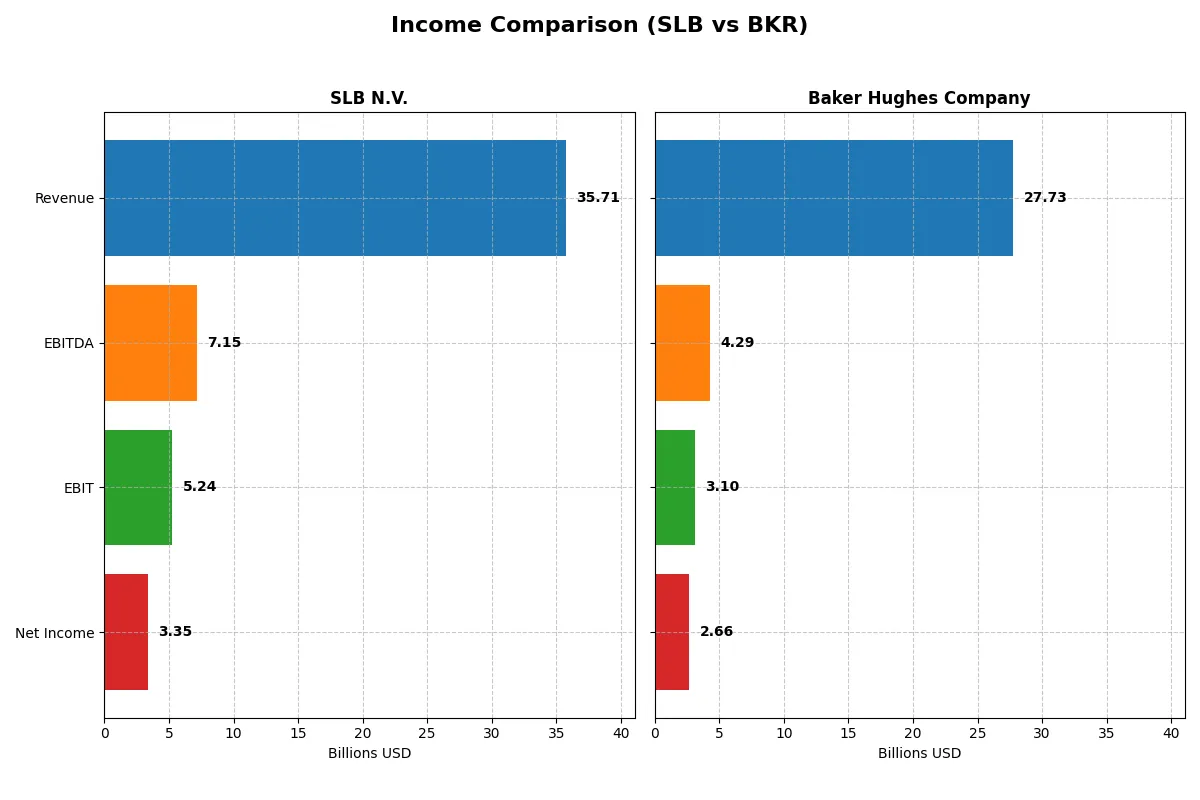
This data dissects the core profitability and scalability of both corporate engines to reveal who dominates the bottom line:
| Metric | SLB N.V. (SLB) | Baker Hughes Company (BKR) |
|---|---|---|
| Revenue | 35.7B | 27.7B |
| Cost of Revenue | 29.2B | 21.2B |
| Operating Expenses | 1.05B | 3.20B |
| Gross Profit | 6.50B | 6.54B |
| EBITDA | 7.15B | 4.29B |
| EBIT | 5.24B | 3.10B |
| Interest Expense | 557M | 222M |
| Net Income | 3.35B | 2.66B |
| EPS | 2.38 | 2.62 |
| Fiscal Year | 2025 | 2025 |
Income Statement Analysis: The Bottom-Line Duel
This income statement comparison reveals which company harnesses its revenue most efficiently to convert sales into profits.
SLB N.V. Analysis
SLB grew revenue by 56% from 2021 to 2025 but saw a slight 1.6% dip in 2025 alone. Gross margins held steady near 18%, while net margins expanded to 9.4%, signaling solid profitability. However, 2025 marked a slowdown in profitability momentum, with net income falling 24% year-over-year despite overall strong growth since 2021.
Baker Hughes Company Analysis
Baker Hughes increased revenue by 35% over five years but experienced a marginal 0.3% decline in 2025. Its gross margin improved to a robust 23.6%, outperforming SLB, with net margins slightly higher at 9.6%. The company’s net income surged dramatically over the long term, showing a 13-fold rise since 2021, though recent earnings saw a 12.7% drop in EPS.
Margin Strength vs. Growth Trajectory
Baker Hughes commands superior gross margins and a remarkable net income growth over five years, reflecting strong operational leverage. SLB delivers higher absolute revenue and consistent net margin expansion but faces recent profit pressure. For investors prioritizing margin quality and explosive earnings growth, Baker Hughes presents a compelling profile. SLB suits those valuing scale with steady margin resilience.
Financial Ratios Comparison
These vital ratios act as a diagnostic tool to expose the underlying fiscal health, valuation premiums, and capital efficiency of the companies compared below:
| Ratios | SLB N.V. (SLB) | Baker Hughes (BKR) |
|---|---|---|
| ROE | 12.8% | 12.3% |
| ROIC | 10.3% | 11.0% |
| P/E | 16.9 | 16.9 |
| P/B | 2.16 | 2.08 |
| Current Ratio | 1.33 | 1.36 |
| Quick Ratio | 0.98 | 1.00 |
| D/E (Debt-to-Equity) | 0.47 | 0.28 |
| Debt-to-Assets | 22.4% | 14.9% |
| Interest Coverage | 9.8x | 15.1x |
| Asset Turnover | 0.65 | 0.68 |
| Fixed Asset Turnover | 4.07 | 5.21 |
| Payout Ratio | 47.8% | 34.2% |
| Dividend Yield | 2.84% | 2.02% |
| Fiscal Year | 2025 | 2025 |
Efficiency & Valuation Duel: The Vital Signs
Financial ratios act as a company’s DNA, exposing hidden risks and operational strengths crucial for investment decisions.
SLB N.V.
SLB shows solid profitability with a 12.83% ROE and a 9.38% net margin, reflecting operational competence. Its P/E of 16.85 and P/B of 2.16 suggest a fairly valued stock, neither expensive nor cheap. SLB returns value through a 2.84% dividend yield, balancing shareholder income with growth investments.
Baker Hughes Company
BKR delivers comparable profitability, with a 12.31% ROE and a 9.59% net margin, indicating steady efficiency. Its valuation metrics, P/E at 16.91 and P/B at 2.08, also appear neutral. BKR offers a 2.02% dividend yield, signaling a commitment to shareholder returns while maintaining operational stability.
Balanced Profitability and Valuation: A Close Contest
Both SLB and BKR present slightly favorable financial ratios with neutral valuations and solid profitability. SLB offers a higher dividend yield, appealing to income-focused investors. BKR’s marginally better ROIC and lower leverage suit those prioritizing operational safety and capital efficiency. Choose based on your income versus risk preference.
Which one offers the Superior Shareholder Reward?
I compare SLB N.V. and Baker Hughes Company on dividend yield, payout ratios, and buybacks. SLB yields ~2.8% with a 34–48% payout, supported by strong free cash flow coverage (up to 1.97x). Baker Hughes yields ~2.0%, with ~28–40% payout and 100% free cash flow payout coverage, but no reported capex, suggesting aggressive buybacks. SLB’s balance between dividends and buybacks appears more sustainable given its solid cash flow and capex discipline. Baker Hughes’s lower leverage and higher free cash flow per share fuel buybacks, yet its lower dividend yield limits immediate income. I conclude SLB offers a superior total return profile in 2026, blending yield with sustainable capital returns.
Comparative Score Analysis: The Strategic Profile
The radar chart reveals the fundamental DNA and trade-offs of SLB N.V. and Baker Hughes Company, highlighting their strategic financial strengths and weaknesses:
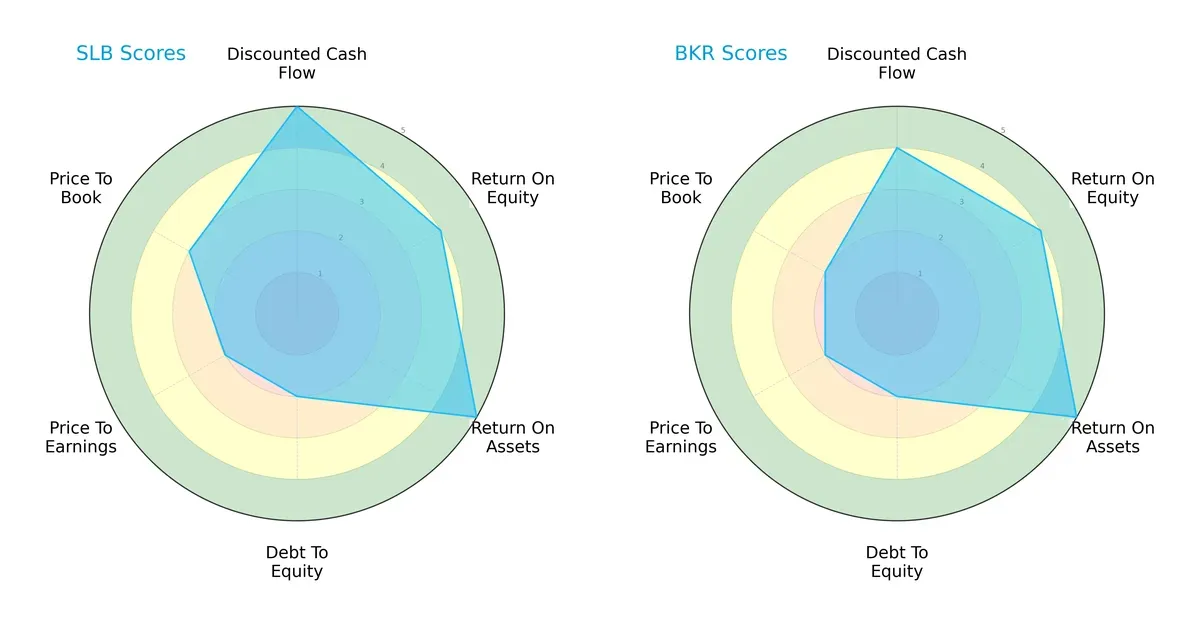
SLB exhibits a more balanced profile with top scores in discounted cash flow (5) and return on assets (5), suggesting strong future cash generation and asset efficiency. Both firms share moderate debt-to-equity (2) and price-to-earnings scores (2), but SLB edges out Baker Hughes on price-to-book valuation (3 vs. 2). Baker Hughes matches SLB’s return on equity (4) and return on assets (5) but ranks slightly lower overall, relying more on operational efficiency than valuation metrics. SLB’s diversified strengths indicate a robust strategic position, while Baker Hughes leans on specific operational advantages.
Bankruptcy Risk: Solvency Showdown
The Altman Z-Score delta between SLB (3.11) and Baker Hughes (2.83) indicates:
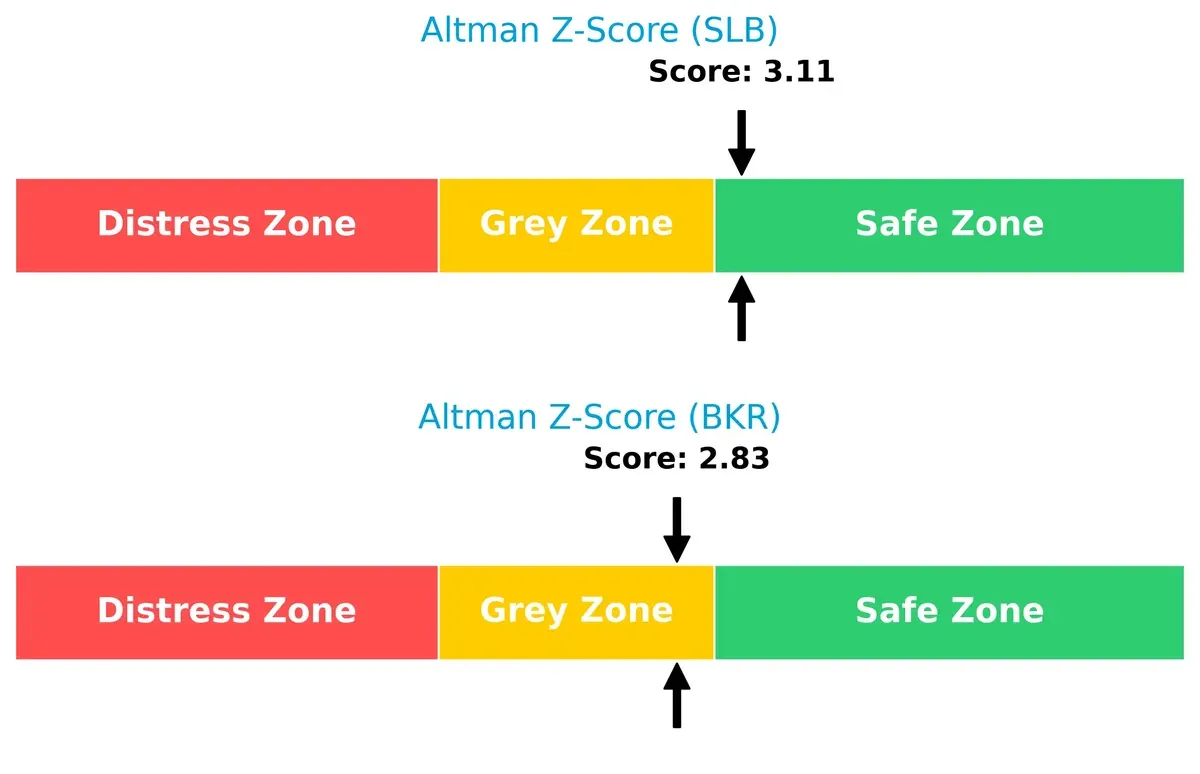
SLB sits comfortably in the safe zone, signaling strong solvency and low bankruptcy risk. Baker Hughes lingers in the grey zone, implying moderate financial distress risk amid economic cycles. Historically, firms with scores above 3 weather downturns better, making SLB the more secure long-term survivor.
Financial Health: Quality of Operations
Piotroski F-Scores expose operational quality differences between the two companies:
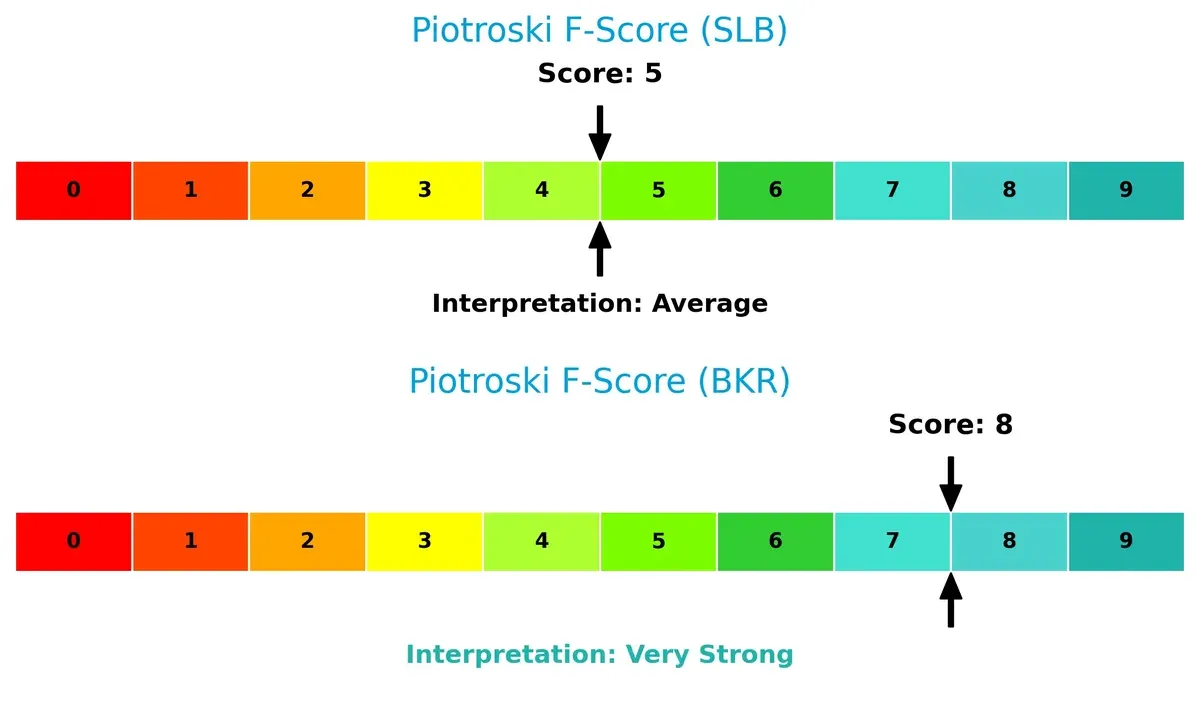
Baker Hughes scores an impressive 8, reflecting very strong internal financial health and efficient capital allocation. SLB’s score of 5 is average, raising caution about some internal metrics. This contrast suggests Baker Hughes maintains superior profitability, liquidity, and leverage controls, while SLB may harbor red flags investors should monitor.
How are the two companies positioned?
This section dissects the operational DNA of SLB and BKR by comparing their revenue distribution and internal dynamics. The goal is to confront their economic moats to reveal which model offers the most resilient, sustainable competitive edge today.
Revenue Segmentation: The Strategic Mix
This visual comparison dissects how SLB N.V. and Baker Hughes Company diversify their income streams, revealing where each firm places its primary sector bets:
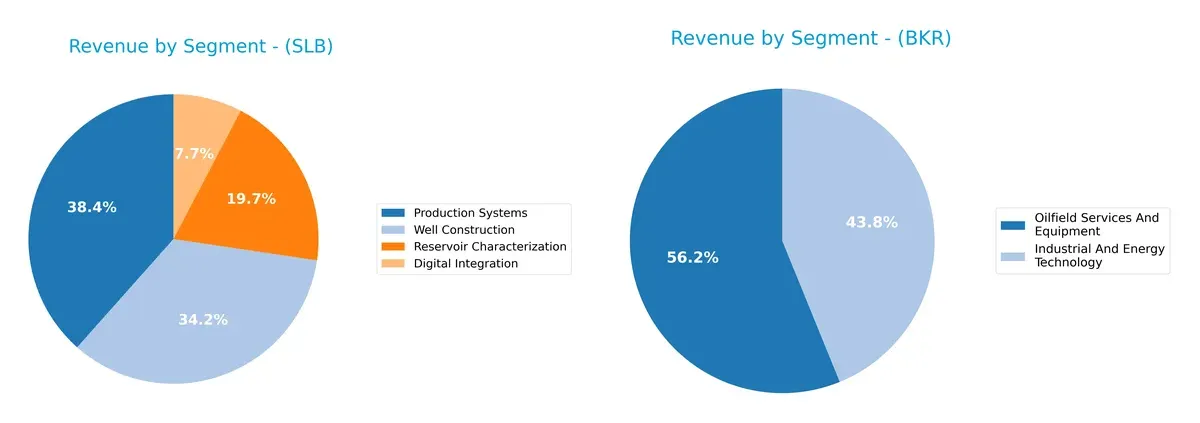
SLB pivots around four robust segments, with Well Construction anchoring at $13.4B, followed by Production Systems at $13.3B in 2025. This balance reduces concentration risk. Baker Hughes leans heavily on Oilfield Services and Equipment, generating $15.6B in 2024, dwarfing its $12.2B Industrial and Energy Technology segment. SLB’s diversified mix suggests stronger ecosystem lock-in, while Baker Hughes faces higher dependence on core services, exposing it to sector cyclicality.
Strengths and Weaknesses Comparison
This table compares the strengths and weaknesses of SLB N.V. and Baker Hughes Company:
SLB Strengths
- Diverse product segments including Digital Integration and Well Construction
- Favorable ROIC above WACC indicating value creation
- Solid dividend yield at 2.84%
- Low debt-to-assets ratio at 22.43%
- Strong fixed asset turnover at 4.07
BKR Strengths
- Balanced revenue between Oilfield Services and Industrial Technology
- Higher ROIC than WACC signaling efficient capital use
- Superior interest coverage of 13.96
- Lower debt-to-assets ratio at 14.89%
- Strong fixed asset turnover at 5.21
SLB Weaknesses
- Neutral net margin and ROE suggest average profitability
- Quick ratio below 1 indicates tighter liquidity
- Neutral asset turnover of 0.65 may limit efficiency gains
BKR Weaknesses
- Neutral net margin and ROE reflect moderate profitability
- Quick ratio at 1.0 shows minimal liquidity buffer
- Slightly higher WACC at 7.38% increases capital cost
Overall, both companies demonstrate slightly favorable financial profiles with solid capital efficiency and manageable debt levels. SLB shows strength in dividend yield and asset utilization, while BKR benefits from stronger liquidity and interest coverage. These nuances highlight different strategic focuses on capital management and operational efficiency.
The Moat Duel: Analyzing Competitive Defensibility
A structural moat remains the sole barrier protecting long-term profits from relentless competitive erosion in capital-intensive industries:
SLB N.V.: Technological Integration Moat
SLB leverages advanced digital and integrated technology solutions, sustaining high ROIC and stable EBIT margins. Its expansion into carbon management deepens this moat in 2026, though evolving energy demands pose risks.
Baker Hughes Company: Diversified Service Moat
Baker Hughes contrasts with SLB by offering a broad service portfolio and strong operational efficiency, reflected in robust gross margins and explosive ROIC growth. Its digital solutions segment fuels future expansion and potential market disruption.
Integrated Technology Moat vs. Service Diversification Moat
Both companies exhibit durable moats with ROIC above WACC and strong growth trajectories. However, Baker Hughes’ faster ROIC expansion suggests a wider moat. It appears better positioned to defend market share amid evolving energy sector demands.
Which stock offers better returns?
The past year saw SLB N.V. endure a bearish trend with accelerating decline, while Baker Hughes Company surged sharply, reflecting distinct trading dynamics and price momentum.
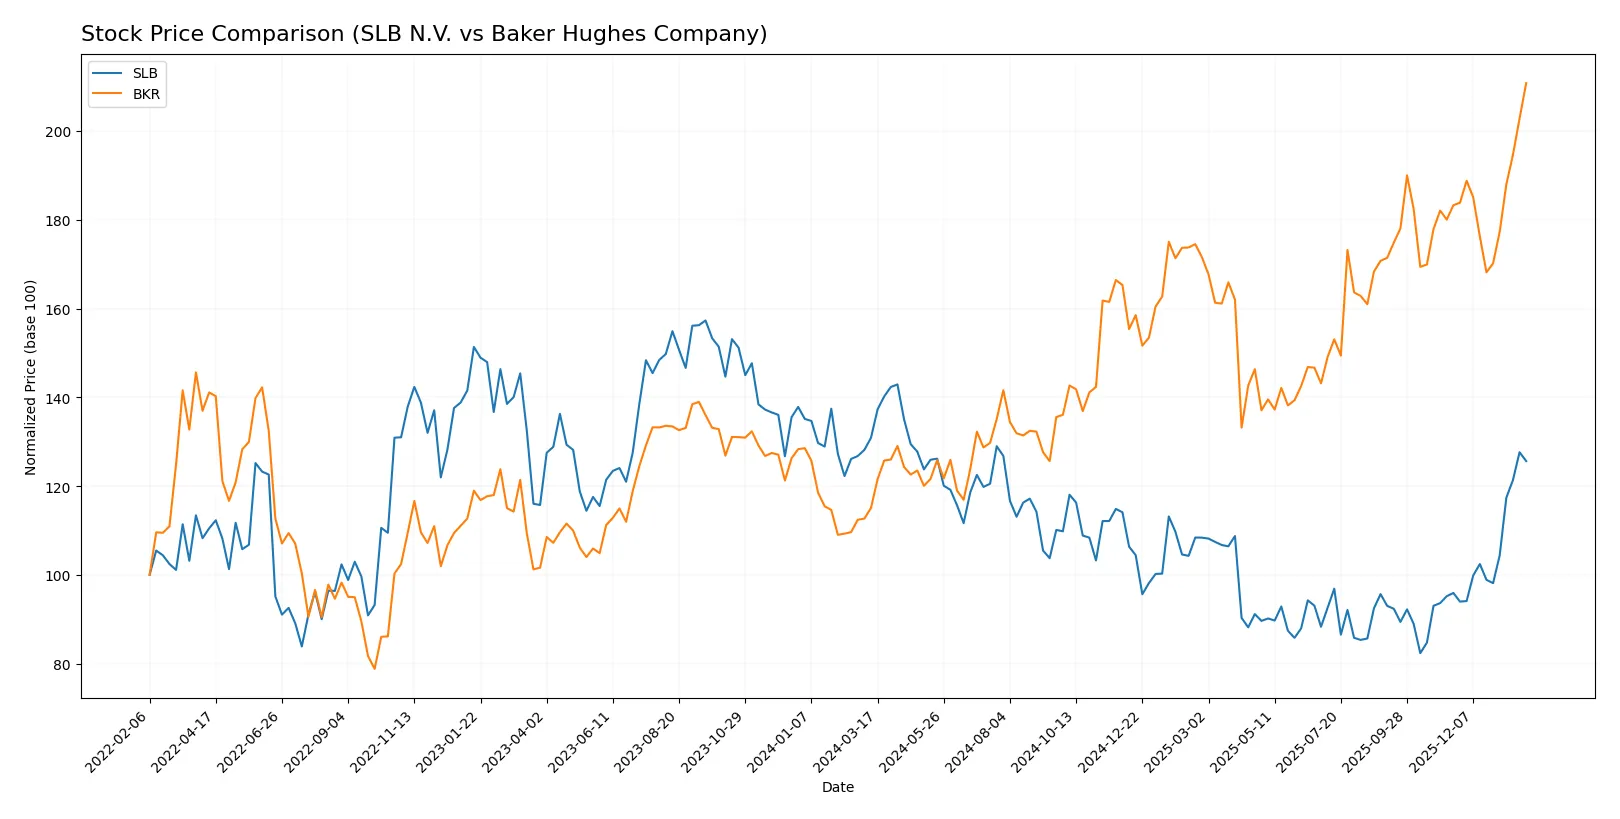
Trend Comparison
SLB N.V. recorded a -4.01% price decline over the past 12 months, marking a bearish trend with accelerating downward momentum and a high volatility of 5.73%. Baker Hughes Company gained 83.14% over the same period, showing a strong bullish trend with acceleration and slightly higher volatility at 5.94%. BKR significantly outperformed SLB, delivering the highest market returns with steady acceleration and robust price appreciation.
Target Prices
Analysts present a moderately bullish consensus on SLB N.V. and Baker Hughes Company for 2026.
| Company | Target Low | Target High | Consensus |
|---|---|---|---|
| SLB N.V. | 45 | 61 | 52.59 |
| Baker Hughes Company | 52 | 67 | 58.9 |
The consensus target prices suggest upside potential of roughly 9% for SLB and 5% for Baker Hughes versus current prices. Analysts expect measured growth reflecting sector cyclicality and prudent capital allocation.

Don’t Let Luck Decide Your Entry Point
Optimize your entry points with our advanced ProRealTime indicators. You’ll get efficient buy signals with precise price targets for maximum performance. Start outperforming now!
How do institutions grade them?
The following tables summarize recent institutional grades for SLB N.V. and Baker Hughes Company:
SLB N.V. Grades
This table shows SLB N.V.’s latest grades and actions from major financial institutions.
| Grading Company | Action | New Grade | Date |
|---|---|---|---|
| BMO Capital | Maintain | Outperform | 2026-01-26 |
| JP Morgan | Maintain | Overweight | 2026-01-26 |
| Barclays | Maintain | Overweight | 2026-01-26 |
| RBC Capital | Maintain | Outperform | 2026-01-26 |
| Susquehanna | Maintain | Positive | 2026-01-26 |
| B of A Securities | Maintain | Buy | 2026-01-26 |
| Citigroup | Maintain | Buy | 2026-01-26 |
| Stifel | Maintain | Buy | 2026-01-21 |
| Susquehanna | Maintain | Positive | 2026-01-07 |
| Freedom Capital Markets | Downgrade | Hold | 2026-01-06 |
Baker Hughes Company Grades
Below are Baker Hughes Company’s recent grades from leading financial analysts.
| Grading Company | Action | New Grade | Date |
|---|---|---|---|
| Citigroup | Maintain | Buy | 2026-01-28 |
| UBS | Maintain | Neutral | 2026-01-28 |
| BMO Capital | Maintain | Outperform | 2026-01-27 |
| JP Morgan | Maintain | Overweight | 2026-01-27 |
| Susquehanna | Maintain | Positive | 2026-01-27 |
| Barclays | Maintain | Overweight | 2026-01-27 |
| Stifel | Maintain | Buy | 2026-01-27 |
| Stifel | Maintain | Buy | 2026-01-21 |
| Susquehanna | Maintain | Positive | 2026-01-07 |
| TD Cowen | Maintain | Buy | 2026-01-07 |
Which company has the best grades?
SLB N.V. and Baker Hughes Company both receive predominantly positive grades. SLB has a wider range of “Buy,” “Outperform,” and “Overweight” ratings but includes one recent downgrade to “Hold.” Baker Hughes has consistent “Buy” and “Outperform” ratings with fewer downgrades. Investors may view Baker Hughes’s steadier grade profile as a sign of stability.
Risks specific to each company
The following categories identify the critical pressure points and systemic threats facing both firms in the 2026 market environment:
1. Market & Competition
SLB N.V.
- Faces intense competition in oilfield services with large scale and broad technology portfolio.
Baker Hughes Company
- Competes with diversified energy tech but has smaller scale and narrower segment focus.
2. Capital Structure & Debt
SLB N.V.
- Moderate leverage with debt-to-assets at 22.43%, interest coverage strong at 9.4x.
Baker Hughes Company
- Lower leverage, debt-to-assets at 14.89%, and superior interest coverage at 13.96x.
3. Stock Volatility
SLB N.V.
- Lower beta at 0.723 signals less price volatility versus market.
Baker Hughes Company
- Higher beta at 0.887 indicates more sensitivity to market swings.
4. Regulatory & Legal
SLB N.V.
- Exposure to energy regulations and evolving carbon management policies.
Baker Hughes Company
- Faces similar regulatory environment with emphasis on industrial and energy compliance.
5. Supply Chain & Operations
SLB N.V.
- Large global operations with complex supply chain vulnerable to disruptions.
Baker Hughes Company
- Smaller workforce and diversified segments may reduce operational risks.
6. ESG & Climate Transition
SLB N.V.
- Invests in carbon management and integrated energy solutions, but transition risks remain.
Baker Hughes Company
- Advances digital and low-carbon tech but must accelerate climate adaptation.
7. Geopolitical Exposure
SLB N.V.
- Global footprint in volatile regions exposes it to geopolitical risks.
Baker Hughes Company
- Also globally exposed but less diversified, concentrating risk in key markets.
Which company shows a better risk-adjusted profile?
SLB’s main risk lies in its complex global operations and geopolitical exposure. Baker Hughes faces capital structure strength but higher stock volatility. Baker Hughes’ lower leverage and stronger interest coverage indicate a more resilient balance sheet. However, SLB’s lower stock beta suggests less market risk. Recent data show SLB’s Altman Z-score in the safe zone, while Baker Hughes remains in the grey zone despite a stronger Piotroski score. Overall, SLB offers a slightly better risk-adjusted profile due to financial stability and market volatility control.
Final Verdict: Which stock to choose?
SLB N.V. stands out as a powerhouse of operational efficiency and capital discipline. Its durable competitive advantage is reflected in a steadily improving ROIC well above its cost of capital, signaling consistent value creation. The main point of vigilance remains its recent revenue and earnings softness, which could challenge momentum. SLB fits well in an aggressive growth portfolio willing to tolerate cyclicality.
Baker Hughes Company boasts a strategic moat rooted in its strong asset turnover and impressive free cash flow generation. Compared to SLB, it offers a more conservative financial profile with lower leverage and robust interest coverage. Its consistent profitability and high Piotroski score suggest resilience. BKR appeals to investors seeking GARP—growth at a reasonable price—with a bias toward stability.
If you prioritize aggressive growth fueled by operational excellence and capital efficiency, SLB is the compelling choice due to its proven ability to create value over time despite near-term headwinds. However, if you seek a balance of growth and financial stability with a resilient business model, BKR offers better stability and a safer risk profile, commanding a reasonable valuation premium.
Disclaimer: Investment carries a risk of loss of initial capital. The past performance is not a reliable indicator of future results. Be sure to understand risks before making an investment decision.
Go Further
I encourage you to read the complete analyses of SLB N.V. and Baker Hughes Company to enhance your investment decisions: