Home > Comparison > Energy > BKR vs HAL
The strategic rivalry between Baker Hughes Company and Halliburton Company shapes the trajectory of the global oilfield services sector. Baker Hughes operates as a diversified energy technology provider with broad industrial solutions. Halliburton focuses on specialized completion and drilling services with a strong emphasis on digital integration. This analysis pits Baker Hughes’ diversified model against Halliburton’s service-centric approach to identify which offers superior risk-adjusted returns for a balanced portfolio.
Table of contents
Companies Overview
Baker Hughes and Halliburton dominate the global oilfield equipment and services sector with expansive and innovative portfolios.
Baker Hughes Company: Integrated Energy Technology Leader
Baker Hughes operates as a diversified energy technology provider. Its revenue stems from four segments: Oilfield Services, Equipment, Turbomachinery, and Digital Solutions. In 2026, the company emphasizes digital transformation and lifecycle solutions, blending traditional oilfield services with advanced sensor-based monitoring to enhance operational efficiency for energy clients.
Halliburton Company: Comprehensive Oilfield Services Expert
Halliburton delivers broad oil and gas services across drilling, evaluation, completion, and production. Its revenue relies on two core segments: Completion & Production and Drilling & Evaluation. The firm focuses strategically on cloud-based digital services and AI-driven subsurface insights, adopting an open architecture to optimize well construction and reservoir management in 2026.
Strategic Collision: Similarities & Divergences
Both firms compete fiercely in oilfield services but diverge in approach. Baker Hughes integrates a multi-segment hardware and digital ecosystem, whereas Halliburton prioritizes software-driven open architecture and AI. Their battleground centers on digital innovation and operational efficiency. Investors face distinct profiles: Baker Hughes blends equipment and software breadth; Halliburton offers a focused digital services edge.
Income Statement Comparison
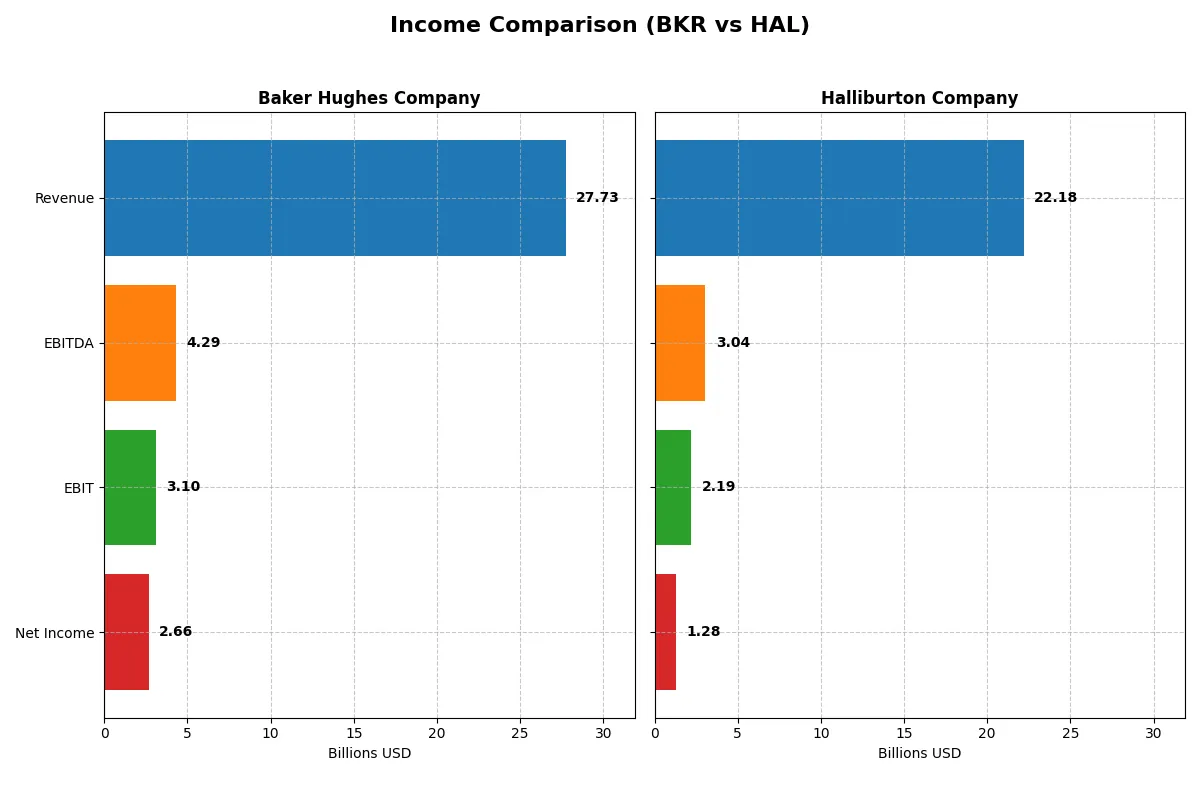
This data dissects the core profitability and scalability of both corporate engines to reveal who dominates the bottom line:
| Metric | Baker Hughes Company (BKR) | Halliburton Company (HAL) |
|---|---|---|
| Revenue | 27.7B | 22.2B |
| Cost of Revenue | 21.2B | 18.7B |
| Operating Expenses | 3.2B | 0.8B |
| Gross Profit | 6.5B | 3.5B |
| EBITDA | 4.3B | 3.0B |
| EBIT | 3.1B | 2.2B |
| Interest Expense | 222M | 418M |
| Net Income | 2.7B | 1.3B |
| EPS | 2.62 | 1.51 |
| Fiscal Year | 2025 | 2025 |
Income Statement Analysis: The Bottom-Line Duel
This income statement comparison reveals which company converts revenue into profit most efficiently and maintains healthier margins over time.
Baker Hughes Company Analysis
Baker Hughes’s revenue grew 35% from 2021 to 2025, reaching $27.7B in 2025. Net income surged over 13-fold, hitting $2.66B, signaling strong profit momentum. Its gross margin of 23.6% and net margin near 9.6% remain favorable, reflecting disciplined cost control despite a slight revenue dip in 2025. Baker Hughes sustains solid operational efficiency.
Halliburton Company Analysis
Halliburton’s revenue increased 45% over five years, topping $22.2B in 2025 but fell by 3.3% in the latest year. Net income dropped nearly 12% overall, with $1.28B in 2025 and margins under pressure—gross margin at 15.8%, net margin at 5.8%. The company struggles with shrinking profitability and a steep 47% EPS decline last year, indicating margin compression challenges.
Margin Strength vs. Revenue Growth Scale
Baker Hughes leads in margin quality and net income growth, showcasing superior profitability and cost discipline. Halliburton offers higher revenue growth but suffers from declining margins and profitability erosion. For investors prioritizing earnings efficiency and margin stability, Baker Hughes presents a more attractive fundamental profile.
Financial Ratios Comparison
These vital ratios act as a diagnostic tool to expose the underlying fiscal health, valuation premiums, and capital efficiency of the companies compared:
| Ratios | Baker Hughes Company (BKR) | Halliburton Company (HAL) |
|---|---|---|
| ROE | 12.3% | 12.2% |
| ROIC | 11.0% | 9.7% |
| P/E | 16.9 | 18.5 |
| P/B | 2.08 | 2.26 |
| Current Ratio | 1.36 | 2.04 |
| Quick Ratio | 1.00 | 1.51 |
| D/E | 0.28 | 0.84 |
| Debt-to-Assets | 14.9% | 35.4% |
| Interest Coverage | 15.1 | 6.3 |
| Asset Turnover | 0.68 | 0.89 |
| Fixed Asset Turnover | 5.21 | 3.58 |
| Payout ratio | 34.2% | 45.1% |
| Dividend yield | 2.02% | 2.44% |
| Fiscal Year | 2025 | 2025 |
Efficiency & Valuation Duel: The Vital Signs
Financial ratios act as a company’s DNA, unveiling hidden risks and operational strengths critical to investment decisions.
Baker Hughes Company
Baker Hughes shows solid profitability with a 12.31% ROE and a 9.59% net margin, reflecting operational efficiency. Its valuation metrics, including a 16.91 P/E and 2.08 P/B, appear fairly valued, neither stretched nor cheap. The company supports shareholders through a 2.02% dividend yield, signaling steady cash returns alongside a favorable 11.01% ROIC above its 7.26% WACC.
Halliburton Company
Halliburton posts a comparable 12.21% ROE but a lower 5.78% net margin, suggesting thinner profitability. Its valuation is slightly higher with an 18.48 P/E and 2.26 P/B, implying a somewhat premium pricing. Halliburton offers a 2.44% dividend yield and maintains strong liquidity with a 2.04 current ratio, balancing modest operational efficiency with prudent capital returns.
Balanced Profitability Meets Valuation Discipline
Baker Hughes offers a better mix of profitability and valuation discipline, with a stronger ROIC and more conservative leverage. Halliburton’s higher liquidity and dividend yield attract income-focused investors. Risk-averse investors may prefer Baker Hughes’ operational efficiency, while those valuing liquidity might lean toward Halliburton.
Which one offers the Superior Shareholder Reward?
I observe Baker Hughes (BKR) yields a 2.0% dividend with a 34% payout ratio, backed by free cash flow coverage of 100%. Halliburton (HAL) offers a slightly higher 2.4% yield but with a riskier 45% payout ratio and 57% free cash flow coverage. Both run active buyback programs; Halliburton’s operating cash flow per share (3.5) exceeds Baker Hughes’ (3.9), yet Baker Hughes shows more consistent capital discipline. Halliburton’s higher leverage (debt-to-equity 0.84 vs. 0.28) intensifies risk. I find Baker Hughes’ balanced dividend and buyback strategy more sustainable for 2026, offering superior long-term total shareholder returns compared to Halliburton’s aggressive but riskier model.
Comparative Score Analysis: The Strategic Profile
The radar chart reveals the fundamental DNA and trade-offs of Baker Hughes Company and Halliburton Company:
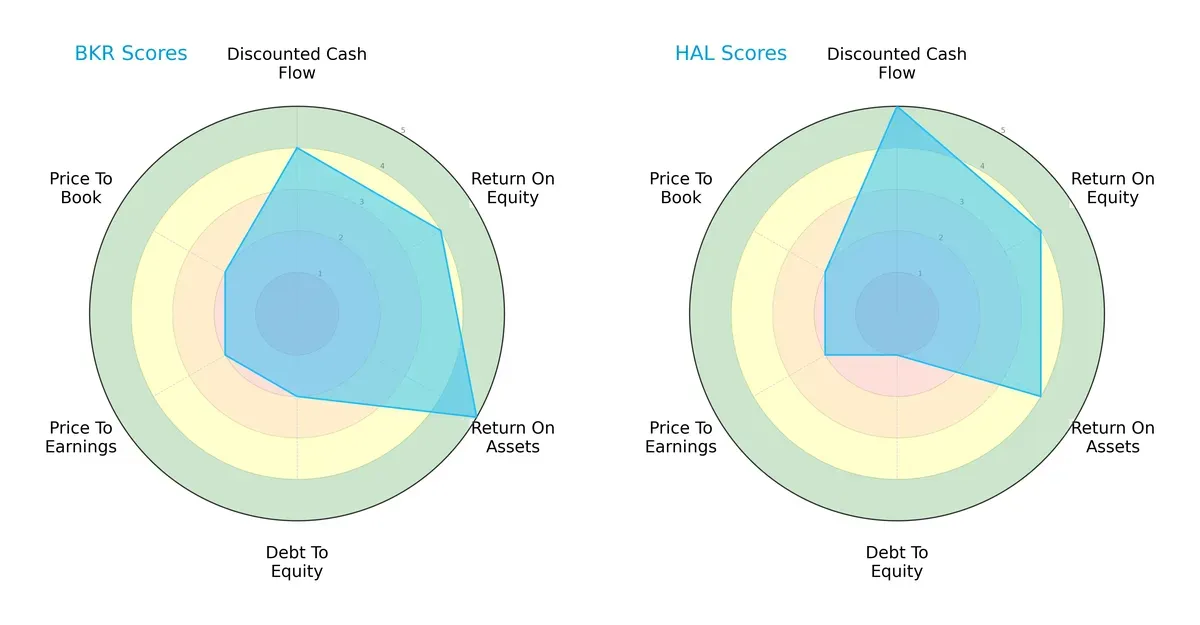
Baker Hughes shows strength in asset efficiency with a very favorable ROA score of 5, outperforming Halliburton’s 4. Halliburton leads in discounted cash flow valuation with a very favorable score of 5 versus Baker Hughes’ 4. Both share equal ROE scores of 4. However, Baker Hughes carries a less favorable debt profile (2) compared to Halliburton’s weaker 1, indicating higher leverage risk. Valuation metrics (PE and PB) are equally unfavorable for both. Baker Hughes offers a more balanced operational efficiency, while Halliburton relies on superior cash flow valuation.
Bankruptcy Risk: Solvency Showdown
The Altman Z-Score gap favors Halliburton with 3.53 in the safe zone versus Baker Hughes at 2.86 in the grey zone:
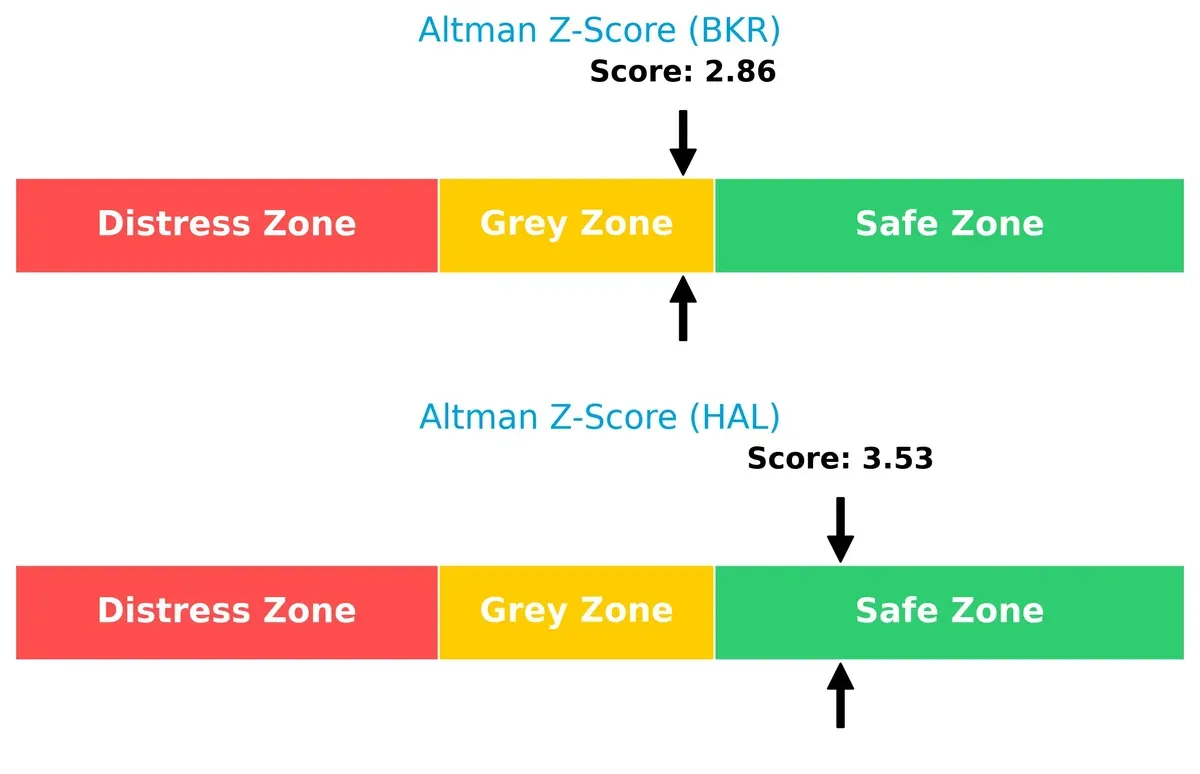
Halliburton’s stronger solvency suggests a safer long-term survival outlook amid current market cycles. Baker Hughes faces moderate bankruptcy risk, warranting cautious monitoring.
Financial Health: Quality of Operations
Baker Hughes achieves a very strong Piotroski F-Score of 8, surpassing Halliburton’s average 5:
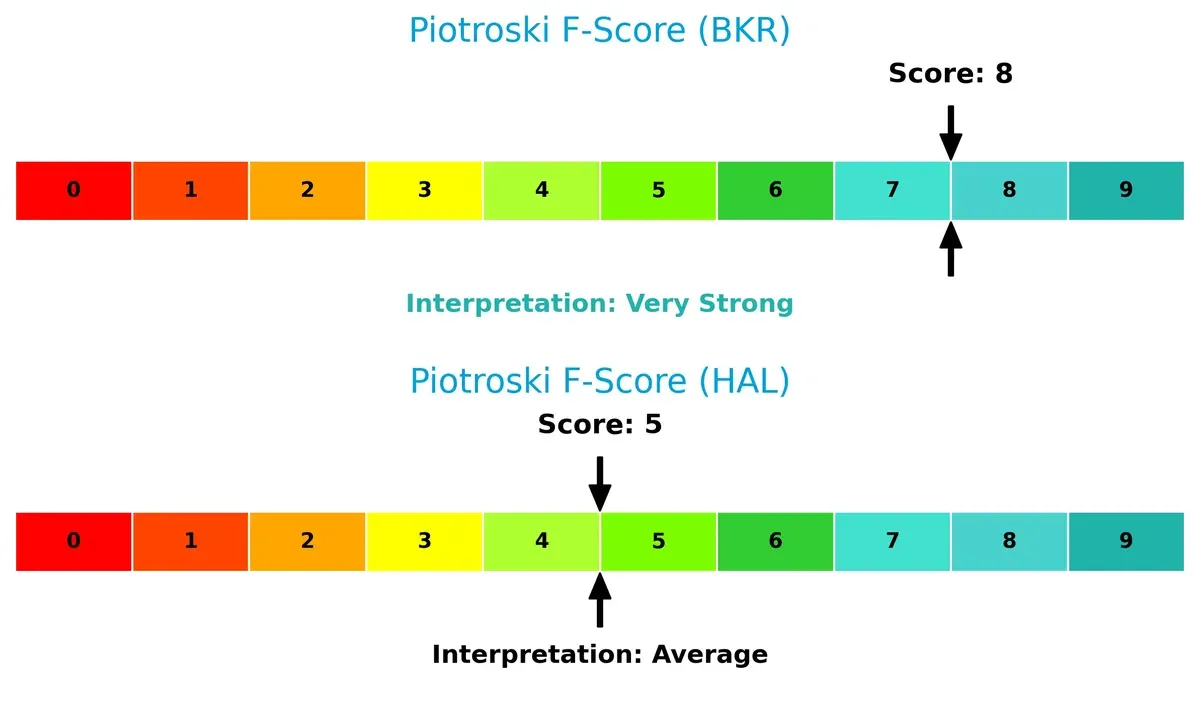
Baker Hughes demonstrates superior internal financial health, signaling robust profitability, liquidity, and operational efficiency. Halliburton’s middling score raises red flags on financial quality relative to its peer. Investors should weigh this discrepancy carefully.
How are the two companies positioned?
This section dissects BKR and HAL’s operational DNA by comparing revenue distribution and internal dynamics. The goal is to confront their economic moats and identify the more resilient, sustainable competitive advantage today.
Revenue Segmentation: The Strategic Mix
This visual comparison dissects how Baker Hughes Company and Halliburton Company diversify their income streams and where their primary sector bets lie:
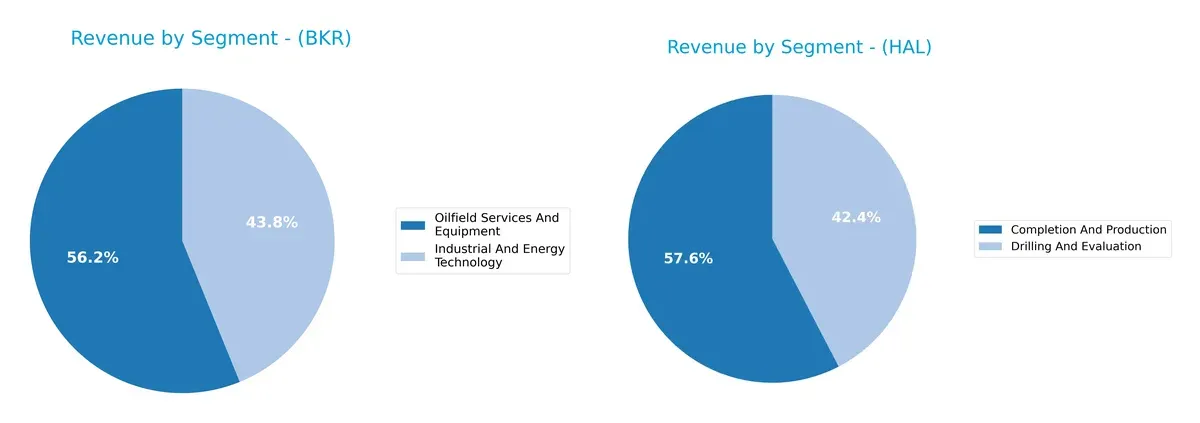
Baker Hughes pivots between Industrial And Energy Technology ($12.2B) and Oilfield Services And Equipment ($15.6B), showing a balanced two-segment focus. Halliburton relies heavily on Completion And Production ($13.3B) and Drilling And Evaluation ($9.7B), but Completion And Production anchors its revenue more firmly. Baker Hughes’ more even split suggests less concentration risk, while Halliburton’s dominance in production services reflects deep ecosystem lock-in.
Strengths and Weaknesses Comparison
This table compares the Strengths and Weaknesses of Baker Hughes Company and Halliburton Company:
Baker Hughes Strengths
- Diverse segments including Industrial and Energy Technology and Oilfield Services
- Favorable ROIC vs. WACC indicates efficient capital allocation
- Low debt-to-equity ratio at 0.28 supports financial stability
- Strong interest coverage at 13.96 signals good debt servicing
- Higher fixed asset turnover at 5.21 demonstrates asset efficiency
- Global revenue heavily weighted outside US at $20.4B
Halliburton Strengths
- Balanced revenue mix between Completion and Production and Drilling and Evaluation
- Favorable current and quick ratios show strong liquidity
- Interest coverage at 5.24 remains favorable for debt obligations
- Dividend yield at 2.44% slightly higher than BKR
- Fixed asset turnover at 3.58 indicates reasonable asset use
- Diversified geographic presence across North America, Middle East/Asia, Latin America, and Europe/Africa
Baker Hughes Weaknesses
- Net margin and ROE rated only neutral, limiting profitability edge
- Moderate current ratio at 1.36 may restrict short-term flexibility
- Debt-to-assets ratio at 14.89% though favorable, may constrain leverage use
- Asset turnover neutral at 0.68 suggests room for operational improvement
- Market concentrated more in Non-US regions, potential geopolitical risks
Halliburton Weaknesses
- Lower net margin at 5.78% reflects weaker profitability
- Higher debt-to-equity ratio at 0.84 increases financial risk
- Debt-to-assets ratio at 35.37% signals higher leverage
- Interest coverage lower than BKR, though still favorable
- Market share heavily weighted in North America, less global diversification
Both companies show slightly favorable overall financial profiles with different strategic strengths. Baker Hughes excels in capital efficiency and lower leverage, benefiting from diversified industrial segments and strong international sales. Halliburton demonstrates stronger liquidity and geographic diversification but carries higher leverage and lower profitability, which may impact its resilience in downturns. These contrasts reflect distinct approaches to growth and risk management in a cyclical energy services market.
The Moat Duel: Analyzing Competitive Defensibility
A structural moat is the only true shield protecting long-term profits from relentless competitive erosion. Let’s dissect how these two energy service giants defend their turf:
Baker Hughes Company: Innovation-Fueled Operational Moat
Baker Hughes leverages intangible assets and advanced digital solutions that deliver high ROIC above WACC by 3.7%, signaling robust value creation. Its growing profitability in 2026, backed by expanding global services, deepens this moat.
Halliburton Company: Scale and Service Breadth Moat
Halliburton’s moat rests on extensive global scale and integrated drilling services, maintaining ROIC above WACC by 3.2%. However, a declining ROIC trend signals pressure on profitability. Expansion in AI-driven subsurface insights may arrest this decline.
Verdict: Innovation-Driven Moat vs. Scale-Driven Moat
Baker Hughes shows a wider and deepening moat due to its rising ROIC and innovation edge. Halliburton creates value but faces margin pressure. Baker Hughes is better equipped to defend and grow market share.
Which stock offers better returns?
Over the past year, Baker Hughes Company surged 82.3%, showing accelerating momentum and a notable high of 58.92. Halliburton Company declined 7.29%, despite recent acceleration and recovery signs.
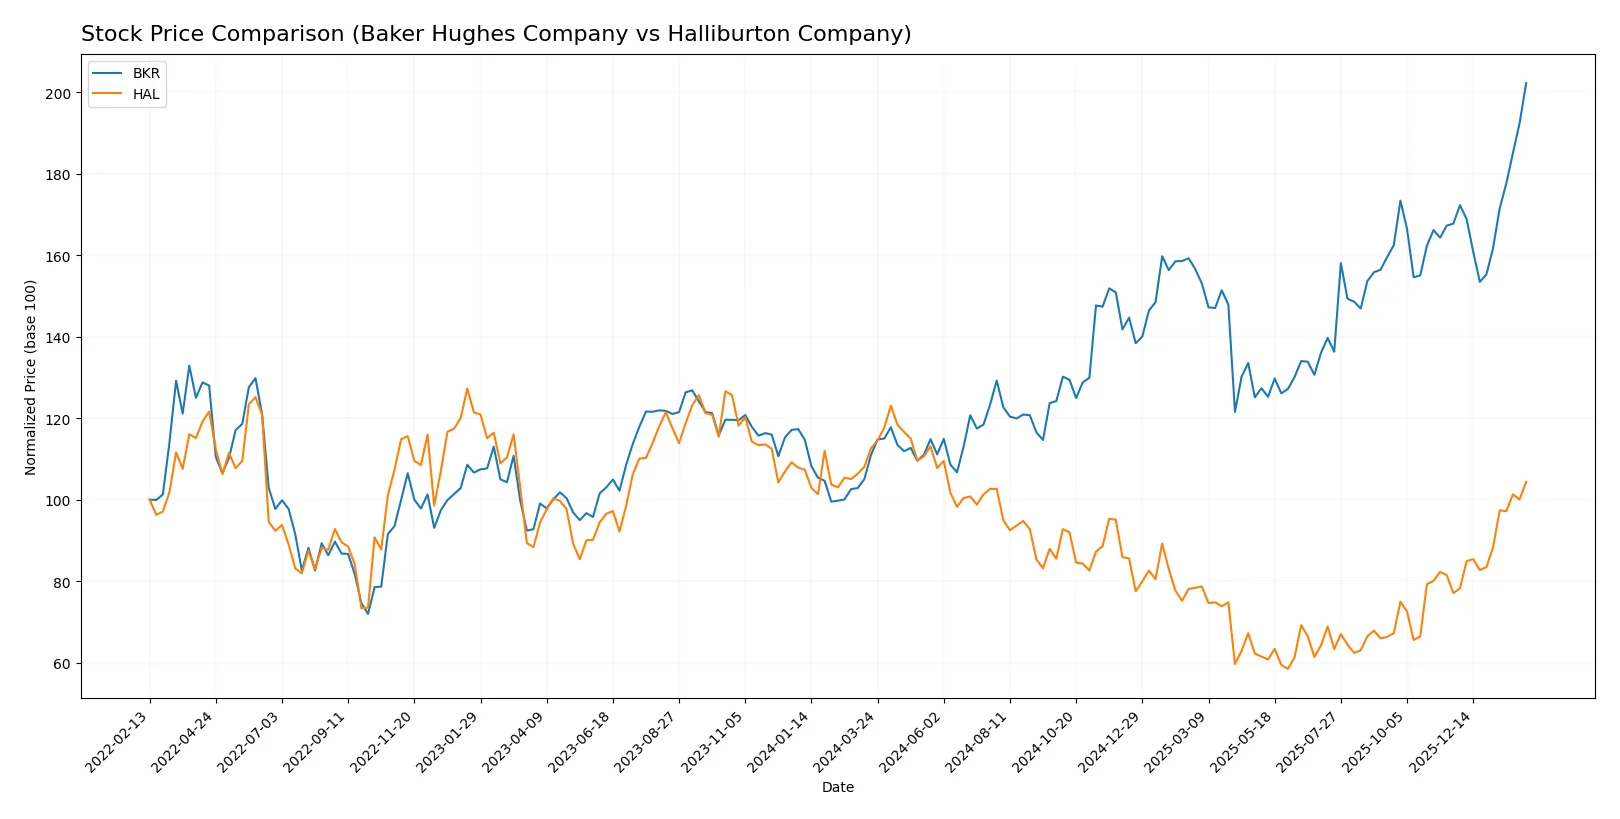
Trend Comparison
Baker Hughes Company’s stock price increased 82.3% over the last 12 months, reflecting a bullish trend with accelerating gains and a high volatility standard deviation of 6.12. The trend shows strong upward momentum and expanding price ranges.
Halliburton Company’s stock price fell 7.29% over the same period, marking a bearish trend despite recent acceleration. Volatility remains elevated with a 5.55 standard deviation, and the price range spans from 19.59 to 41.24.
Comparing both, Baker Hughes delivered the highest market performance with a robust 82.3% gain, while Halliburton experienced a negative return of 7.29% over the past year.
Target Prices
Analysts present a balanced target consensus for Baker Hughes Company and Halliburton Company, reflecting cautious optimism.
| Company | Target Low | Target High | Consensus |
|---|---|---|---|
| Baker Hughes Company | 52 | 67 | 59.4 |
| Halliburton Company | 25 | 40 | 35.23 |
Baker Hughes’s target consensus slightly exceeds its current price of $58.92, signaling modest upside potential. Halliburton’s consensus of $35.23 aligns closely with its current price of $34.98, indicating a market expectation of stability.

Don’t Let Luck Decide Your Entry Point
Optimize your entry points with our advanced ProRealTime indicators. You’ll get efficient buy signals with precise price targets for maximum performance. Start outperforming now!
How do institutions grade them?
Both Baker Hughes Company and Halliburton Company receive institutional grades from several reputable firms:
Baker Hughes Company Grades
This table summarizes recent grades from well-known grading companies for Baker Hughes Company.
| Grading Company | Action | New Grade | Date |
|---|---|---|---|
| Jefferies | Maintain | Buy | 2026-02-02 |
| Stifel | Maintain | Buy | 2026-02-02 |
| UBS | Maintain | Neutral | 2026-01-28 |
| Citigroup | Maintain | Buy | 2026-01-28 |
| BMO Capital | Maintain | Outperform | 2026-01-27 |
| Susquehanna | Maintain | Positive | 2026-01-27 |
| JP Morgan | Maintain | Overweight | 2026-01-27 |
| Barclays | Maintain | Overweight | 2026-01-27 |
| Stifel | Maintain | Buy | 2026-01-27 |
| Stifel | Maintain | Buy | 2026-01-21 |
Halliburton Company Grades
Below are the latest institutional grades for Halliburton Company from recognized grading firms.
| Grading Company | Action | New Grade | Date |
|---|---|---|---|
| UBS | Maintain | Neutral | 2026-01-23 |
| Citigroup | Maintain | Buy | 2026-01-23 |
| Stifel | Maintain | Buy | 2026-01-22 |
| Evercore ISI Group | Maintain | In Line | 2026-01-22 |
| Goldman Sachs | Maintain | Buy | 2026-01-22 |
| Susquehanna | Maintain | Positive | 2026-01-22 |
| RBC Capital | Maintain | Outperform | 2026-01-22 |
| JP Morgan | Maintain | Overweight | 2026-01-22 |
| Stifel | Maintain | Buy | 2026-01-21 |
| Piper Sandler | Maintain | Neutral | 2026-01-14 |
Which company has the best grades?
Baker Hughes has a slightly stronger consensus with more “Buy” and “Outperform” ratings sustained by multiple firms. Halliburton also holds solid “Buy” and “Outperform” grades but shows more “Neutral” ratings. This difference may influence investor confidence and risk perception.
Risks specific to each company
The following categories identify critical pressure points and systemic threats facing Baker Hughes Company and Halliburton Company in the 2026 market environment:
1. Market & Competition
Baker Hughes Company
- Larger market cap and diversified segments provide competitive resilience.
Halliburton Company
- Smaller scale but strong segment focus enhances niche competition.
2. Capital Structure & Debt
Baker Hughes Company
- Low debt-to-equity (0.28) supports financial flexibility and lower risk.
Halliburton Company
- Higher debt-to-equity (0.84) increases financial leverage and risk exposure.
3. Stock Volatility
Baker Hughes Company
- Beta of 0.86 indicates moderate volatility, slightly below market average.
Halliburton Company
- Beta of 0.75 reflects lower stock volatility and more stability.
4. Regulatory & Legal
Baker Hughes Company
- Operating across diverse energy segments increases regulatory complexity.
Halliburton Company
- Regulatory risk heightened by drilling and completion operations exposure.
5. Supply Chain & Operations
Baker Hughes Company
- Broad global operations with integrated digital solutions reduce supply chain disruptions.
Halliburton Company
- Operations depend heavily on drilling fluids and equipment, vulnerable to supply shifts.
6. ESG & Climate Transition
Baker Hughes Company
- Investments in turbomachinery and digital solutions align with energy transition.
Halliburton Company
- Limited ESG disclosure raises concerns amid increasing climate regulation.
7. Geopolitical Exposure
Baker Hughes Company
- Global footprint exposes it to geopolitical risks but diversifies country risk.
Halliburton Company
- Concentration in key regions may increase vulnerability to geopolitical shocks.
Which company shows a better risk-adjusted profile?
Baker Hughes faces its largest risk in managing leverage prudently amid market fluctuations. Halliburton’s key risk lies in its elevated debt burden, raising financial distress concerns. Baker Hughes’s stronger balance sheet and higher Piotroski score indicate a superior risk-adjusted profile. Recent data shows Halliburton’s Altman Z-score in the safe zone but with far less margin than Baker Hughes’s strong Piotroski score—underscoring the latter’s financial robustness and prudent capital allocation.
Final Verdict: Which stock to choose?
Baker Hughes Company (BKR) impresses with a durable competitive edge, evidenced by a rising ROIC well above its cost of capital. Its superpower lies in efficient capital allocation and steady value creation. A point of vigilance is its moderate leverage, which could pressure returns if market conditions worsen. BKR suits portfolios seeking aggressive growth with a tolerance for operational cyclicality.
Halliburton Company (HAL) anchors its value in operational scale and a robust liquidity profile, offering a strategic moat through asset turnover efficiency and strong working capital management. While its profitability trend shows some erosion, its lower volatility and higher current ratio provide a cushion against shocks. HAL fits well in GARP portfolios aiming for stability with reasonable growth prospects.
If you prioritize growth fueled by expanding profitability and capital efficiency, BKR outshines as the compelling choice due to its sustainable economic moat and accelerating price momentum. However, if you seek better stability and defensive liquidity in a volatile sector, HAL offers superior balance sheet safety and operational resilience despite recent margin pressures. Both present nuanced scenarios aligned with distinct investor risk profiles.
Disclaimer: Investment carries a risk of loss of initial capital. The past performance is not a reliable indicator of future results. Be sure to understand risks before making an investment decision.
Go Further
I encourage you to read the complete analyses of Baker Hughes Company and Halliburton Company to enhance your investment decisions: