Home > Comparison > Communication Services > BIDU vs SNAP
The strategic rivalry between Baidu, Inc. and Snap Inc. shapes the future of the Communication Services sector. Baidu operates as a capital-intensive, diversified platform with strong AI and cloud service integration in China. Snap focuses on high-margin, innovative camera and social media applications primarily in North America and Europe. This analysis will assess which firm’s business model offers superior risk-adjusted returns, guiding investors seeking durable exposure in a dynamic digital landscape.

Table of contents
Companies Overview
Baidu and Snap stand as pivotal players in internet content and communication services across distinct global markets.
Baidu, Inc.: China’s Digital Ecosystem Powerhouse
Baidu dominates China’s online marketing and cloud services sectors. Its core revenue stems from search-based and feed-based advertising enhanced by AI initiatives. In 2026, Baidu focuses strategically on expanding its cloud capabilities and growing its short-video platform Haokan, reinforcing its integrated digital ecosystem in Beijing’s competitive tech landscape.
Snap Inc.: Visual Communication Innovator
Snap leads as a camera and social media platform primarily in North America and Europe. Its revenue engine revolves around Snapchat’s advertising products and innovative AR ads. In 2026, Snap prioritizes enhancing user engagement through new visual communication features and expanding its Spectacles eyewear, driving immersive experiences in the U.S.-based digital social sphere.
Strategic Collision: Similarities & Divergences
Baidu embraces a closed ecosystem, integrating search, video, and cloud services tightly within China’s market. Snap operates an open platform focused on visual communication and AR innovation globally. Their primary battleground lies in digital advertising and user engagement. Baidu’s scale and AI depth contrast with Snap’s niche in augmented reality, shaping distinct risk and growth profiles for investors.
Income Statement Comparison
This data dissects the core profitability and scalability of both corporate engines to reveal who dominates the bottom line:
| Metric | Baidu, Inc. (BIDU) | Snap Inc. (SNAP) |
|---|---|---|
| Revenue | 133.1B CNY | 5.36B USD |
| Cost of Revenue | 66.1B CNY | 2.47B USD |
| Operating Expenses | 45.8B CNY | 3.67B USD |
| Gross Profit | 67.0B CNY | 2.89B USD |
| EBITDA | 46.1B CNY | -493M USD |
| EBIT | 31.4B CNY | -651M USD |
| Interest Expense | 2.82B CNY | 21.6M USD |
| Net Income | 23.8B CNY | -698M USD |
| EPS | 66.48 CNY | -0.42 USD |
| Fiscal Year | 2024 | 2024 |
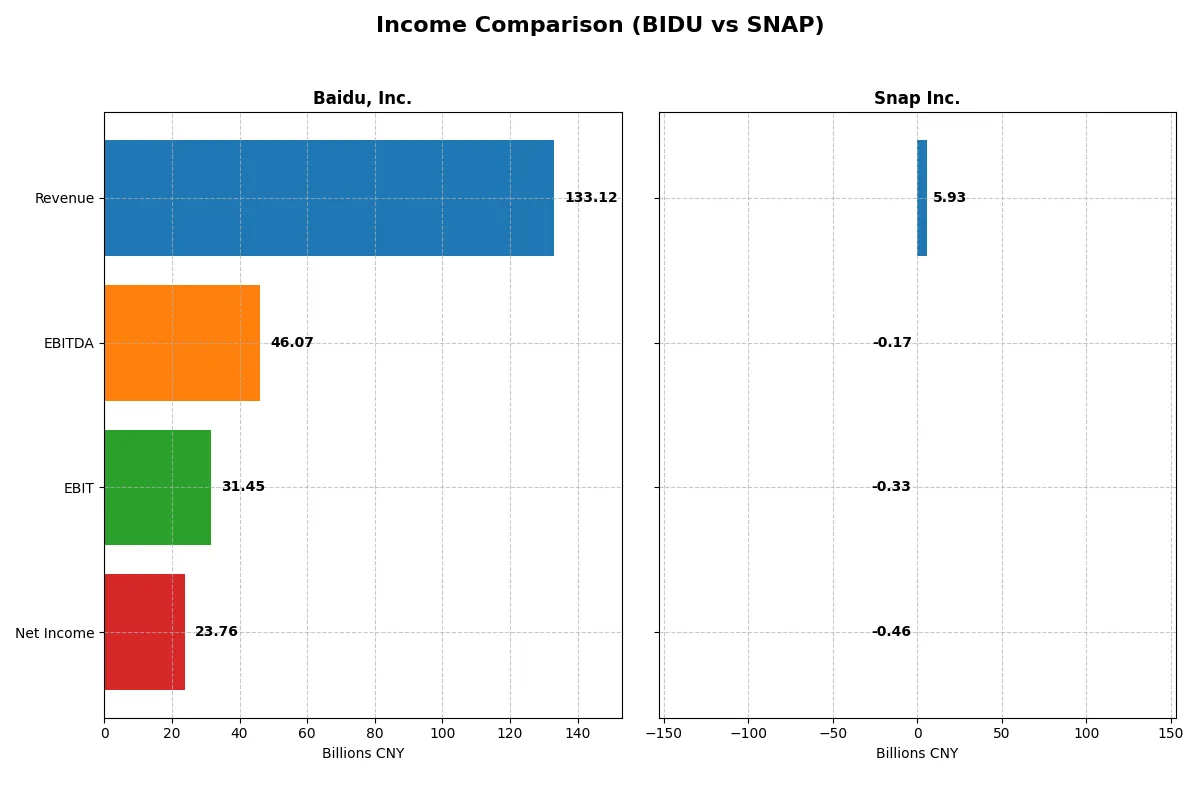
Income Statement Analysis: The Bottom-Line Duel
This income statement comparison reveals which company delivers superior operational efficiency and bottom-line strength.
Baidu, Inc. Analysis
Baidu’s revenue edged down slightly by 1.1% in 2024 to 133B CNY, while net income grew 17.9% to 23.8B CNY. The gross margin remained robust at 50.4%, signaling strong cost control. Its net margin climbed to 17.9%, reflecting improved profitability and disciplined expense management despite a modest revenue dip.
Snap Inc. Analysis
Snap’s revenue rose 10.6% to $5.93B in 2025, with net losses narrowing significantly to -$460M. The company boasts a solid gross margin of 55%, but EBIT and net margins remain negative at -5.6% and -7.8%, respectively. Snap’s improving margins and expanding top line show momentum but still lack consistent profitability.
Margin Reliability vs. Growth Momentum
Baidu sustains stronger margins and positive net income growth, demonstrating operational efficiency and profitability. Snap exhibits faster revenue and margin improvements but remains unprofitable. For investors prioritizing stable earnings, Baidu’s proven margin reliability stands out over Snap’s high-growth yet loss-making profile.
Financial Ratios Comparison
These vital ratios act as a diagnostic tool to expose the underlying fiscal health, valuation premiums, and capital efficiency of the companies compared below:
| Ratios | Baidu, Inc. (BIDU) | Snap Inc. (SNAP) |
|---|---|---|
| ROE | 9.0% | -20.2% |
| ROIC | 4.9% | -8.2% |
| P/E | 9.0 | -30.0 |
| P/B | 0.81 | 6.05 |
| Current Ratio | 2.09 | 3.56 |
| Quick Ratio | 2.01 | 3.56 |
| D/E | 0.30 | 2.06 |
| Debt-to-Assets | 18.5% | 61.2% |
| Interest Coverage | 7.53 | -5.98 |
| Asset Turnover | 0.31 | 0.77 |
| Fixed Asset Turnover | 3.25 | 5.47 |
| Payout ratio | 0 | 0 |
| Dividend yield | 0 | 0 |
| Fiscal Year | 2024 | 2025 |
Efficiency & Valuation Duel: The Vital Signs
Financial ratios act as a company’s DNA, uncovering hidden risks and operational strengths that shape investment decisions.
Baidu, Inc.
Baidu posts a solid net margin of 17.85%, signaling profitability, though ROE at 9.01% lags. Its P/E ratio of 9.03 implies the stock trades at a discount, supported by a low P/B of 0.81. Baidu refrains from dividends, focusing on reinvesting in R&D to sustain growth, reflecting strategic capital allocation.
Snap Inc.
Snap shows negative profitability metrics, with a net margin of -7.76% and ROE at -20.18%, indicating operational losses. Despite a negative P/E, the stock’s P/B ratio of 6.05 suggests a stretched valuation. Snap returns value through growth investments, allocating heavily to R&D, but faces substantial debt and weak interest coverage, raising caution.
Profitability and Valuation: Stability vs. Growth Risks
Baidu offers a more balanced risk-reward profile with attractive valuation and operational efficiency. Snap’s high valuation amid persistent losses and leverage signals elevated risk. Investors seeking stability may favor Baidu, while those targeting aggressive growth must weigh Snap’s financial challenges carefully.
Which one offers the Superior Shareholder Reward?
I observe that Baidu, Inc. (BIDU) and Snap Inc. (SNAP) both forgo dividends, focusing on reinvestment and buybacks. Baidu’s free cash flow per share stands at 37.6CNY with a strong free cash flow coverage of 62%, allowing consistent buybacks to reward shareholders. Snap, despite negative net margins, delivers a modest free cash flow per share of $0.26 with a 67% free cash flow conversion, supporting limited buybacks amid heavy leverage. Baidu’s lower debt-to-equity (0.30 vs. Snap’s 2.06) and stable operating margins signal a more sustainable distribution model. I conclude Baidu offers superior total shareholder return potential in 2026 due to its balanced capital allocation and financial resilience.
Comparative Score Analysis: The Strategic Profile
The radar chart reveals the fundamental DNA and trade-offs of Baidu, Inc. and Snap Inc., illustrating their financial strengths and vulnerabilities side by side:
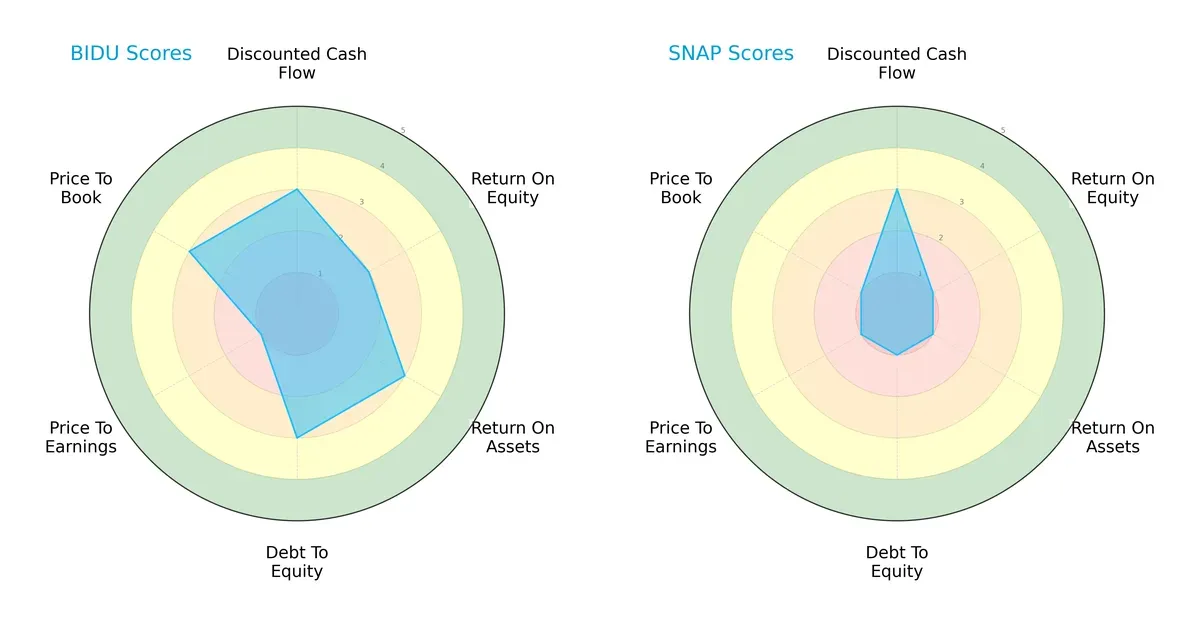
Baidu shows a more balanced profile with moderate scores in DCF, ROA, and debt-to-equity, but weak ROE and valuation metrics. Snap relies heavily on its moderate DCF score but struggles across profitability and leverage scores, reflecting a less stable financial standing.
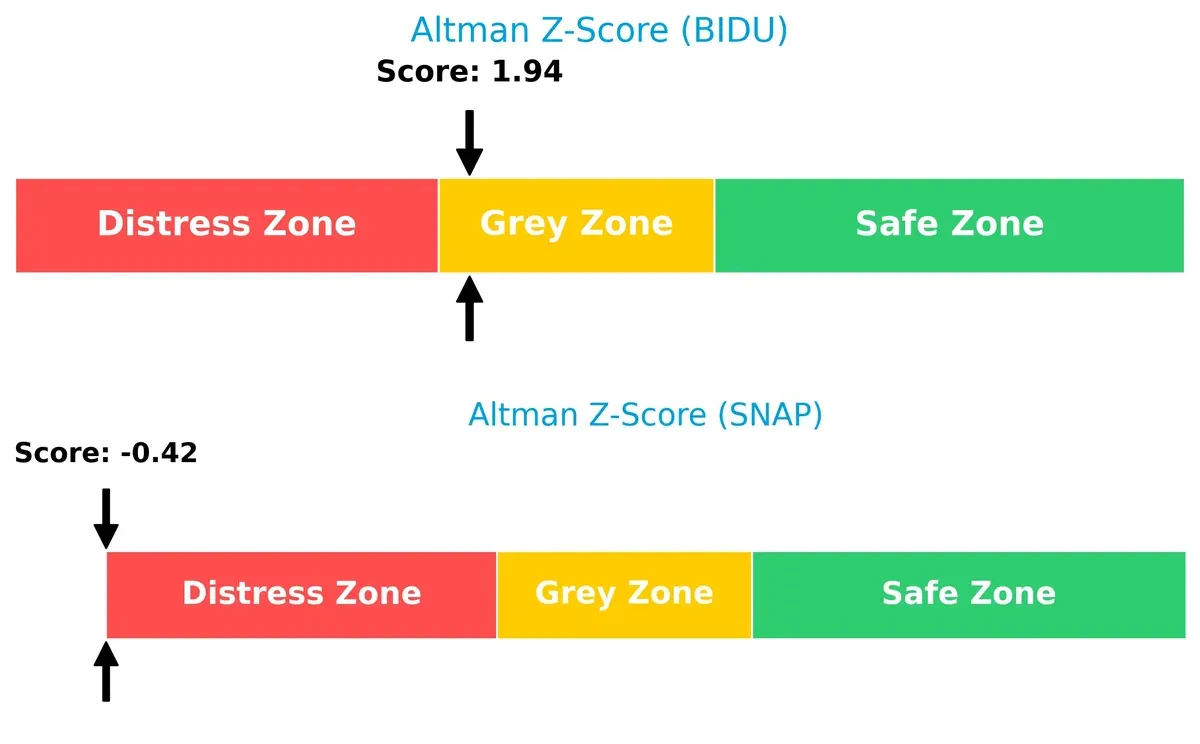
Bankruptcy Risk: Solvency Showdown
Baidu’s Altman Z-Score of 1.94 places it in the grey zone, indicating moderate bankruptcy risk, while Snap’s -0.42 signals distress, suggesting a much higher risk of insolvency in this cycle:
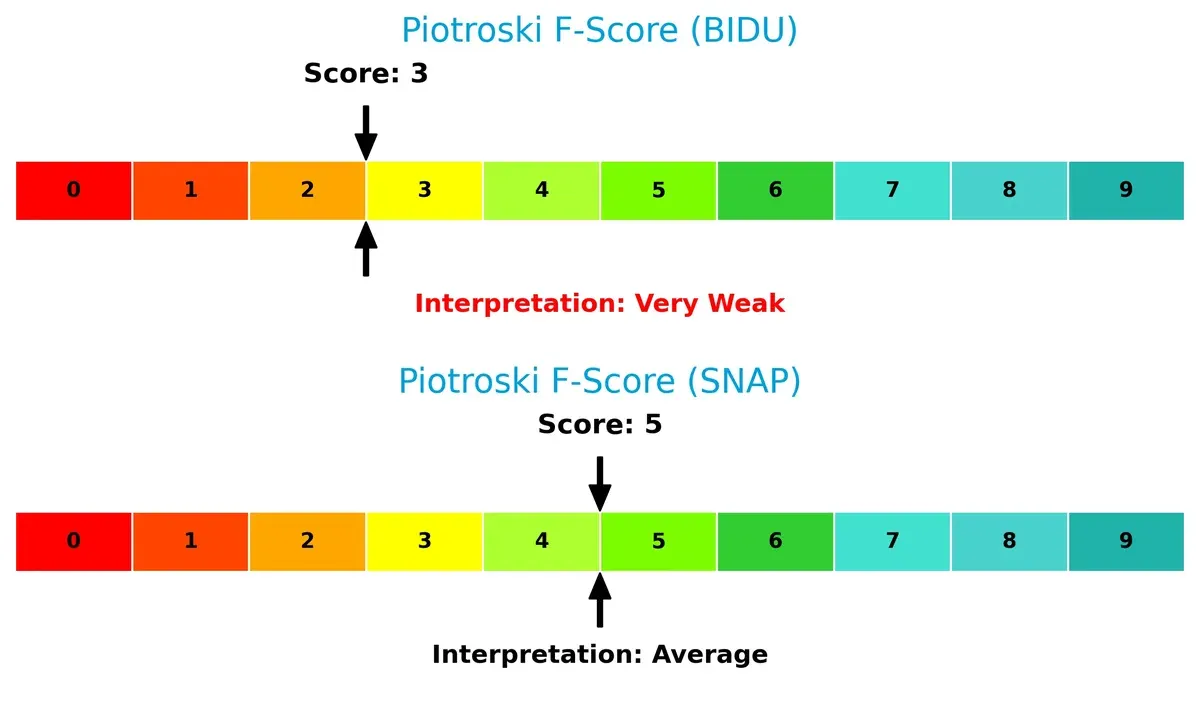
Financial Health: Quality of Operations
Snap’s Piotroski F-Score of 5 shows average financial health, outperforming Baidu’s very weak score of 3. This signals Baidu may have red flags internally, whereas Snap maintains moderately stronger operational quality:
How are the two companies positioned?
This section dissects Baidu and Snap’s operational DNA by comparing their revenue distribution and internal dynamics. The goal is to confront their economic moats and identify which model delivers the most resilient competitive advantage today.
Revenue Segmentation: The Strategic Mix
This visual comparison dissects how Baidu, Inc. and Snap Inc. diversify their income streams and reveals where their primary sector bets lie:
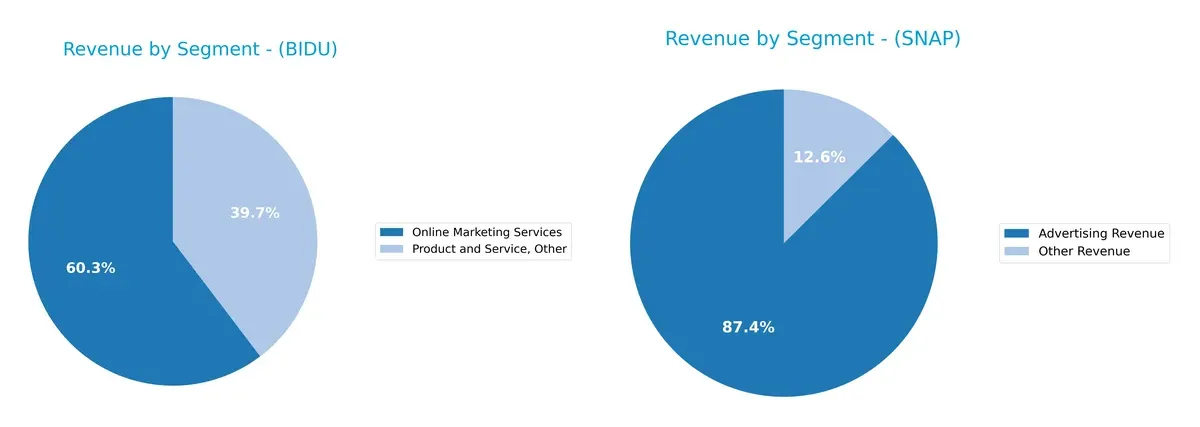
Baidu anchors its revenue in Online Marketing Services with 81B CNY, complemented by 53B CNY from Product and Service, Other. This mix shows moderate diversification but heavy reliance on marketing services. Snap pivots mainly on Advertising Revenue, generating 5.2B USD, with a smaller 745M USD from Other Revenue. Baidu’s model suggests ecosystem lock-in in digital marketing, while Snap’s concentration signals higher exposure to advertising cyclicality and platform risk.
Strengths and Weaknesses Comparison
This table compares the Strengths and Weaknesses of Baidu, Inc. and Snap Inc.:
Baidu Strengths
- Strong online marketing revenue base
- Favorable net margin of 17.85%
- Low debt levels with debt-to-assets at 18.54%
- Solid liquidity with current ratio above 2.0
- Favorable WACC at 4.78% supports capital efficiency
- Significant presence in China’s digital ad market
Snap Strengths
- Expanding global footprint across North America, Europe, and Rest of World
- Favorable WACC at 6.23% indicates manageable capital costs
- Quick ratio at 3.56 signals strong short-term liquidity
- Increasing fixed asset turnover at 5.47 shows asset use efficiency
- Growing advertising revenue with geographic diversification
- Emerging innovation potential in social media platform
Baidu Weaknesses
- Unfavorable ROE at 9.01% and ROIC at 4.87% suggests weaker capital returns
- Low asset turnover at 0.31 indicates less efficient asset use
- No dividend yield limits income investors’ appeal
- Heavy reliance on China market limits global diversification
- Moderate market share concentration in online marketing
- Unfavorable quick ratio despite liquidity strength
Snap Weaknesses
- Negative net margin at -7.76% reflects ongoing losses
- Negative ROE and ROIC, indicating poor capital allocation
- High debt-to-equity of 2.06 and debt-to-assets at 61.23% increase financial risk
- Negative interest coverage ratio signals debt servicing challenges
- High PB ratio at 6.05 may indicate overvaluation
- No dividend yield and unfavorable profitability metrics
Baidu’s strengths lie in profitability and financial stability, backed by a dominant China market presence. Snap shows promise in global expansion and asset use but faces significant profitability and leverage issues. Both must address these weaknesses to sustain long-term competitive positioning.
The Moat Duel: Analyzing Competitive Defensibility
A structural moat alone shields long-term profits from relentless competitive erosion in the digital content and communication sectors:
Baidu, Inc.: Data Network Effects and AI Innovation
Baidu leverages massive user data and AI-driven search algorithms to maintain high ROIC and margin stability. Its growing profitability signals a deepening moat amid AI product expansion in 2026.
Snap Inc.: User Engagement and Platform Ecosystem
Snap’s moat hinges on strong user engagement and innovative AR ad formats, though its negative ROIC vs. WACC warns of value destruction. Yet, improving profitability and expanding ad tech offer growth opportunities.
Network Effects vs. Engagement Ecosystem: Who Defends Better?
Baidu’s slightly favorable moat benefits from robust data network effects and profitable AI integration. Snap, despite rising profitability, still sheds value. Baidu is better positioned to defend market share in 2026.
Which stock offers better returns?
Over the past year, Baidu, Inc. rallied sharply with accelerating gains, while Snap Inc. declined markedly with decelerating losses, reflecting sharply contrasting trading dynamics.
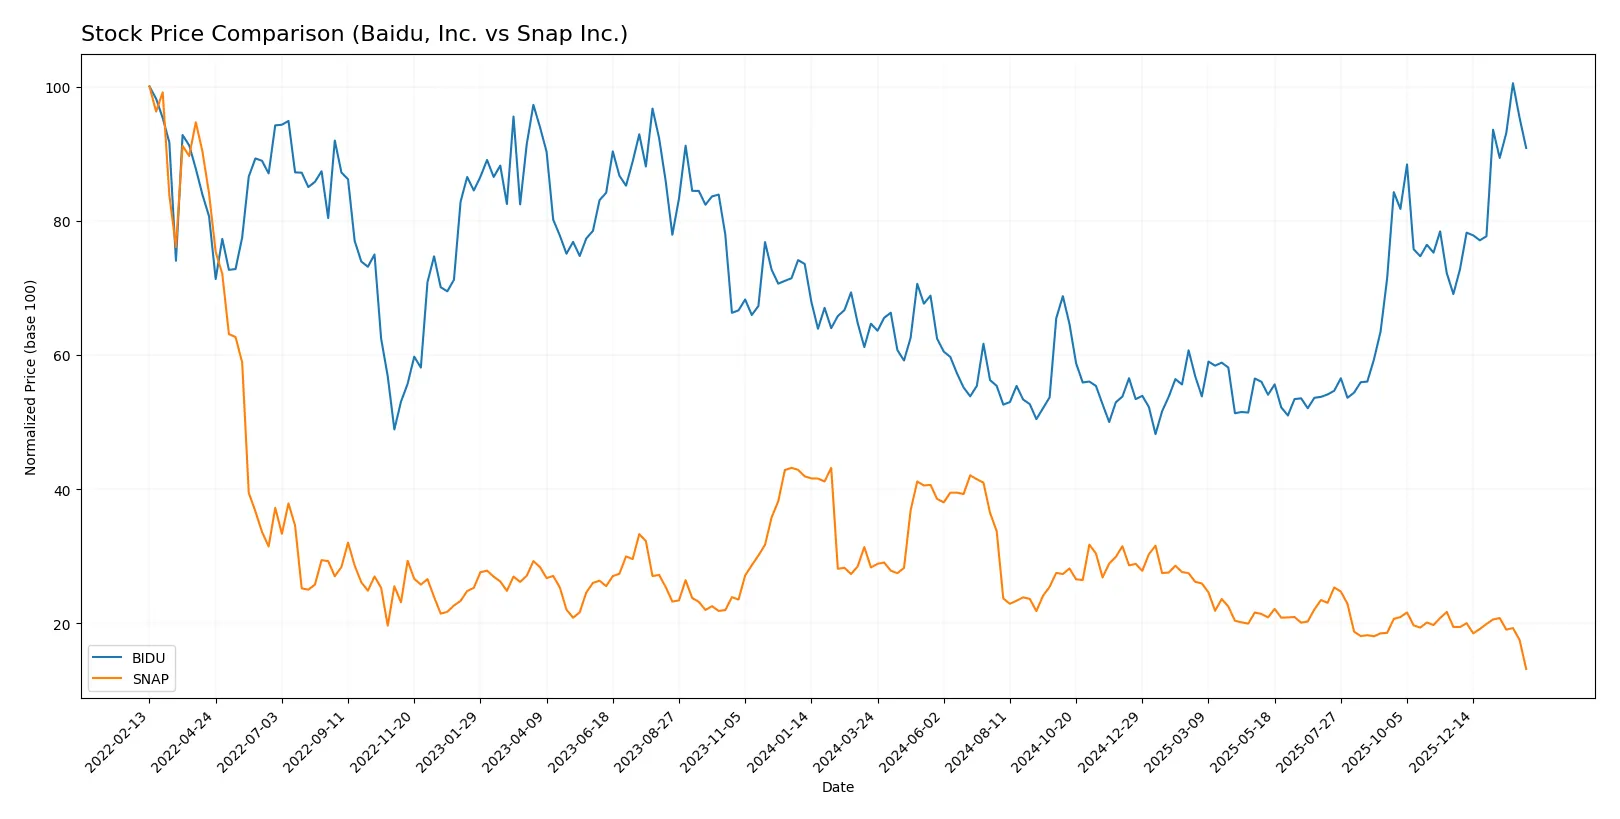
Trend Comparison
Baidu’s stock gained 40.51% over the last 12 months, showing a bullish trend with price acceleration and a high volatility of 19.07%. The stock hit a peak of 161.44 and a low of 77.43.
Snap’s stock fell 53.35% over the same period, reflecting a bearish trend with deceleration and low volatility at 2.64%. It recorded a high of 16.61 and a low of 5.22.
Comparing both, Baidu delivered the highest market performance, outperforming Snap by a wide margin in price appreciation and trend strength.
Target Prices
Analysts present a cautiously optimistic consensus on Baidu, Inc. and Snap Inc., with target prices reflecting potential upside from current levels.
| Company | Target Low | Target High | Consensus |
|---|---|---|---|
| Baidu, Inc. | 110 | 215 | 158.55 |
| Snap Inc. | 5.5 | 9.5 | 7.69 |
Baidu’s consensus target implies a roughly 9% upside from $146, signaling moderate growth expectations. Snap’s target sits about 47% above its $5.22 price, indicating higher volatility and potential reward.

Don’t Let Luck Decide Your Entry Point
Optimize your entry points with our advanced ProRealTime indicators. You’ll get efficient buy signals with precise price targets for maximum performance. Start outperforming now!
How do institutions grade them?
Here is a comparison of recent institutional grades for Baidu, Inc. and Snap Inc.:
Baidu, Inc. Grades
The table below shows Baidu’s latest grades from prominent financial institutions.
| Grading Company | Action | New Grade | Date |
|---|---|---|---|
| Barclays | Maintain | Equal Weight | 2026-01-26 |
| Freedom Capital Markets | Maintain | Buy | 2026-01-07 |
| Jefferies | Maintain | Buy | 2026-01-02 |
| JP Morgan | Upgrade | Overweight | 2025-11-24 |
| Goldman Sachs | Maintain | Buy | 2025-11-19 |
| Benchmark | Maintain | Buy | 2025-11-19 |
| B of A Securities | Maintain | Buy | 2025-11-19 |
| Morgan Stanley | Maintain | Equal Weight | 2025-11-19 |
| Barclays | Maintain | Equal Weight | 2025-11-19 |
| Macquarie | Upgrade | Outperform | 2025-10-10 |
Snap Inc. Grades
Below are Snap’s recent institutional grades from established grading firms.
| Grading Company | Action | New Grade | Date |
|---|---|---|---|
| Stifel | Upgrade | Hold | 2026-02-06 |
| B. Riley Securities | Upgrade | Buy | 2026-02-05 |
| Citizens | Maintain | Market Perform | 2026-02-05 |
| Mizuho | Maintain | Neutral | 2026-02-05 |
| Susquehanna | Maintain | Neutral | 2026-02-05 |
| UBS | Maintain | Neutral | 2026-02-05 |
| TD Cowen | Maintain | Hold | 2026-02-05 |
| JP Morgan | Maintain | Underweight | 2026-02-05 |
| Wells Fargo | Maintain | Equal Weight | 2026-02-05 |
| Rosenblatt | Maintain | Neutral | 2026-02-05 |
Which company has the best grades?
Baidu, Inc. holds more Buy and Outperform ratings, signaling stronger analyst confidence. Snap’s grades are mostly Neutral or Hold, with fewer upgrades. Investors might interpret Baidu’s better grades as reflecting a more favorable outlook.
Risks specific to each company
The following categories identify the critical pressure points and systemic threats facing both firms in the 2026 market environment:
1. Market & Competition
Baidu, Inc.
- Dominates Chinese internet search and AI markets but faces intense domestic regulation and fierce competition from Tencent and Alibaba.
Snap Inc.
- Competes globally in social media and AR, struggling with slowing user growth and fierce rivalry from Meta and TikTok.
2. Capital Structure & Debt
Baidu, Inc.
- Maintains low debt-to-equity ratio (0.3) and strong interest coverage (11.14), indicating financial prudence.
Snap Inc.
- High debt-to-equity ratio (2.06) and negative interest coverage (-3.7) reveal elevated financial risk and liquidity concerns.
3. Stock Volatility
Baidu, Inc.
- Low beta (0.29) signals defensive stock behavior, attractive in volatile markets.
Snap Inc.
- Higher beta (0.80) reflects greater price swings, increasing risk for risk-averse investors.
4. Regulatory & Legal
Baidu, Inc.
- Faces significant regulatory scrutiny in China, including data security and content controls.
Snap Inc.
- Subject to US privacy and advertising regulations; less intense but evolving legal risks.
5. Supply Chain & Operations
Baidu, Inc.
- Operations concentrated in China, vulnerable to local supply chain disruptions but benefits from scale economies.
Snap Inc.
- Global supply chain exposure for hardware (Spectacles) adds complexity and operational risk.
6. ESG & Climate Transition
Baidu, Inc.
- Faces pressure to improve environmental and social governance amid China’s tightening ESG regulations.
Snap Inc.
- Increasing ESG focus in US markets challenges Snap to enhance sustainability and social responsibility efforts.
7. Geopolitical Exposure
Baidu, Inc.
- High exposure to China-US tensions, risking market access and technology restrictions.
Snap Inc.
- US-based but with global user base, exposed to international geopolitical uncertainties and trade policies.
Which company shows a better risk-adjusted profile?
Baidu’s most impactful risk is regulatory pressure within China, which could constrain growth but its strong capital structure cushions financial shocks. Snap’s severe financial weakness, demonstrated by high leverage and negative profitability, is its greatest threat. Baidu presents a markedly better risk-adjusted profile, supported by low volatility, favorable debt metrics, and a defensive market position. Snap’s distress-zone Altman Z-score and elevated beta underscore its precarious financial and market stance.
Final Verdict: Which stock to choose?
Baidu’s superpower lies in its operational resilience and improving profitability amid a challenging sector. Its expanding return on invested capital signals emerging value creation. The main point of vigilance is its moderate asset turnover, which may limit growth speed. It suits portfolios aiming for steady growth with a tilt toward Asian tech exposure.
Snap’s strength is its strategic moat built on innovative user engagement and rapid revenue growth. Despite current losses, its improving operating metrics and strong cash position offer a cushion against volatility. Compared to Baidu, Snap presents higher risk but also potential for outsized gains. It fits well in Growth at a Reasonable Price (GARP) portfolios with a tolerance for tech disruption.
If you prioritize stable value creation and operational efficiency, Baidu outshines as the compelling choice due to its improving fundamentals and defensive market positioning. However, if you seek aggressive growth with a focus on innovation and user expansion, Snap offers superior upside potential despite its current financial headwinds. Both present distinct analytical scenarios tailored to differing risk appetites and investment horizons.
Disclaimer: Investment carries a risk of loss of initial capital. The past performance is not a reliable indicator of future results. Be sure to understand risks before making an investment decision.
Go Further
I encourage you to read the complete analyses of Baidu, Inc. and Snap Inc. to enhance your investment decisions: