Home > Comparison > Technology > META vs BIDU
The strategic rivalry between Meta Platforms, Inc. and Baidu, Inc. shapes the evolution of the internet content and communication services sectors. Meta dominates as a global technology leader with diversified social media and virtual reality platforms. Baidu operates as a China-centric communication services provider focused on online marketing and AI-driven cloud solutions. This analysis will weigh their distinct growth trajectories to identify the superior risk-adjusted investment opportunity for a diversified portfolio.

Table of contents
Companies Overview
Meta Platforms and Baidu dominate distinct spheres in the global internet content sector, shaping digital interactions worldwide.
Meta Platforms, Inc.: Global Social Connectivity Powerhouse
Meta Platforms, Inc. leads as a technology giant focusing on social networking and immersive experiences. It generates revenue primarily through its Family of Apps, including Facebook, Instagram, Messenger, and WhatsApp, which monetize social engagement and advertising. In 2026, Meta emphasizes expanding Reality Labs, investing heavily in augmented and virtual reality to sustain its competitive advantage in next-gen connectivity.
Baidu, Inc.: China’s Internet Marketing and AI Innovator
Baidu holds a commanding position in China’s internet content industry, specializing in online marketing and cloud services. Its core revenue stream comes from Baidu Core’s search and feed-based advertising, alongside AI-powered products. Baidu’s strategic focus in 2026 centers on advancing AI initiatives and strengthening its iQIYI entertainment platform to enhance user engagement and monetization in a competitive domestic market.
Strategic Collision: Similarities & Divergences
Both companies excel in digital content but diverge in approach: Meta builds a closed ecosystem blending social media and immersive tech, while Baidu pursues an AI-driven open platform tailored to Chinese consumers. Their primary battleground lies in capturing advertising dollars amid evolving user behaviors. Meta’s scale and innovation contrast with Baidu’s regional specialization and AI focus, creating distinct investment profiles shaped by global reach versus localized dominance.
Income Statement Comparison
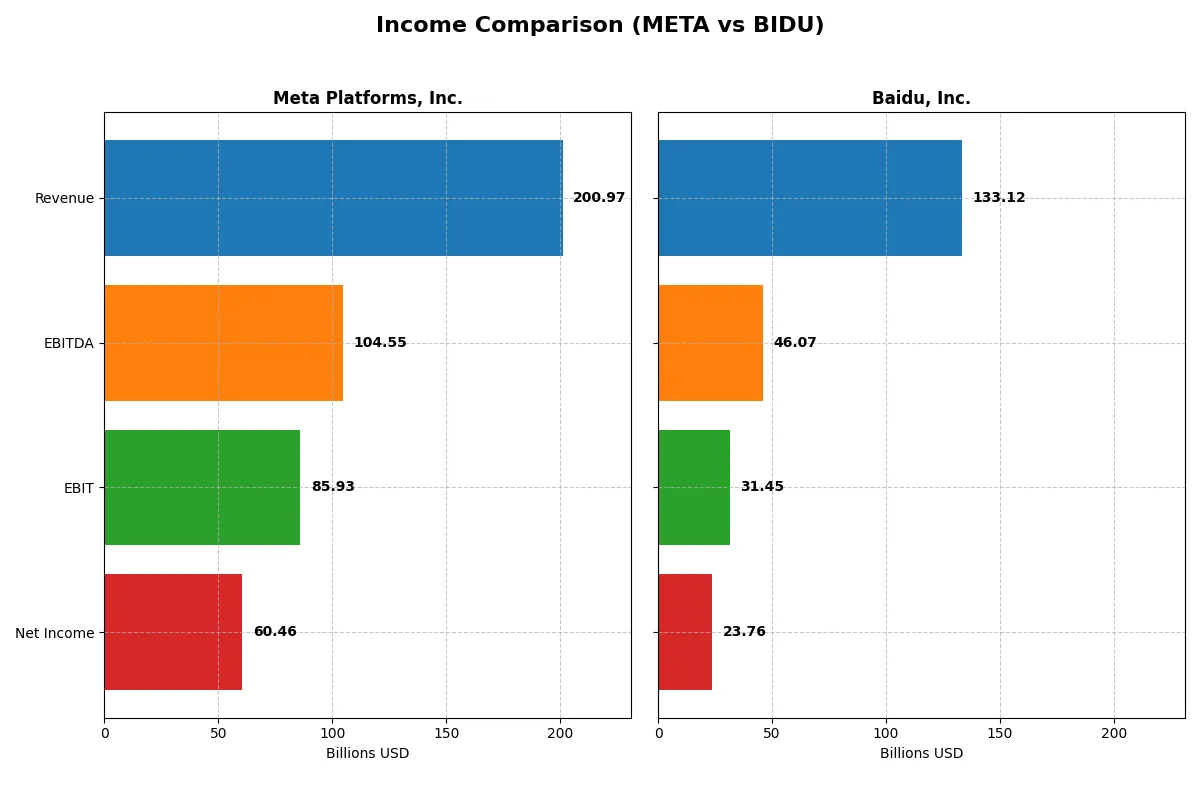
The table below dissects the core profitability and scalability of both corporate engines to reveal who dominates the bottom line in their latest fiscal year:
| Metric | Meta Platforms, Inc. (META) | Baidu, Inc. (BIDU) |
|---|---|---|
| Revenue | 201B USD | 133B CNY |
| Cost of Revenue | 36.2B USD | 66.1B CNY |
| Operating Expenses | 81.5B USD | 45.8B CNY |
| Gross Profit | 165B USD | 67.0B CNY |
| EBITDA | 104.5B USD | 46.1B CNY |
| EBIT | 85.9B USD | 31.4B CNY |
| Interest Expense | 0 USD | 2.8B CNY |
| Net Income | 60.5B USD | 23.8B CNY |
| EPS | 23.98 USD | 66.48 CNY |
| Fiscal Year | 2025 | 2024 |
Income Statement Analysis: The Bottom-Line Duel
This income statement comparison reveals which company drives greater efficiency and profitability in their core business operations.
Meta Platforms, Inc. Analysis
Meta’s revenue surged 22% to 201B USD in 2025, lifting gross profit to 165B USD with an impressive 82% gross margin. Net income reached 60.5B USD, although net margin slightly contracted to 30.1%. Despite rising operating expenses, Meta sustains robust earnings momentum fueled by strong scale and operational leverage.
Baidu, Inc. Analysis
Baidu’s revenue dipped 1.1% to 133B CNY in 2024, dragging gross profit down 3.7% to 67B CNY and compressing its 50% gross margin. Net income improved 17.9% to 23.8B CNY, lifting net margin to 17.9% amid effective cost control. Baidu shows earnings resilience, though growth momentum lags compared to peers.
Margin Dominance vs. Earnings Resilience
Meta clearly dominates with superior revenue growth and a far stronger 82% gross margin versus Baidu’s 50%. Meta’s net income nearly triples Baidu’s in absolute terms, reflecting its scale and efficiency. Baidu’s steady net income growth suggests operational discipline but lacks Meta’s growth dynamism. Investors seeking robust margin power find Meta more compelling, while Baidu appeals to those favoring measured earnings stability.
Financial Ratios Comparison
These vital ratios act as a diagnostic tool to expose the underlying fiscal health, valuation premiums, and capital efficiency of the companies compared below:
| Ratios | Meta Platforms, Inc. (META) | Baidu, Inc. (BIDU) |
|---|---|---|
| ROE | 27.8% | 9.0% |
| ROIC | 18.0% | 4.9% |
| P/E | 27.5 | 9.0 |
| P/B | 7.7 | 0.81 |
| Current Ratio | 2.60 | 2.09 |
| Quick Ratio | 2.60 | 2.01 |
| D/E | 0.39 | 0.30 |
| Debt-to-Assets | 23% | 19% |
| Interest Coverage | 97.0 | 7.5 |
| Asset Turnover | 0.55 | 0.31 |
| Fixed Asset Turnover | 1.02 | 3.25 |
| Payout ratio | 8.8% | 0% |
| Dividend yield | 0.32% | 0% |
| Fiscal Year | 2025 | 2024 |
Efficiency & Valuation Duel: The Vital Signs
Financial ratios serve as a company’s DNA, exposing hidden risks and operational strengths that shape investor decisions.
Meta Platforms, Inc.
Meta exhibits robust profitability with a 27.8% ROE and a strong 30.1% net margin, signaling operational excellence. Its valuation appears stretched with a high P/E of 27.5 and P/B of 7.7. Shareholders receive a modest 0.32% dividend yield, reflecting a focus on reinvestment in growth and R&D.
Baidu, Inc.
Baidu shows moderate profitability, posting a 9.0% ROE and a 17.9% net margin. Its valuation looks attractive with a low P/E of 9.0 and P/B of 0.81, indicating potential undervaluation. The company pays no dividends, emphasizing reinvestment into operations and strategic expansion.
Premium Valuation vs. Operational Efficiency
Meta commands a premium valuation justified by strong profitability and reinvestment strategy. Baidu offers better valuation metrics but trails in returns. Investors seeking operational strength may prefer Meta, while value-focused investors might lean toward Baidu’s lower multiples.
Which one offers the Superior Shareholder Reward?
I compare Meta and Baidu’s shareholder rewards focusing on dividends, payout ratios, and buybacks. Meta yields 0.32% with a low 8.8% payout ratio, signaling ample FCF coverage and sustainable payouts. Baidu pays no dividend, reinvesting heavily in growth. Meta’s buybacks are aggressive, enhancing total returns versus Baidu’s modest buyback activity. Historically, Meta’s capital allocation balances shareholder returns and innovation better. I see Meta offering a superior total return profile in 2026 due to its sustainable dividend plus intense buybacks, while Baidu prioritizes reinvestment with less immediate shareholder reward.
Comparative Score Analysis: The Strategic Profile
The radar chart reveals the fundamental DNA and trade-offs of Meta Platforms, Inc. and Baidu, Inc., highlighting their core financial strengths and weaknesses:
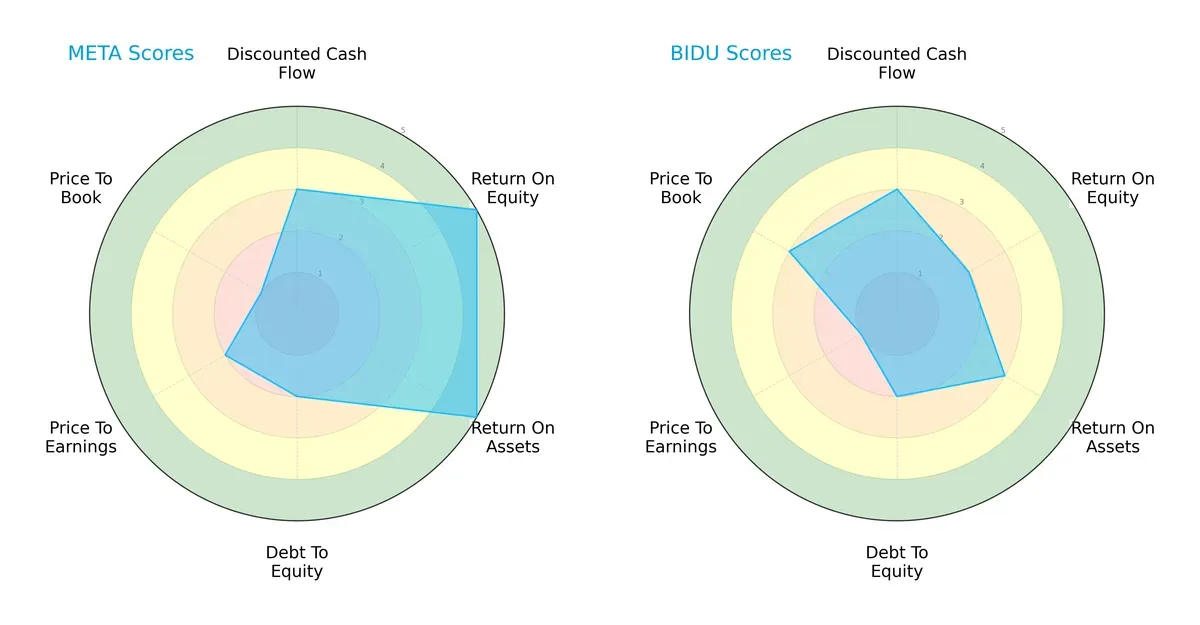
Meta shows a balanced profile with very favorable returns on equity (5) and assets (5), while Baidu lags with moderate scores (ROE 2, ROA 3). Both share moderate discounted cash flow (3) and debt-to-equity scores (2). Meta’s valuation metrics (P/E 2, P/B 1) indicate potential overvaluation, whereas Baidu’s price-to-book score (3) is more moderate, signaling relative undervaluation. Meta leverages operational efficiency; Baidu relies on valuation attractiveness.
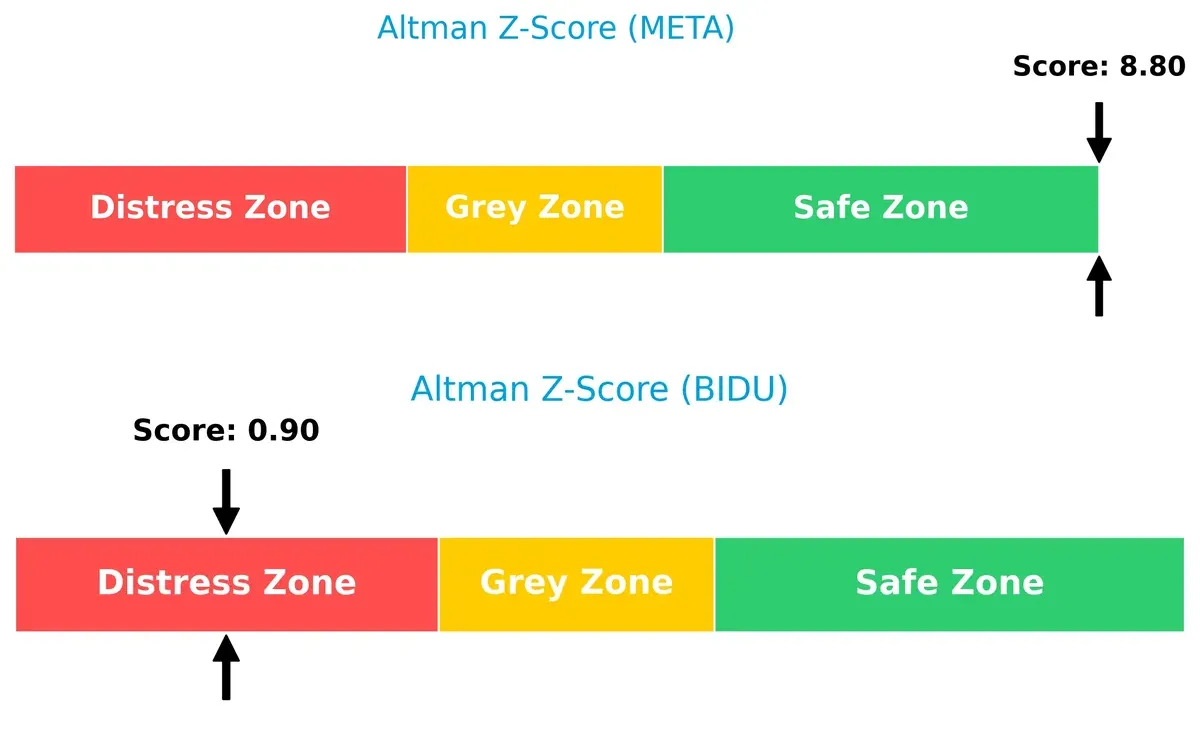
Bankruptcy Risk: Solvency Showdown
Meta’s Altman Z-Score of 8.8 signals a very strong safety margin, contrasting sharply with Baidu’s 0.9 distress zone score. This gulf implies Meta’s superior resilience and lower bankruptcy risk in volatile markets:
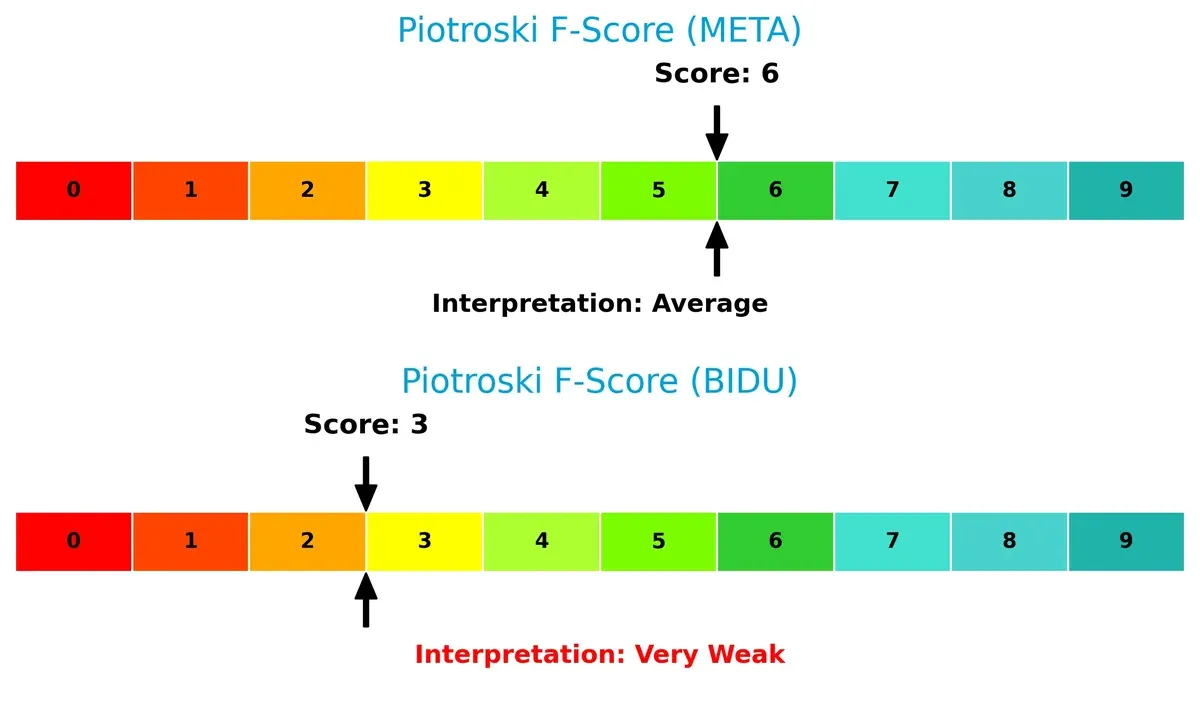
Financial Health: Quality of Operations
Meta scores a solid 6 on the Piotroski F-Score, reflecting average but stable financial health. Baidu’s weak 3 signals red flags in operational efficiency and profitability, raising caution for investors:
How are the two companies positioned?
This section dissects Meta and Baidu’s operational DNA by comparing their revenue distribution and internal strengths and weaknesses. The goal is to confront their economic moats to identify which model offers the most resilient competitive advantage today.
Revenue Segmentation: The Strategic Mix
The following visual comparison dissects how Meta Platforms, Inc. and Baidu, Inc. diversify their income streams and where their primary sector bets lie:
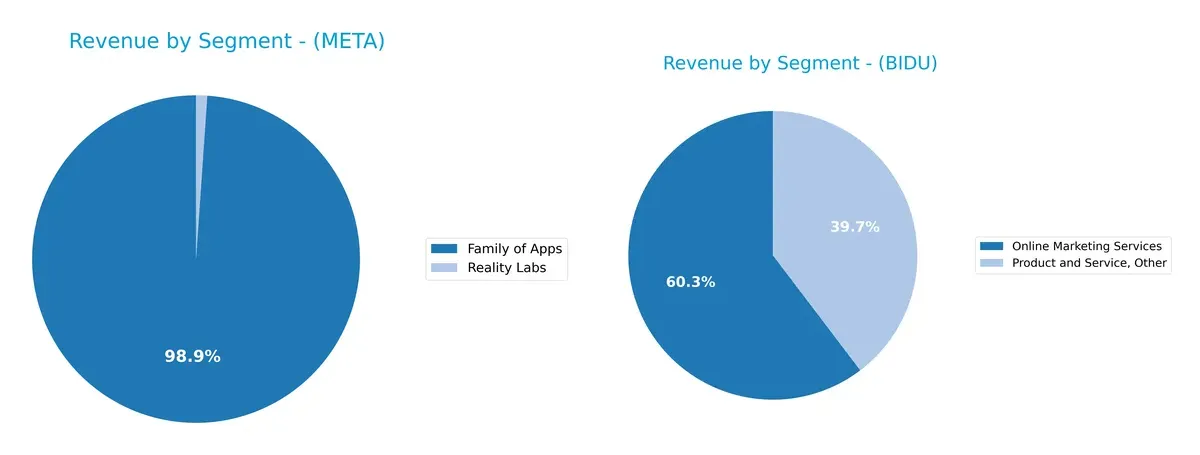
Meta’s revenue pivots heavily on its Family of Apps, generating $199B in 2025, dwarfing its Reality Labs’ $2.2B. Baidu shows a more balanced split with Online Marketing Services at 81B CNY and Product and Service, Other at 53B CNY in 2023. Meta’s concentration signals dominance in social advertising but exposes it to ad market cyclicality. Baidu’s mix suggests broader ecosystem lock-in, reducing single-segment risk.
Strengths and Weaknesses Comparison
This table compares the Strengths and Weaknesses of Meta Platforms, Inc. and Baidu, Inc.:
Meta Strengths
- High net margin at 30.08%
- Strong ROE of 27.83%
- Robust ROIC of 17.95%
- Solid current and quick ratios at 2.6
- Low debt-to-equity of 0.39
- Diversified global revenue across US, Europe, Asia Pacific
Baidu Strengths
- Favorable net margin at 17.85%
- Low price-to-earnings ratio at 9.03
- Strong price-to-book at 0.81
- Healthy current ratio of 2.09
- Low debt-to-equity of 0.3
- High fixed asset turnover at 3.25
Meta Weaknesses
- Unfavorable high PE of 27.52
- Elevated PB ratio at 7.66
- Low dividend yield at 0.32%
- Neutral asset turnover at 0.55
- Neutral fixed asset turnover at 1.02
- Heavy reliance on Family of Apps revenue
Baidu Weaknesses
- Low ROE of 9.01%
- Weak ROIC at 4.87%
- Zero dividend yield
- Unfavorable asset turnover at 0.31
- Higher unfavorable ratios at 28.57%
- Geographic concentration primarily in China
Meta demonstrates superior profitability and global diversification but faces valuation concerns and product concentration risks. Baidu shows attractive valuation and asset efficiency but struggles with lower profitability and geographic concentration. These factors shape each company’s strategic focus on innovation, market expansion, and financial management.
The Moat Duel: Analyzing Competitive Defensibility
A structural moat is the only reliable shield protecting long-term profits from relentless competition erosion. Let’s examine how it applies to these tech giants:
Meta Platforms, Inc.: Network Effects Powerhouse
Meta’s primary moat comes from its massive network effects across Facebook, Instagram, and WhatsApp. This translates into high ROIC and stable gross margins above 80%. However, its declining ROIC trend signals caution as new privacy regulations and emerging platforms could pressure its dominance in 2026.
Baidu, Inc.: AI-Driven Market Penetration
Baidu’s moat centers on AI technology and strong positioning in China’s search and cloud markets. Unlike Meta’s global network lock-in, Baidu leverages growing ROIC and expanding AI services to drive incremental value. Its improving profitability and innovation pipeline suggest potential moat deepening despite geopolitical risks.
Network Effects vs. AI Innovation: A Moat Clash
Meta’s wider moat stems from entrenched global user bases and diversified revenue streams. Baidu shows a narrower but potentially deepening moat fueled by AI and regional dominance. Meta remains better positioned to defend market share, but Baidu’s rising ROIC trend demands attention for future disruption.
Which stock offers better returns?
Over the past year, both Meta Platforms and Baidu demonstrated strong price appreciation with accelerating bullish trends, but their trading volumes and price volatilities diverged notably.
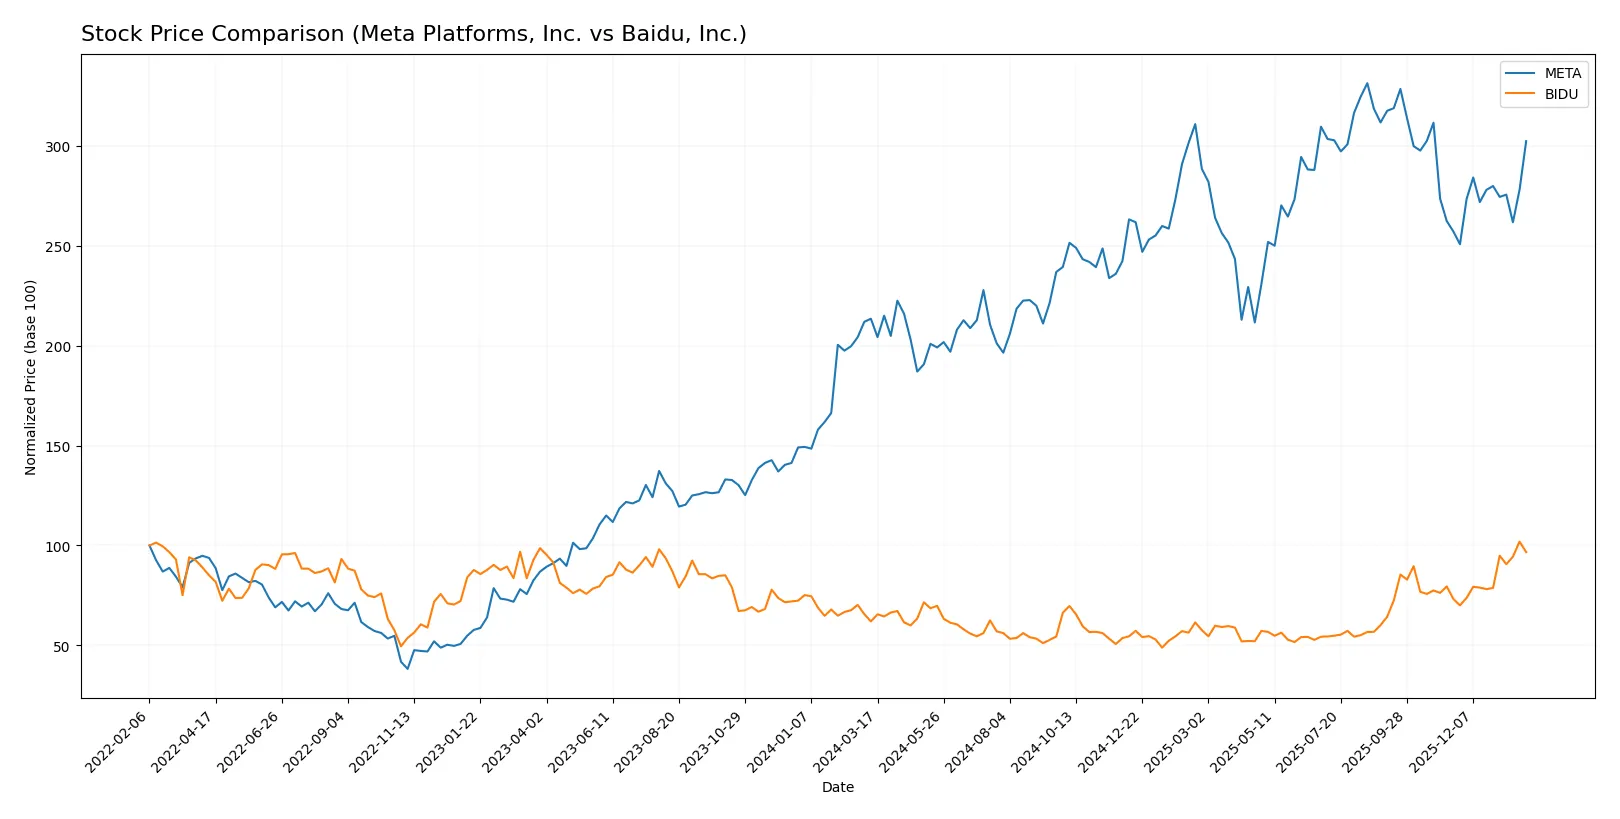
Trend Comparison
Meta Platforms’ stock price rose 41.61% over the past 12 months, reflecting a bullish trend with acceleration. It showed high volatility, ranging from 443.29 to 785.23, and volume trends declined overall.
Baidu’s stock price increased 55.88% over the past 12 months, also bullish with acceleration. It had lower volatility than Meta and an increasing volume trend, despite slight seller dominance recently.
Baidu outperformed Meta in total price appreciation during the year. However, Meta’s higher volatility and buyer dominance suggest different risk and momentum profiles.
Target Prices
Analysts present a bullish consensus for both Meta Platforms, Inc. and Baidu, Inc., signaling potential upside from current prices.
| Company | Target Low | Target High | Consensus |
|---|---|---|---|
| Meta Platforms, Inc. | 700 | 1,117 | 853 |
| Baidu, Inc. | 110 | 215 | 159.4 |
Meta’s consensus target sits about 19% above its current price of 716.5, reflecting strong growth expectations. Baidu’s target consensus is 4% above its current price of 153.18, indicating moderate upside potential.

Don’t Let Luck Decide Your Entry Point
Optimize your entry points with our advanced ProRealTime indicators. You’ll get efficient buy signals with precise price targets for maximum performance. Start outperforming now!
How do institutions grade them?
Meta Platforms, Inc. Grades
The following table summarizes recent institutional grades for Meta Platforms, Inc.:
| Grading Company | Action | New Grade | Date |
|---|---|---|---|
| Cantor Fitzgerald | Maintain | Overweight | 2024-09-30 |
| Monness, Crespi, Hardt | Maintain | Buy | 2024-09-30 |
| Baird | Maintain | Outperform | 2024-09-26 |
| JMP Securities | Maintain | Market Outperform | 2024-09-26 |
| B of A Securities | Maintain | Buy | 2024-09-26 |
| Rosenblatt | Maintain | Buy | 2024-09-26 |
| Wedbush | Maintain | Outperform | 2024-09-26 |
| JP Morgan | Maintain | Overweight | 2024-09-26 |
| Cantor Fitzgerald | Maintain | Overweight | 2024-09-23 |
| Citigroup | Maintain | Buy | 2024-09-23 |
Baidu, Inc. Grades
The following table summarizes recent institutional grades for Baidu, Inc.:
| Grading Company | Action | New Grade | Date |
|---|---|---|---|
| Barclays | Maintain | Equal Weight | 2026-01-26 |
| Freedom Capital Markets | Maintain | Buy | 2026-01-07 |
| Jefferies | Maintain | Buy | 2026-01-02 |
| JP Morgan | Upgrade | Overweight | 2025-11-24 |
| Morgan Stanley | Maintain | Equal Weight | 2025-11-19 |
| Goldman Sachs | Maintain | Buy | 2025-11-19 |
| B of A Securities | Maintain | Buy | 2025-11-19 |
| Benchmark | Maintain | Buy | 2025-11-19 |
| Barclays | Maintain | Equal Weight | 2025-11-19 |
| Macquarie | Upgrade | Outperform | 2025-10-10 |
Which company has the best grades?
Meta Platforms consistently receives strong buy and outperform ratings from top-tier firms, signaling robust confidence. Baidu shows a mix of buy and equal weight grades with some recent upgrades. Meta’s consistently higher grades could imply stronger institutional conviction and potential investor confidence.
Risks specific to each company
The following categories identify the critical pressure points and systemic threats facing both firms in the 2026 market environment:
1. Market & Competition
Meta Platforms, Inc.
- Faces fierce competition in global social media and VR markets from established and emerging players.
Baidu, Inc.
- Dominates Chinese search and AI markets but contends with intense regulatory scrutiny and domestic rivals.
2. Capital Structure & Debt
Meta Platforms, Inc.
- Maintains a conservative debt-to-equity ratio (0.39) with strong interest coverage, reducing financial risk.
Baidu, Inc.
- Shows moderate leverage (0.30 debt-to-equity) but lower returns on invested capital, indicating less efficient capital use.
3. Stock Volatility
Meta Platforms, Inc.
- Exhibits higher beta (1.29), implying greater sensitivity to market swings and investor sentiment.
Baidu, Inc.
- Presents low beta (0.29), suggesting relative stability but potential sensitivity to China-specific risks.
4. Regulatory & Legal
Meta Platforms, Inc.
- Faces global privacy laws and antitrust investigations that could constrain growth and increase compliance costs.
Baidu, Inc.
- Confronts stringent Chinese government controls, censorship, and policy shifts impacting operations and profitability.
5. Supply Chain & Operations
Meta Platforms, Inc.
- Relies on complex global supply chains for hardware; geopolitical tensions could disrupt component sourcing.
Baidu, Inc.
- Operates primarily within China, reducing global supply risks but exposing it to domestic operational constraints.
6. ESG & Climate Transition
Meta Platforms, Inc.
- Invests heavily in sustainability initiatives but faces scrutiny over data privacy and platform content.
Baidu, Inc.
- ESG efforts are evolving, but less transparency and regulatory pressure could pose future risks.
7. Geopolitical Exposure
Meta Platforms, Inc.
- Global operations expose it to US-China trade tensions and international policy shifts.
Baidu, Inc.
- Primarily exposed to Chinese geopolitical risks but insulated from broader global conflicts.
Which company shows a better risk-adjusted profile?
Meta’s primary risk lies in regulatory challenges and stock volatility, while Baidu’s biggest threat is financial distress risk and weaker profitability metrics. Meta’s Altman Z-Score of 8.8 signals strong financial stability, whereas Baidu’s 0.9 places it in distress territory. Despite Meta’s higher market risk, its superior capital efficiency and balance sheet strength offer a better risk-adjusted profile in 2026. Baidu’s low ROE and Piotroski score reflect operational strain, justifying caution.
Final Verdict: Which stock to choose?
Meta Platforms, Inc. wields unmatched efficiency in capital allocation, consistently generating high returns above its cost of capital. Its profitability remains strong despite a recent dip in ROIC, signaling a point of vigilance. Meta fits well in aggressive growth portfolios that can tolerate some margin pressure.
Baidu, Inc. offers a strategic moat rooted in a compelling valuation and steady improvement in profitability. Its lower leverage and reasonable price multiples provide a more conservative safety profile compared to Meta. Baidu suits GARP investors seeking growth with a margin of valuation comfort.
If you prioritize robust capital efficiency and are comfortable with elevated valuation multiples, Meta outshines as the compelling choice due to its scale and innovation strength. However, if you seek better stability and valuation discipline in a growth name, Baidu offers superior risk-adjusted potential grounded in a recovering moat.
Disclaimer: Investment carries a risk of loss of initial capital. The past performance is not a reliable indicator of future results. Be sure to understand risks before making an investment decision.
Go Further
I encourage you to read the complete analyses of Meta Platforms, Inc. and Baidu, Inc. to enhance your investment decisions: