In today’s dynamic Aerospace & Defense sector, TransDigm Group Incorporated (TDG) and Axon Enterprise, Inc. (AXON) stand out for their innovative approaches and market presence. While TransDigm specializes in aircraft components, Axon leads in conducted energy devices and digital law enforcement solutions, creating an intriguing comparison of industrial innovation and market strategies. This article will help you decide which company offers the most compelling investment opportunity in 2026.
Table of contents
Companies Overview
I will begin the comparison between TransDigm Group Incorporated and Axon Enterprise, Inc. by providing an overview of these two companies and their main differences.
TransDigm Group Incorporated Overview
TransDigm Group Incorporated designs, produces, and supplies aircraft components worldwide, focusing on aerospace and defense. Its product range spans mechanical actuators, ignition systems, and cargo handling systems to cockpit security and interior components. Serving airlines, military agencies, and maintenance suppliers, TransDigm operates multiple segments including Power & Control and Airframe, emphasizing engineered solutions for aviation and non-aviation markets.
Axon Enterprise, Inc. Overview
Axon Enterprise, Inc. develops and sells conducted energy devices under the TASER brand and offers hardware and cloud-based software solutions for law enforcement. Its products include TASER devices, body cameras, in-car systems, and digital evidence management software. Axon’s business model integrates physical and digital solutions to enhance public safety, supported by partnerships to advance real-time crime center capabilities.
Key similarities and differences
Both TransDigm and Axon operate in the aerospace and defense sector, supplying specialized equipment to government and commercial clients. However, TransDigm focuses on aircraft components and related mechanical systems, while Axon emphasizes law enforcement technology combining hardware and software. TransDigm has a broader industrial product scope, contrasting with Axon’s niche in public safety and digital evidence solutions.
Income Statement Comparison
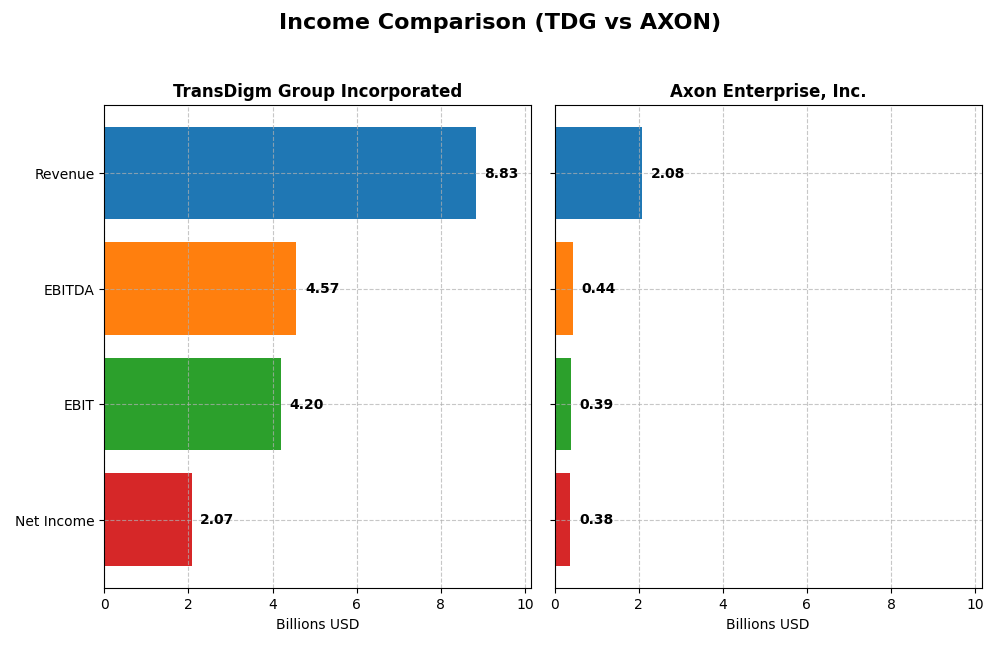
The table below compares key income statement metrics for TransDigm Group Incorporated and Axon Enterprise, Inc. for their most recent fiscal years, providing a snapshot of their financial performance.
| Metric | TransDigm Group Incorporated (TDG) | Axon Enterprise, Inc. (AXON) |
|---|---|---|
| Market Cap | 77.6B | 48.4B |
| Revenue | 8.83B | 2.08B |
| EBITDA | 4.57B | 437M |
| EBIT | 4.20B | 389M |
| Net Income | 2.07B | 377M |
| EPS | 32.08 | 4.98 |
| Fiscal Year | 2025 | 2024 |
Income Statement Interpretations
TransDigm Group Incorporated
TransDigm has shown strong revenue growth from $4.8B in 2021 to $8.8B in 2025, with net income rising substantially from $680M to $2.07B. Margins remain robust and stable, with a gross margin of 60.14% and net margin at 23.49% in 2025. The latest year saw favorable growth in revenue, EBIT, and earnings per share, indicating improving profitability and operational efficiency.
Axon Enterprise, Inc.
Axon’s revenue increased significantly from $863M in 2021 to $2.08B in 2024, alongside a net income surge from a loss of $60M to a profit of $377M. Margins improved notably, with a gross margin of 59.61% and net margin of 18.1% in 2024. The most recent year delivered strong growth across revenue, EBIT, net margin, and EPS, despite an unfavorable rise in operating expenses relative to revenue.
Which one has the stronger fundamentals?
Both companies demonstrate favorable income statement trends with high gross margins and improving net income. TransDigm excels in scale and consistent margin expansion, though it faces relatively high interest expenses. Axon shows impressive growth rates and margin recovery from prior losses, with minimal interest burden but less scale. The fundamentals favor both, with distinctive strengths in profitability for TransDigm and growth dynamics for Axon.
Financial Ratios Comparison
The following table presents a side-by-side comparison of key financial ratios for TransDigm Group Incorporated (TDG) and Axon Enterprise, Inc. (AXON) based on their most recent fiscal year data.
| Ratios | TransDigm Group Incorporated (TDG) | Axon Enterprise, Inc. (AXON) |
|---|---|---|
| ROE | -21.4% | 16.2% |
| ROIC | 15.2% | 1.7% |
| P/E | 37.0 | 119.4 |
| P/B | -7.9 | 19.3 |
| Current Ratio | 3.21 | 1.37 |
| Quick Ratio | 2.25 | 1.21 |
| D/E | -3.10 | 0.60 |
| Debt-to-Assets | 131.1% | 31.3% |
| Interest Coverage | 2.65 | 8.25 |
| Asset Turnover | 0.39 | 0.47 |
| Fixed Asset Turnover | 5.59 | 8.42 |
| Payout Ratio | 4.64% | 0% |
| Dividend Yield | 12.6% | 0% |
Interpretation of the Ratios
TransDigm Group Incorporated
TransDigm shows a mixed ratio profile with strengths in net margin (23.49%), return on invested capital (15.22%), and weighted average cost of capital (7.02%), indicating efficient capital use and profitability. However, concerns arise from negative return on equity (-21.41%) and high debt to assets (131.08%), suggesting financial leverage risks. The company pays a substantial dividend with a 12.55% yield, supported by free cash flow, but the payout sustainability needs monitoring.
Axon Enterprise, Inc.
Axon presents favorable net margin (18.1%) and return on equity (16.2%), reflecting solid profitability and shareholder returns. Weaknesses include low return on invested capital (1.66%) and unfavorable valuation multiples like a high P/E (119.4) and price-to-book (19.34). Axon does not pay dividends, focusing on reinvestment and growth, which aligns with its high spending on R&D and software development.
Which one has the best ratios?
TransDigm’s ratios are slightly favorable overall, balancing profitability with financial risk, while Axon’s profile is slightly unfavorable due to high valuation and reinvestment costs despite decent profitability. TransDigm’s dividend yield and capital returns contrast with Axon’s growth focus and absence of dividends, making their ratio strengths context-dependent.
Strategic Positioning
This section compares the strategic positioning of TransDigm Group Incorporated and Axon Enterprise, Inc. including Market position, Key segments, and exposure to disruption:
TransDigm Group Incorporated
- Leading aerospace & defense supplier with diverse product range in aircraft components facing moderate competition.
- Key segments: Power & Control ($4.56B), Airframe ($4.11B), Non-aviation ($160M) driving broad industrial revenue streams.
- Exposure to technological disruption limited; operates in established aerospace component manufacturing with stable innovation pace.
Axon Enterprise, Inc.
- Specialized in conducted energy devices and law enforcement tech, operating in a niche market with competitive pressure.
- Key segments: Software and Sensors ($951M), TASER devices ($613M) focusing on hardware and cloud-based law enforcement solutions.
- Moderate exposure through software innovation and cloud solutions aiming to enhance law enforcement operational capabilities.
TransDigm Group Incorporated vs Axon Enterprise, Inc. Positioning
TransDigm shows a diversified industrial focus across aerospace and non-aviation markets with large-scale revenue drivers, while Axon concentrates on law enforcement technologies combining hardware and software. TransDigm’s broader segment mix contrasts with Axon’s specialized product portfolio.
Which has the best competitive advantage?
TransDigm demonstrates a very favorable moat with strong and growing ROIC above WACC, indicating durable competitive advantage. Axon’s moat is slightly unfavorable despite improving profitability, reflecting value destruction but positive ROIC trends.
Stock Comparison
The stock price chart illustrates significant bullish trends for both TransDigm Group Incorporated and Axon Enterprise, Inc. over the past year, with Axon showing a markedly higher overall gain despite recent downward pressure.

Trend Analysis
TransDigm Group Incorporated (TDG) exhibited a 20.15% price increase over the past 12 months, indicating a bullish trend with decelerating momentum. The stock traded between a low of 1146.39 and a high of 1607.45, with considerable volatility (std dev 89.71).
Axon Enterprise, Inc. (AXON) recorded a strong bullish trend with a 127.2% price increase over the past year but showed deceleration and recent weakness, dropping 16.71% from late October 2025 to January 2026. Volatility was higher at 175.35 std dev.
Comparing the two, Axon delivered the highest market performance over the year despite recent declines, while TransDigm maintained moderate gains with less pronounced recent volatility.
Target Prices
Analysts provide a clear consensus on target prices for TransDigm Group Incorporated and Axon Enterprise, Inc.
| Company | Target High | Target Low | Consensus |
|---|---|---|---|
| TransDigm Group Incorporated | 1660 | 1370 | 1506.17 |
| Axon Enterprise, Inc. | 900 | 713 | 814.78 |
The consensus target price for TransDigm suggests a modest upside potential compared to its current price of 1377.42 USD. Axon’s target consensus indicates a significant potential gain versus its present price of 612.98 USD.
Analyst Opinions Comparison
This section compares analysts’ ratings and grades for TransDigm Group Incorporated and Axon Enterprise, Inc.:
Rating Comparison
TDG Rating
- Rating: Both companies hold a C+ rating, considered very favorable.
- Discounted Cash Flow Score: Moderate score of 3, suggesting average valuation based on future cash flows.
- ROE Score: Very unfavorable score of 1, indicating poor efficiency in generating profit from equity.
- ROA Score: Very favorable score of 5, highlighting excellent asset utilization.
- Debt To Equity Score: Very unfavorable score of 1, indicating higher financial risk due to leverage.
- Overall Score: Moderate score of 2, summarizing a balanced but cautious financial standing.
AXON Rating
- Rating: Both companies hold a C+ rating, considered very favorable.
- Discounted Cash Flow Score: Moderate score of 3, indicating similar valuation assessment.
- ROE Score: Moderate score of 3, showing better efficiency in profit generation from equity.
- ROA Score: Moderate score of 3, reflecting average asset utilization efficiency.
- Debt To Equity Score: Moderate score of 2, showing relatively lower financial risk.
- Overall Score: Moderate score of 2, reflecting a comparable overall financial position.
Which one is the best rated?
Based strictly on the provided data, AXON has stronger financial efficiency with better ROE and ROA scores and a lower debt-to-equity risk compared to TDG. Both share the same overall rating and discounted cash flow score.
Scores Comparison
Here is a comparison of the Altman Z-Score and Piotroski Score for the two companies:
TDG Scores
- Altman Z-Score: 1.91, in the grey zone indicating moderate bankruptcy risk.
- Piotroski Score: 6, average financial strength suggesting moderate investment quality.
AXON Scores
- Altman Z-Score: 8.68, in the safe zone indicating low bankruptcy risk.
- Piotroski Score: 4, average financial strength suggesting moderate investment quality.
Which company has the best scores?
AXON has a significantly higher Altman Z-Score indicating stronger financial stability, though both companies have average Piotroski Scores. Overall, AXON’s scores reflect a safer financial profile based on the data provided.
Grades Comparison
Here is a detailed comparison of the latest grades and consensus ratings for TransDigm Group Incorporated and Axon Enterprise, Inc.:
TransDigm Group Incorporated Grades
The following table summarizes recent grades from major financial institutions for TransDigm Group Incorporated.
| Grading Company | Action | New Grade | Date |
|---|---|---|---|
| JP Morgan | Maintain | Neutral | 2025-11-14 |
| Morgan Stanley | Maintain | Overweight | 2025-11-14 |
| RBC Capital | Maintain | Sector Perform | 2025-11-13 |
| BMO Capital | Maintain | Outperform | 2025-11-13 |
| UBS | Maintain | Buy | 2025-11-13 |
| Stifel | Maintain | Buy | 2025-11-13 |
| Morgan Stanley | Maintain | Overweight | 2025-10-15 |
| Truist Securities | Maintain | Buy | 2025-10-15 |
| Susquehanna | Maintain | Neutral | 2025-10-09 |
| Jefferies | Maintain | Buy | 2025-09-17 |
Overall, TransDigm’s grades consistently range from Neutral to Buy and Outperform, indicating a stable to positive outlook by analysts.
Axon Enterprise, Inc. Grades
The following table displays recent grades from reputable financial firms for Axon Enterprise, Inc.
| Grading Company | Action | New Grade | Date |
|---|---|---|---|
| Morgan Stanley | Maintain | Overweight | 2025-12-17 |
| Barclays | Maintain | Overweight | 2025-11-06 |
| Piper Sandler | Maintain | Overweight | 2025-11-05 |
| UBS | Maintain | Neutral | 2025-11-05 |
| Goldman Sachs | Maintain | Buy | 2025-11-05 |
| JMP Securities | Maintain | Market Outperform | 2025-09-29 |
| Needham | Maintain | Buy | 2025-09-24 |
| B of A Securities | Maintain | Buy | 2025-08-06 |
| Northland Capital Markets | Maintain | Outperform | 2025-08-05 |
| Raymond James | Maintain | Outperform | 2025-08-05 |
Axon’s grades mostly range between Neutral and Buy, with several Outperform and Overweight ratings, reflecting a generally optimistic view.
Which company has the best grades?
Both companies carry a “Buy” consensus rating, but Axon Enterprise shows a stronger tendency towards Overweight and Outperform grades from multiple firms, suggesting a comparatively more favorable analyst sentiment. This could influence investor perception by highlighting Axon as the company with relatively more bullish support.
Strengths and Weaknesses
Below is a comparison of key strengths and weaknesses of TransDigm Group Incorporated (TDG) and Axon Enterprise, Inc. (AXON) based on recent financial performance, product diversification, and market positioning.
| Criterion | TransDigm Group Incorporated (TDG) | Axon Enterprise, Inc. (AXON) |
|---|---|---|
| Diversification | Highly diversified with strong segments in Airframe ($4.11B) and Power and Control ($4.56B), plus a smaller non-aviation segment ($160M) | Moderate diversification focused on Software and Sensors ($951M) and TASER products ($613M) |
| Profitability | Strong net margin at 23.49%, favorable ROIC of 15.22%, but negative ROE (-21.41%) | Favorable net margin (18.1%) and ROE (16.2%), but low ROIC (1.66%) below WACC (10.19%) |
| Innovation | Stable innovation supporting growing ROIC and durable economic moat | Improving innovation indicated by rapidly growing ROIC, though still value-destructive overall |
| Global presence | Large global aerospace supplier with durable competitive advantage | Growing presence in law enforcement technology, but less diversified globally |
| Market Share | Leading in aerospace components with increasing revenues | Strong in law enforcement tech with expanding software segment but high valuation pressures |
Key takeaway: TDG displays a robust and diversified business model with a durable economic moat and strong profitability, despite some concerns on ROE. AXON shows promising growth and innovation but currently destroys value relative to capital costs and faces valuation challenges. Investors should weigh TDG’s stability against AXON’s growth potential and risk profile.
Risk Analysis
Below is a comparison of key risks faced by TransDigm Group Incorporated (TDG) and Axon Enterprise, Inc. (AXON) for the most recent year:
| Metric | TransDigm Group Incorporated (TDG) | Axon Enterprise, Inc. (AXON) |
|---|---|---|
| Market Risk | Moderate beta of 0.92; aerospace sector sensitivity to defense budgets and economic cycles | Higher beta of 1.41; exposure to tech and law enforcement spending volatility |
| Debt level | High debt-to-assets at 131%, weak debt-to-equity score, interest coverage moderate (2.67x) | Moderate debt-to-assets at 31%, manageable debt-to-equity, strong interest coverage (54.75x) |
| Regulatory Risk | Defense contracting subject to government regulations and export controls | Subject to product safety, privacy laws, and law enforcement regulations |
| Operational Risk | Complex supply chains for aerospace components, dependence on military and commercial contracts | Reliance on innovation in conducted energy devices and software integration |
| Environmental Risk | Moderate, with aerospace manufacturing emissions and compliance requirements | Lower, but must manage electronic waste and data security risks |
| Geopolitical Risk | Exposure to international military contracts and trade policies | Moderate; impacts from global law enforcement partnerships and export restrictions |
TransDigm’s most impactful risks relate to its high leverage and aerospace market sensitivity, which could pressure financial stability despite favorable margins. Axon faces higher market volatility and regulatory scrutiny but benefits from strong interest coverage and a safer debt profile. Investors should weigh TransDigm’s financial leverage against Axon’s valuation challenges and sector-specific risks.
Which Stock to Choose?
TransDigm Group Incorporated (TDG) shows a favorable income evolution with strong revenue and net margin growth, supported by a very favorable MOAT rating indicating durable competitive advantage. Its financial ratios are slightly favorable overall, despite some concerns on debt and return on equity, and it holds a very favorable overall rating with moderate scores on key metrics.
Axon Enterprise, Inc. (AXON) exhibits robust income growth and profitability improvements, though its MOAT rating is slightly unfavorable due to value destruction despite growing profitability. AXON’s financial ratios are slightly unfavorable overall, with mixed debt and valuation metrics, while its rating is also very favorable but with moderate scores and a safe-zone Altman Z-score.
Investors focused on stability and durable competitive advantages might find TDG more appealing given its very favorable MOAT and income statement, while those prioritizing rapid growth and improving profitability could view AXON as a compelling, though riskier, opportunity given its strong income growth but less favorable MOAT and financial ratios.
Disclaimer: Investment carries a risk of loss of initial capital. The past performance is not a reliable indicator of future results. Be sure to understand risks before making an investment decision.
Go Further
I encourage you to read the complete analyses of TransDigm Group Incorporated and Axon Enterprise, Inc. to enhance your investment decisions: