Home > Comparison > Industrials > BA vs AXON
The strategic rivalry between The Boeing Company and Axon Enterprise, Inc. shapes the aerospace and defense sector’s evolution. Boeing operates as a capital-intensive industrial giant, spanning commercial airplanes and defense systems. In contrast, Axon focuses on high-margin, technology-driven law enforcement hardware and software solutions. This analysis pits Boeing’s scale against Axon’s innovation to identify which trajectory delivers superior risk-adjusted returns for diversified portfolios amid shifting market dynamics.
Table of contents
Companies Overview
The Boeing Company and Axon Enterprise, Inc. represent two critical players shaping aerospace and defense innovation.
The Boeing Company: Aerospace & Defense Giant
Boeing dominates the aerospace and defense sector with a diverse portfolio spanning commercial jetliners, military aircraft, satellites, and space systems. Its core revenue stems from manufacturing and servicing aircraft across four segments. In 2026, Boeing focuses strategically on advancing space exploration and modernizing defense systems to sustain its global leadership.
Axon Enterprise, Inc.: Law Enforcement Tech Innovator
Axon leads in developing conducted energy devices and digital evidence management solutions for law enforcement. Its revenue primarily comes from selling TASER devices and cloud-based software for video and data analysis. In 2026, Axon sharpens its strategic edge by expanding real-time crime center capabilities through cloud partnerships, enhancing law enforcement operational efficiency.
Strategic Collision: Similarities & Divergences
Boeing adopts a broad, integrated aerospace approach while Axon pursues a focused, tech-driven law enforcement niche. They compete indirectly on defense innovation but differ in scale and market scope. Boeing’s massive industrial footprint contrasts with Axon’s agile software-hardware ecosystem. Their distinct investment profiles reflect Boeing’s industrial capital intensity versus Axon’s growth-oriented technology model.
Income Statement Comparison
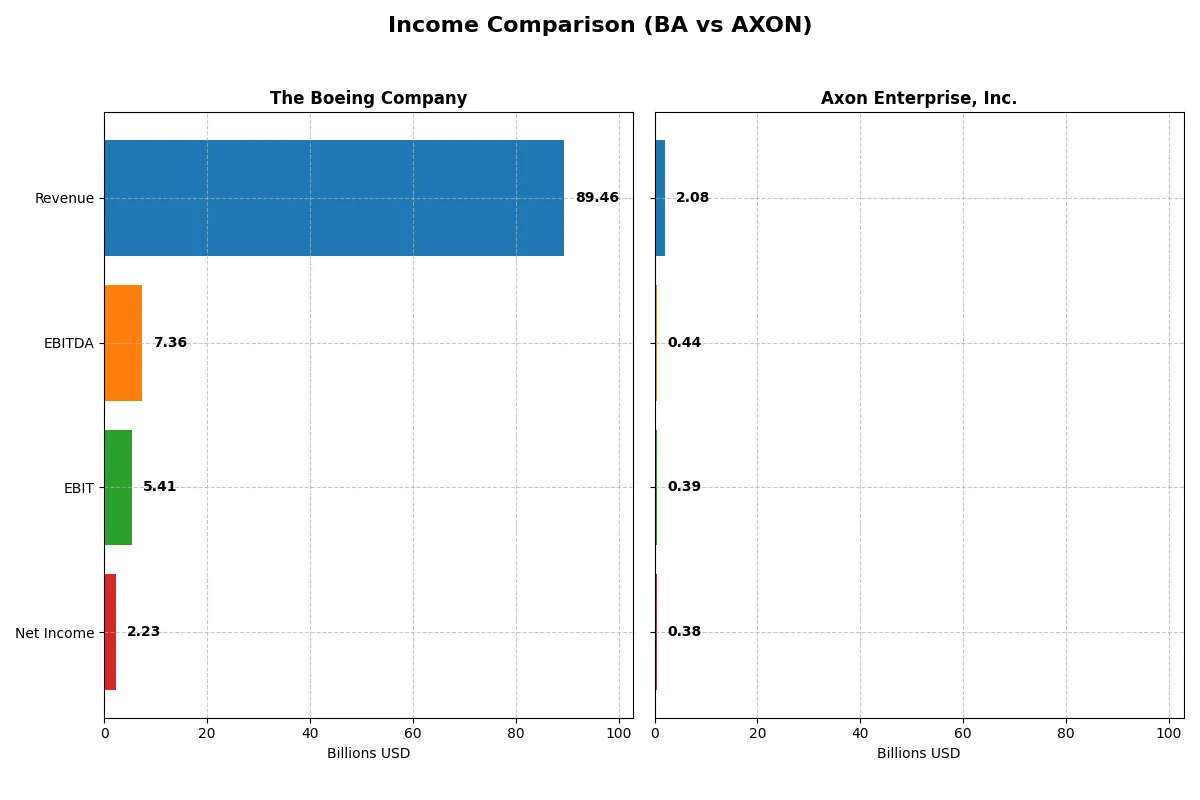
This data dissects the core profitability and scalability of both corporate engines to reveal who dominates the bottom line:
| Metric | The Boeing Company (BA) | Axon Enterprise, Inc. (AXON) |
|---|---|---|
| Revenue | 89.5B | 2.08B |
| Cost of Revenue | 85.2B | 841M |
| Operating Expenses | 9.71B | 1.18B |
| Gross Profit | 4.29B | 1.24B |
| EBITDA | 7.36B | 437M |
| EBIT | 5.41B | 389M |
| Interest Expense | 2.77B | 7.10M |
| Net Income | 2.24B | 377M |
| EPS | 2.49 | 4.98 |
| Fiscal Year | 2025 | 2024 |
Income Statement Analysis: The Bottom-Line Duel
This income statement comparison reveals which company runs a more efficient and profitable corporate engine in the recent market cycle.
The Boeing Company Analysis
Boeing’s revenue rose sharply to 89.5B in 2025, rebounding from losses in prior years. Net income swung positive at 2.2B, signaling a recovery in profitability. Gross margin at 4.8% and net margin at 2.5% remain thin but improved. Boeing’s 2025 momentum reflects better cost control and a favorable interest expense ratio of 3.1%.
Axon Enterprise, Inc. Analysis
Axon steadily grew revenue to 2.08B in 2024, up 33% year-over-year, while net income surged to 377M. Its gross margin of 59.6% and net margin of 18.1% demonstrate strong operational leverage. Despite an unfavorable rise in operating expenses relative to revenue, Axon maintains robust EBIT growth and expanding earnings per share, signaling sustained efficiency.
Margin Resilience vs. Growth Efficiency
Boeing’s recovery from losses to modest profitability contrasts with Axon’s consistently high margins and rapid earnings growth. Axon leads fundamentally with a superior margin profile and impressive net income expansion. Investors favoring growth and margin strength will find Axon’s profile more attractive, while Boeing’s rebound reflects a turnaround story with cautious optimism.
Financial Ratios Comparison
These vital ratios act as a diagnostic tool to expose the underlying fiscal health, valuation premiums, and capital efficiency of the companies compared below:
| Ratios | The Boeing Company (BA) | Axon Enterprise, Inc. (AXON) |
|---|---|---|
| ROE | 40.98% | 16.20% |
| ROIC | -6.71% | 1.66% |
| P/E | 74.05 | 119.40 |
| P/B | 30.35 | 19.34 |
| Current Ratio | 1.27 | 1.37 |
| Quick Ratio | 0.49 | 1.21 |
| D/E | 9.92 | 0.60 |
| Debt-to-Assets | 32.16% | 31.33% |
| Interest Coverage | -1.95 | 8.25 |
| Asset Turnover | 0.53 | 0.47 |
| Fixed Asset Turnover | 5.73 | 8.42 |
| Payout ratio | 14.81% | 0% |
| Dividend yield | 0.20% | 0% |
| Fiscal Year | 2025 | 2024 |
Efficiency & Valuation Duel: The Vital Signs
Ratios act as a company’s DNA, revealing hidden risks and operational excellence crucial for assessing investment potential.
The Boeing Company
Boeing posts a strong ROE of 41%, signaling robust shareholder profitability despite a low net margin of 2.5%. Its valuation appears stretched, with a high P/E of 74 and P/B of 30, reflecting market skepticism. Boeing offers a modest 0.2% dividend yield, suggesting limited shareholder returns amid reinvestment challenges.
Axon Enterprise, Inc.
Axon delivers a solid net margin of 18.1% and a respectable ROE of 16.2%, showing operational efficiency. However, its valuation is expensive, with a P/E of 119 and P/B of 19. Axon pays no dividend, instead prioritizing growth via heavy R&D, which accounts for 21% of revenue, indicating a focus on innovation.
Premium Valuation vs. Operational Safety
Boeing’s metrics highlight high profitability but significant valuation stretch and financial risks. Axon shows better margin quality and operational discipline but trades at an even higher premium. Investors seeking balance might lean towards Axon’s growth profile, while those prioritizing current returns may scrutinize Boeing’s subdued dividend and leverage.
Which one offers the Superior Shareholder Reward?
I compare Boeing and Axon’s shareholder rewards through dividend policies, payout ratios, and buyback intensity. Boeing yields a meager 0.2% dividend with a 14.8% payout ratio but suffers negative free cash flow (-2.5/share), raising sustainability concerns. Its buybacks are unclear but likely constrained by leverage (debt/equity near 10). Axon pays no dividend, instead reinvesting aggressively in growth, supported by strong margins and positive free cash flow ($4.35/share). Axon’s consistent buyback activity enhances returns while maintaining a moderate debt ratio (0.6 debt/equity). I find Axon’s reinvestment and buyback model offers a more sustainable and superior total shareholder reward in 2026.
Comparative Score Analysis: The Strategic Profile
The radar chart reveals the fundamental DNA and trade-offs of The Boeing Company and Axon Enterprise, Inc., highlighting their financial strengths and weaknesses:
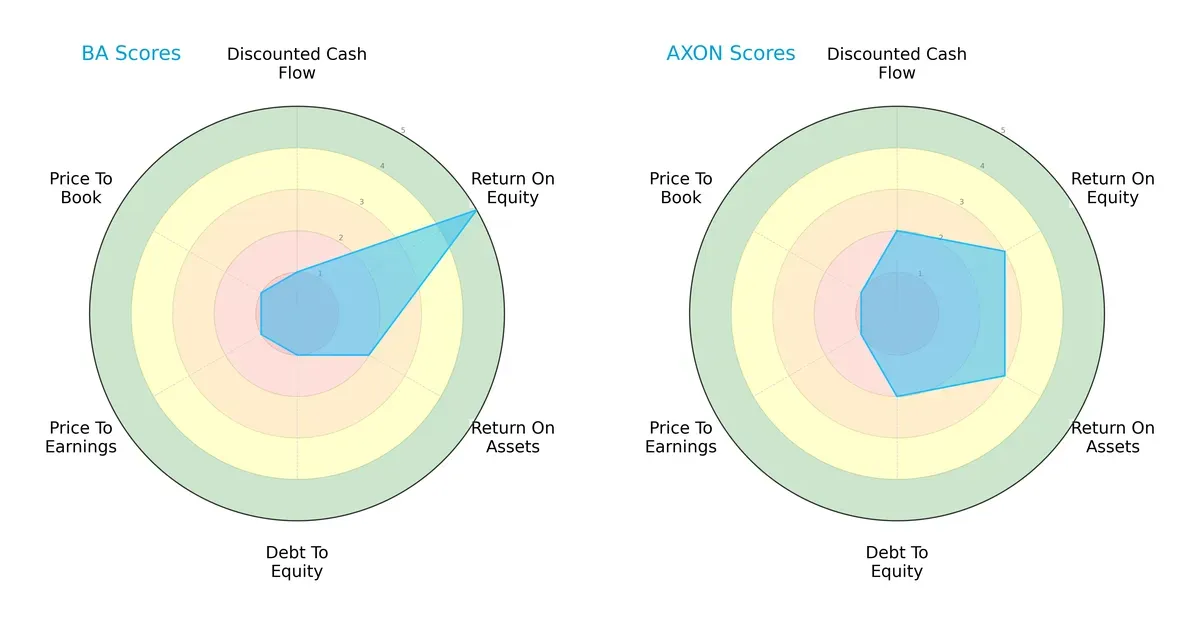
Boeing excels in Return on Equity (5) but suffers across discounted cash flow (1) and debt-to-equity (1), signaling financial risk. Axon displays a more balanced profile, scoring moderately in DCF (2), ROE (3), ROA (3), and debt-to-equity (2), though both firms share weak valuation scores (P/E and P/B at 1). Boeing relies heavily on equity efficiency but carries significant leverage concerns; Axon offers steadier financial footing without standout edges.
Bankruptcy Risk: Solvency Showdown
The Altman Z-Score gap between Boeing (1.67, distress zone) and Axon (9.17, safe zone) sharply illustrates differing bankruptcy risks:
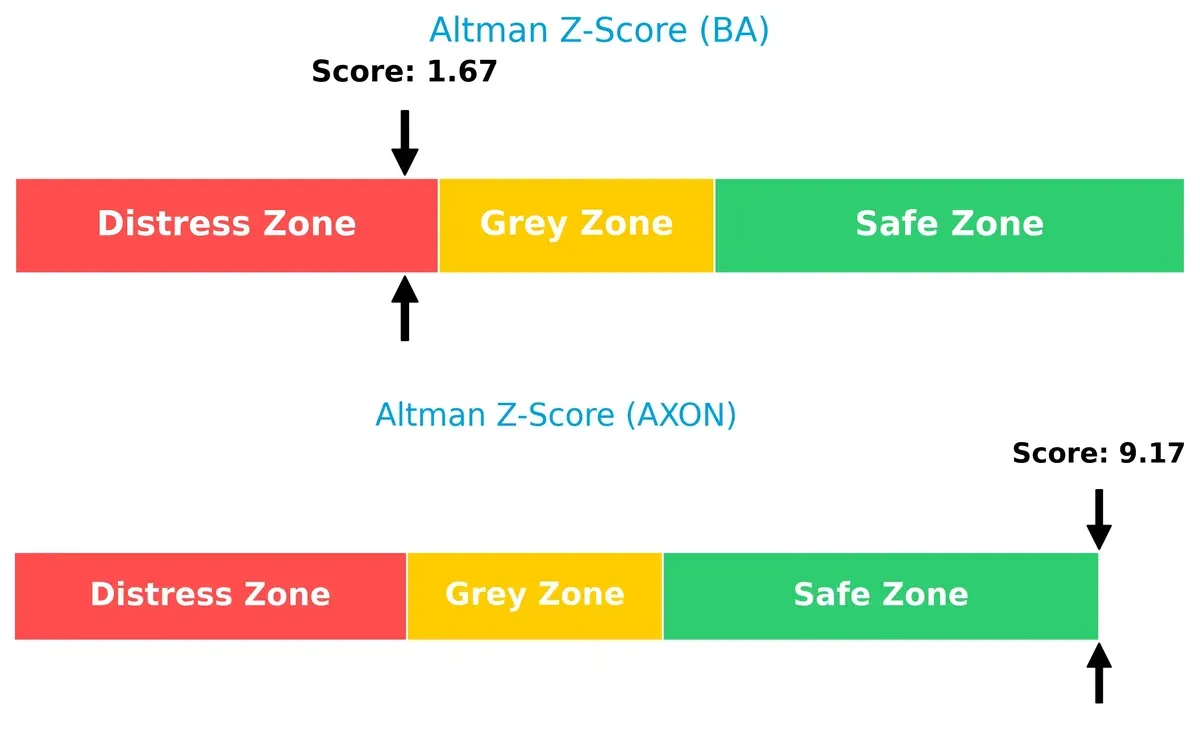
Axon’s robust score signals strong solvency and resilience in this cycle. Boeing’s sub-1.8 score warns of serious financial distress, posing a substantial risk for long-term survival if conditions worsen.
Financial Health: Quality of Operations
Piotroski F-Scores place Boeing (6) and Axon (4) in the average range, with Boeing slightly ahead but neither firm showing peak financial health:

Boeing’s higher score suggests better operational quality, yet both companies reveal internal metric weaknesses. Axon’s lower score flags potential red flags in profitability or efficiency needing investor caution.
How are the two companies positioned?
This section dissects the operational DNA of BA and AXON by comparing their revenue distribution by segment and internal dynamics, including strengths and weaknesses. The goal is to confront their economic moats and identify which business model delivers the most resilient, sustainable competitive advantage in today’s market.
Revenue Segmentation: The Strategic Mix
This visual comparison dissects how Boeing and Axon diversify their income streams and where their primary sector bets lie:
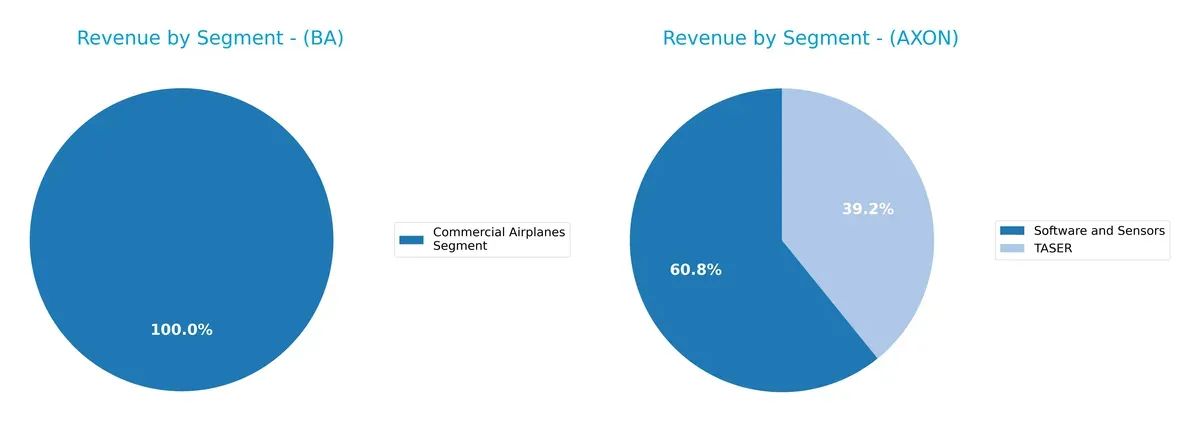
Boeing pivots on its Commercial Airplanes segment, generating $41.5B in 2025, but balances this with $23.9B in Defense and $19.9B in Global Services (2024). Axon shows a more concentrated mix: $951M from Software and Sensors and $613M from TASER in 2023. Boeing’s diversified segments reduce concentration risk and leverage infrastructure dominance. Axon relies heavily on product innovation within a narrower ecosystem, risking exposure to single-market shifts.
Strengths and Weaknesses Comparison
This table compares the Strengths and Weaknesses of The Boeing Company and Axon Enterprise, Inc.:
BA Strengths
- Diversified revenue from Commercial Airplanes, Defense, and Global Services
- Strong global presence with significant US and international sales
- High ROE of 40.98% indicates efficient equity use
- Favorable fixed asset turnover at 5.73
AXON Strengths
- High net margin of 18.1% signals profitability
- Strong interest coverage at 54.75 ensures debt serviceability
- Favorable quick ratio at 1.21 shows liquidity
- Growing Software and Sensors segment supports innovation
BA Weaknesses
- Negative ROIC at -6.71% below WACC of 8.22% signals value destruction
- Unfavorable net margin of 2.5% limits profitability
- High PE and PB ratios indicate overvaluation risk
- Weak quick ratio at 0.49 highlights liquidity concerns
- Low interest coverage of 1.95 raises debt risk
AXON Weaknesses
- ROIC at 1.66% below WACC of 10.18% signals inefficient capital use
- Elevated PE at 119.4 and PB at 19.34 suggest high valuation
- Lower asset turnover at 0.47 reflects asset utilization challenges
- Zero dividend yield may deter income investors
Both companies show strengths in their core markets and global reach but face challenges in capital efficiency and valuation. Boeing’s negative ROIC contrasts with Axon’s low but positive figure. Each must balance growth and profitability while managing financial risks.
The Moat Duel: Analyzing Competitive Defensibility
A structural moat alone protects long-term profits from relentless competition and market pressures. Let’s dissect how these two industrial players defend their turf:
The Boeing Company: Scale and Government Contracts Moat
Boeing’s competitive edge stems from its entrenched government and commercial aerospace contracts. This manifests in stable margins despite cyclical headwinds. However, declining ROIC signals increasing pressure on profitability in 2026.
Axon Enterprise, Inc.: Innovation and Ecosystem Lock-in
Axon leverages cutting-edge TASER and digital evidence software, creating switching costs and network effects. Its growing ROIC trend supports expanding market share and ecosystem depth, though value creation remains under margin pressure.
Defense in Depth: Contract Scale vs. Innovation Ecosystem
Boeing’s vast scale offers a wide moat but diminishing returns challenge its durability. Axon’s innovation ecosystem builds a narrower but deepening moat with improving profitability trends. Axon appears better poised to defend and grow market share amid evolving industry dynamics.
Which stock offers better returns?
Over the past year, both Boeing and Axon showed strong price movements, with Boeing’s trend accelerating and Axon’s momentum decelerating despite a higher overall gain.
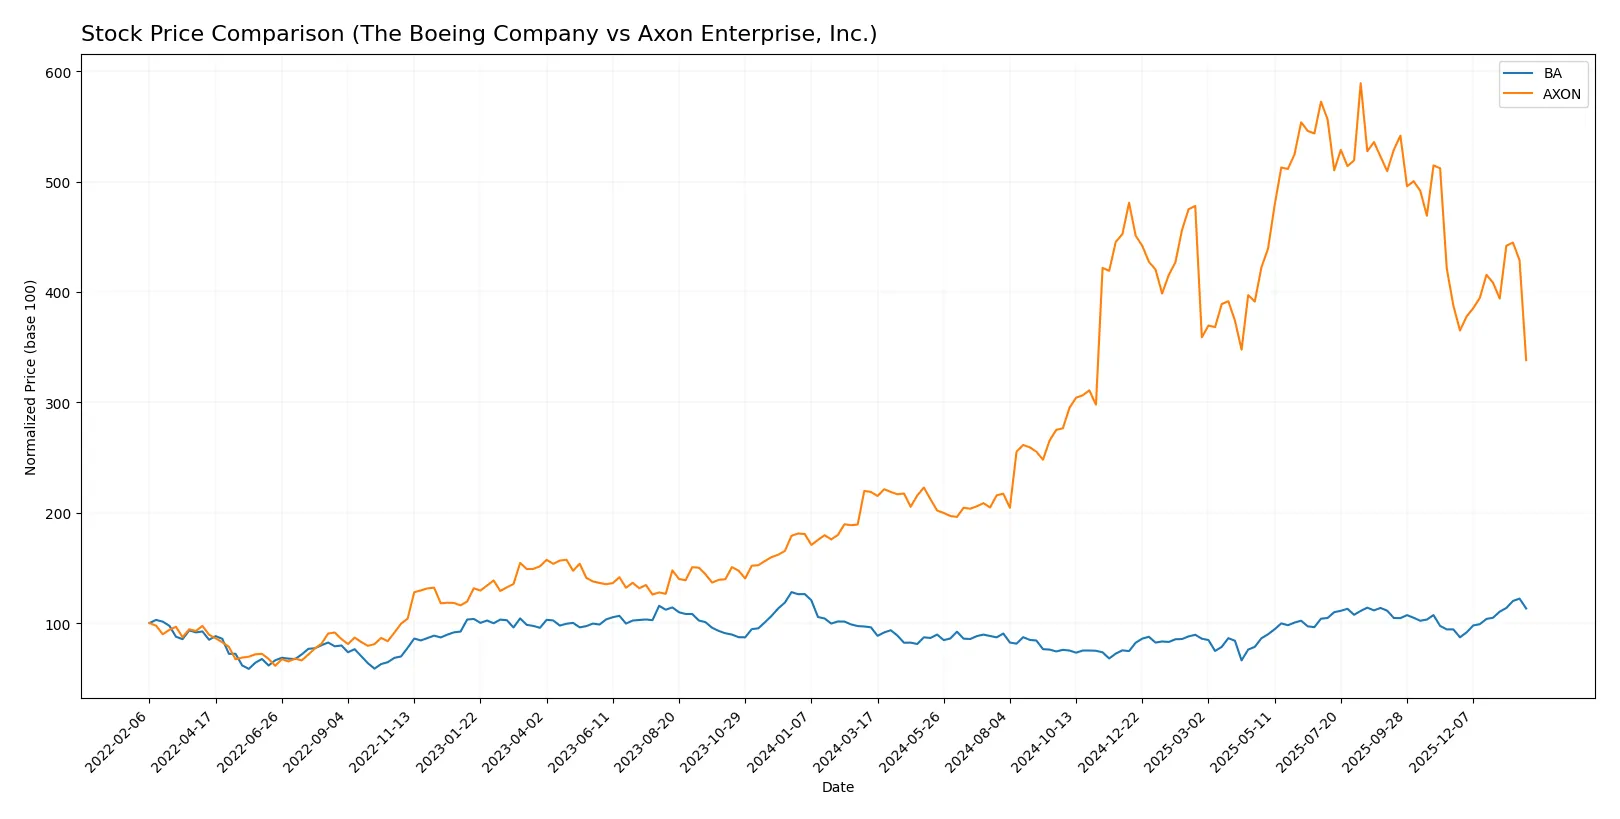
Trend Comparison
The Boeing Company’s stock gained 17.75% over the past 12 months, showing a bullish trend with accelerating momentum and a notable price range between 137 and 252.
Axon Enterprise, Inc. posted a 54.6% increase over the same period, maintaining a bullish but decelerating trend, with higher volatility and prices fluctuating between 281 and 843.
Axon delivered the highest market performance with a 54.6% gain, outperforming Boeing’s 17.75% increase despite recent downward pressure.
Target Prices
Analysts present a clear target price consensus for The Boeing Company and Axon Enterprise, Inc.
| Company | Target Low | Target High | Consensus |
|---|---|---|---|
| The Boeing Company | 150 | 298 | 256.73 |
| Axon Enterprise, Inc. | 713 | 900 | 814.78 |
The Boeing’s consensus target of 257 comfortably exceeds its current price of 234, signaling potential upside. Axon’s target consensus near 815 far surpasses its current 484 price, reflecting strong analyst optimism.

Don’t Let Luck Decide Your Entry Point
Optimize your entry points with our advanced ProRealTime indicators. You’ll get efficient buy signals with precise price targets for maximum performance. Start outperforming now!
How do institutions grade them?
The Boeing Company Grades
Here are the latest grades from major institutions for The Boeing Company:
| Grading Company | Action | New Grade | Date |
|---|---|---|---|
| Citigroup | Maintain | Buy | 2026-01-28 |
| UBS | Maintain | Buy | 2026-01-28 |
| RBC Capital | Maintain | Outperform | 2026-01-28 |
| JP Morgan | Maintain | Overweight | 2026-01-28 |
| Bernstein | Maintain | Outperform | 2026-01-15 |
| Citigroup | Maintain | Buy | 2026-01-13 |
| JP Morgan | Maintain | Overweight | 2025-12-19 |
| Susquehanna | Maintain | Positive | 2025-11-12 |
| Freedom Capital Markets | Upgrade | Buy | 2025-11-03 |
| JP Morgan | Maintain | Overweight | 2025-10-30 |
Axon Enterprise, Inc. Grades
Below are the recent institutional grades for Axon Enterprise, Inc.:
| Grading Company | Action | New Grade | Date |
|---|---|---|---|
| Morgan Stanley | Maintain | Overweight | 2025-12-17 |
| Barclays | Maintain | Overweight | 2025-11-06 |
| Piper Sandler | Maintain | Overweight | 2025-11-05 |
| UBS | Maintain | Neutral | 2025-11-05 |
| Goldman Sachs | Maintain | Buy | 2025-11-05 |
| JMP Securities | Maintain | Market Outperform | 2025-09-29 |
| Needham | Maintain | Buy | 2025-09-24 |
| B of A Securities | Maintain | Buy | 2025-08-06 |
| Raymond James | Maintain | Outperform | 2025-08-05 |
| Craig-Hallum | Upgrade | Buy | 2025-08-05 |
Which company has the best grades?
Both companies have predominantly positive grades, but Boeing’s ratings lean consistently toward Buy and Outperform. Axon shows a mix of Overweight and Buy with some Neutral. Boeing’s stronger consensus may signal higher institutional confidence.
Risks specific to each company
The following categories identify the critical pressure points and systemic threats facing both firms in the 2026 market environment:
1. Market & Competition
The Boeing Company
- Faces intense aerospace & defense competition with cyclical commercial airplane demand.
Axon Enterprise, Inc.
- Competes in law enforcement tech with rapid innovation but niche market exposure.
2. Capital Structure & Debt
The Boeing Company
- High debt-to-equity ratio (~9.92) signals leverage risk and weak interest coverage (1.95x).
Axon Enterprise, Inc.
- Low debt-to-equity (0.6) and strong interest coverage (54.75x) indicate solid financial health.
3. Stock Volatility
The Boeing Company
- Beta of 1.16 suggests moderate volatility typical in aerospace cyclical stocks.
Axon Enterprise, Inc.
- Higher beta of 1.41 indicates greater sensitivity to market swings and investor sentiment.
4. Regulatory & Legal
The Boeing Company
- Subject to strict aerospace and defense regulations and geopolitical export controls.
Axon Enterprise, Inc.
- Faces regulatory scrutiny related to law enforcement technology and data privacy laws.
5. Supply Chain & Operations
The Boeing Company
- Complex global supply chains vulnerable to disruptions in aerospace components.
Axon Enterprise, Inc.
- Relies on hardware and software supply chains but less complex and more flexible.
6. ESG & Climate Transition
The Boeing Company
- Pressure to reduce carbon footprint in aviation; transition risk in aerospace manufacturing.
Axon Enterprise, Inc.
- ESG focus on ethical tech deployment and sustainability in product lifecycle.
7. Geopolitical Exposure
The Boeing Company
- High exposure to international markets and defense contracts sensitive to geopolitical tensions.
Axon Enterprise, Inc.
- Mainly US-focused with limited international defense exposure, reducing geopolitical risk.
Which company shows a better risk-adjusted profile?
The Boeing Company’s heaviest risk lies in its high leverage and weak liquidity, raising bankruptcy concerns despite strong ROE. Axon’s key risk is its high stock volatility and expensive valuation, though it boasts robust financial stability. I find Axon’s safer balance sheet and Altman Z-Score in the safe zone justify a better risk-adjusted profile, despite market swings.
Final Verdict: Which stock to choose?
The Boeing Company’s superpower lies in its sheer scale and infrastructure mastery. It demonstrates aggressive revenue and profit growth, fueled by its entrenched position in aerospace. However, its declining ROIC and heavy debt load are points of vigilance. Boeing suits investors seeking cyclical, turnaround-driven exposure in an aggressive growth portfolio.
Axon Enterprise, Inc. boasts a strategic moat in its recurring revenue model and innovation-driven product ecosystem. Its strong income quality and improving profitability offer better stability compared to Boeing. Axon fits well within a GARP portfolio that values growth backed by solid financial discipline and a growing return on invested capital.
If you prioritize cyclical recovery and scale-driven growth, Boeing is compelling due to its dominant market presence and recent earnings acceleration. However, if you seek steady innovation leadership with improving capital efficiency, Axon offers better stability and a clearer growth runway despite its premium valuation. Both scenarios require careful risk management given their respective financial challenges.
Disclaimer: Investment carries a risk of loss of initial capital. The past performance is not a reliable indicator of future results. Be sure to understand risks before making an investment decision.
Go Further
I encourage you to read the complete analyses of The Boeing Company and Axon Enterprise, Inc. to enhance your investment decisions: