Home > Comparison > Industrials > AXON vs TXT
The strategic rivalry between Axon Enterprise, Inc. and Textron Inc. shapes the aerospace and defense sector’s dynamics. Axon excels as a technology-driven provider of law enforcement hardware and software, while Textron operates as a diversified industrial conglomerate spanning aviation, defense, and finance. This analysis pits Axon’s innovation-led growth against Textron’s broad industrial footprint. I will determine which company’s trajectory offers superior risk-adjusted returns for a well-diversified portfolio in 2026.
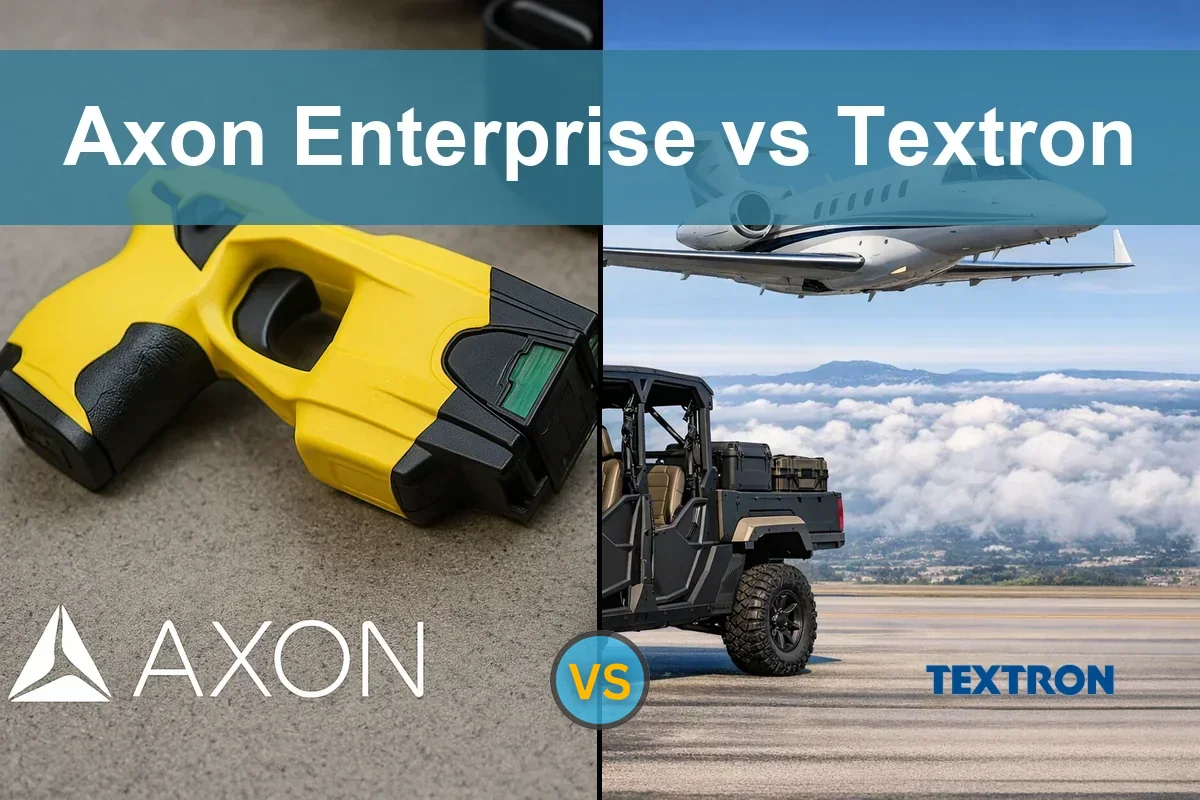
Table of contents
Companies Overview
Axon Enterprise and Textron Inc. hold influential positions in the aerospace and defense sector with distinct market roles.
Axon Enterprise, Inc.: Innovator in Law Enforcement Technology
Axon Enterprise dominates the law enforcement technology market with its TASER brand and digital evidence management solutions. It generates revenue primarily through sales of conducted energy devices and cloud-based software that supports public safety agencies. In 2026, Axon focuses strategically on expanding real-time situational awareness by integrating advanced sensor hardware with its cloud software ecosystem.
Textron Inc.: Diversified Aerospace and Defense Manufacturer
Textron Inc. operates across multiple aerospace and defense segments, including aircraft, helicopters, unmanned systems, and industrial vehicles. Its revenue stems from manufacturing and servicing business jets, military aircraft, helicopters, and industrial products. Textron’s 2026 strategy emphasizes broadening its defense systems portfolio and enhancing service capabilities across global markets.
Strategic Collision: Similarities & Divergences
Axon pursues a software-hardware integrated model targeting law enforcement, contrasting Textron’s diversified manufacturing and defense systems approach. Both compete indirectly in aerospace and defense but focus on different customer bases—Axon on digital public safety solutions, Textron on aircraft and military systems. Their distinct business models create contrasting investment profiles: Axon leans into tech innovation, while Textron emphasizes industrial scale and diversification.
Income Statement Comparison
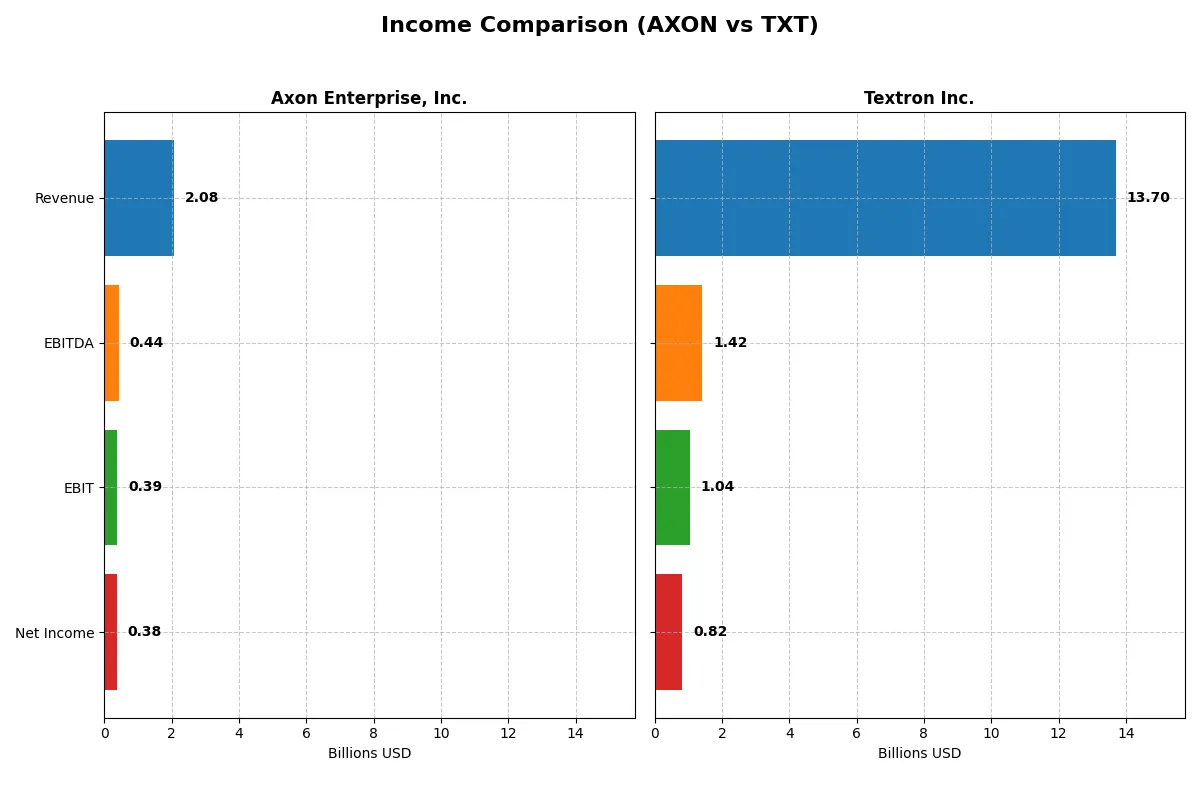
This data dissects the core profitability and scalability of both corporate engines to reveal who dominates the bottom line:
| Metric | Axon Enterprise, Inc. (AXON) | Textron Inc. (TXT) |
|---|---|---|
| Revenue | 2.08B | 13.70B |
| Cost of Revenue | 841M | 11.20B |
| Operating Expenses | 1.18B | 1.65B |
| Gross Profit | 1.24B | 2.50B |
| EBITDA | 437M | 1.42B |
| EBIT | 389M | 1.04B |
| Interest Expense | 7.1M | 97M |
| Net Income | 377M | 824M |
| EPS | 4.98 | 5.11 |
| Fiscal Year | 2024 | 2025 |
Income Statement Analysis: The Bottom-Line Duel
This income statement comparison reveals which company operates with superior efficiency and sustainable profitability in their respective markets.
Axon Enterprise, Inc. Analysis
Axon’s revenue surged from 681M in 2020 to 2.08B in 2024, with net income leaping from a loss to 377M. Its gross margin remains robust at 59.6%, signaling strong cost control. The net margin improved to 18.1%, demonstrating powerful earnings growth and operational momentum in 2024 despite rising operating expenses.
Textron Inc. Analysis
Textron’s revenue stabilized near 13.7B from 2023 to 2025, with net income around 824M in 2025. Gross margin holds modestly at 18.3%, while net margin sits at 6.0%, reflecting tighter profitability. Despite flat revenue growth in 2025, Textron’s stable earnings and controlled interest expense underline consistent but moderate operational efficiency.
Verdict: High-Growth Margin Expansion vs. Stable Industrial Scale
Axon outpaces Textron with exceptional revenue and net income growth, driven by a healthy 59.6% gross margin and expanding profitability. Textron offers scale and steady cash flow but lags in margin efficiency and growth momentum. Investors favoring dynamic profit expansion will find Axon’s profile more compelling than Textron’s stable yet slower growth.
Financial Ratios Comparison
These vital ratios act as a diagnostic tool to expose the underlying fiscal health, valuation premiums, and capital efficiency of the companies compared below:
| Ratios | Axon Enterprise, Inc. (AXON) | Textron Inc. (TXT) |
|---|---|---|
| ROE | 16.2% | 10.5% |
| ROIC | 1.7% | 6.9% |
| P/E | 119.4 | 19.0 |
| P/B | 19.3 | 2.0 |
| Current Ratio | 1.37 | 5.94 |
| Quick Ratio | 1.21 | 2.33 |
| D/E | 0.60 | 0.45 |
| Debt-to-Assets | 31.3% | 19.5% |
| Interest Coverage | 8.25 | 8.81 |
| Asset Turnover | 0.47 | 0.76 |
| Fixed Asset Turnover | 8.42 | 5.29 |
| Payout Ratio | 0 | 2.3% |
| Dividend Yield | 0% | 0.12% |
| Fiscal Year | 2024 | 2025 |
Efficiency & Valuation Duel: The Vital Signs
Financial ratios act as a company’s DNA, revealing hidden risks and operational excellence beyond headline numbers.
Axon Enterprise, Inc.
Axon demonstrates strong profitability with a 16.2% ROE and an impressive 18.1% net margin, signaling operational excellence. However, its valuation is stretched, with a P/E ratio at 119.4 and a high P/B of 19.34. Axon pays no dividend, instead reinvesting heavily in R&D, supporting future growth but raising valuation risk.
Textron Inc.
Textron shows moderate profitability, with a 10.46% ROE and a 6.01% net margin, reflecting stable but less robust earnings. Its valuation is reasonable, with a P/E of 19.04 and a P/B of 1.99, indicating fair pricing. Textron offers a small dividend yield of 0.12%, balancing shareholder returns with steady capital allocation.
Premium Valuation vs. Operational Safety
Axon’s high valuation contrasts with Textron’s more balanced metrics, offering higher growth potential but greater risk. Textron provides a safer, more affordable profile with modest returns. Growth-oriented investors may prefer Axon, while risk-averse investors might lean toward Textron’s stability.
Which one offers the Superior Shareholder Reward?
I observe Axon Enterprise, Inc. (AXON) and Textron Inc. (TXT) take sharply different distribution approaches. Axon pays no dividends, reinvesting 81% of its free cash flow into growth and technology, fueling its premium valuation (P/E ~119). Its buyback program is minimal, signaling a focus on capital allocation to innovation rather than immediate shareholder yield. Conversely, Textron offers a modest dividend yield (~0.12%) with a conservative payout ratio (~2%), underpinned by robust free cash flow coverage (~70%). TXT also commits to steady share repurchases, enhancing total return. Given Axon’s sky-high multiples and zero payout, its strategy suits growth investors with tolerance for valuation risk. Textron delivers more sustainable shareholder rewards through balanced dividends and buybacks, supported by stable margins and moderate leverage. In 2026, I favor Textron for superior risk-adjusted total returns, combining income and capital appreciation more prudently than Axon’s aggressive growth reinvestment.
Comparative Score Analysis: The Strategic Profile
The radar chart reveals the fundamental DNA and trade-offs of Axon Enterprise, Inc. and Textron Inc., highlighting their financial strengths and valuation nuances:
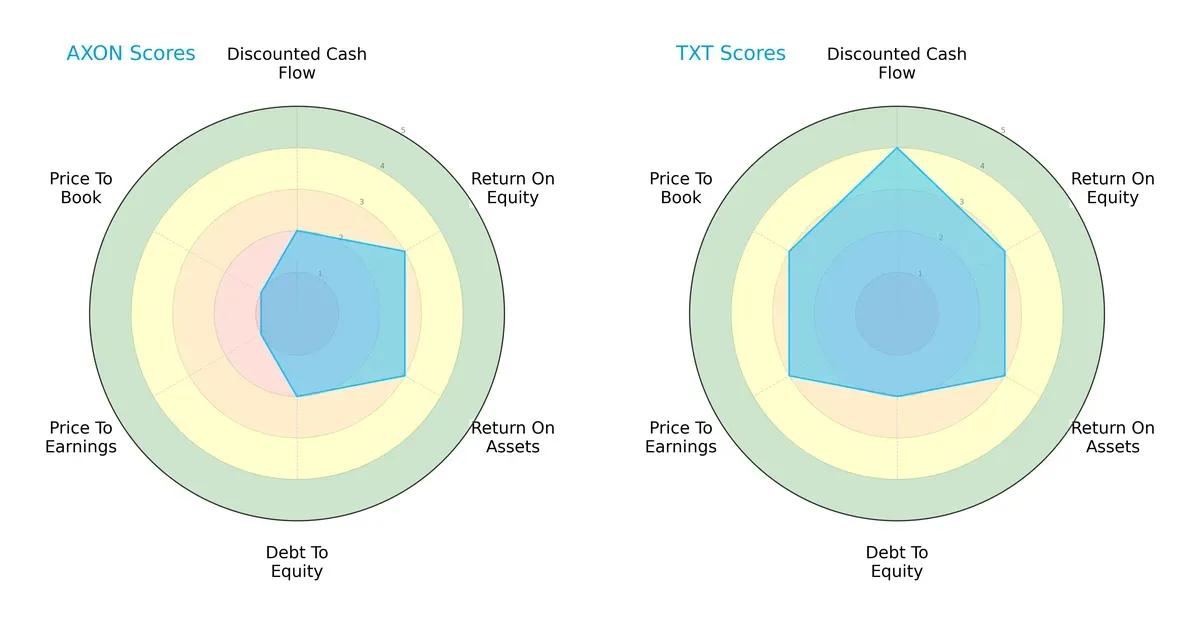
Textron presents a more balanced profile with strong DCF (4) and fair valuation scores (P/E and P/B at 3), indicating reasonable market pricing and cash flow prospects. Axon relies more on operational efficiency with moderate ROE and ROA (3 each), but suffers from very unfavorable valuation scores (both P/E and P/B at 1), signaling possible market skepticism. Debt profiles are moderate and comparable for both (2). Overall, Textron’s diversified strengths suggest steadier investment appeal, while Axon’s edge is narrower and riskier.
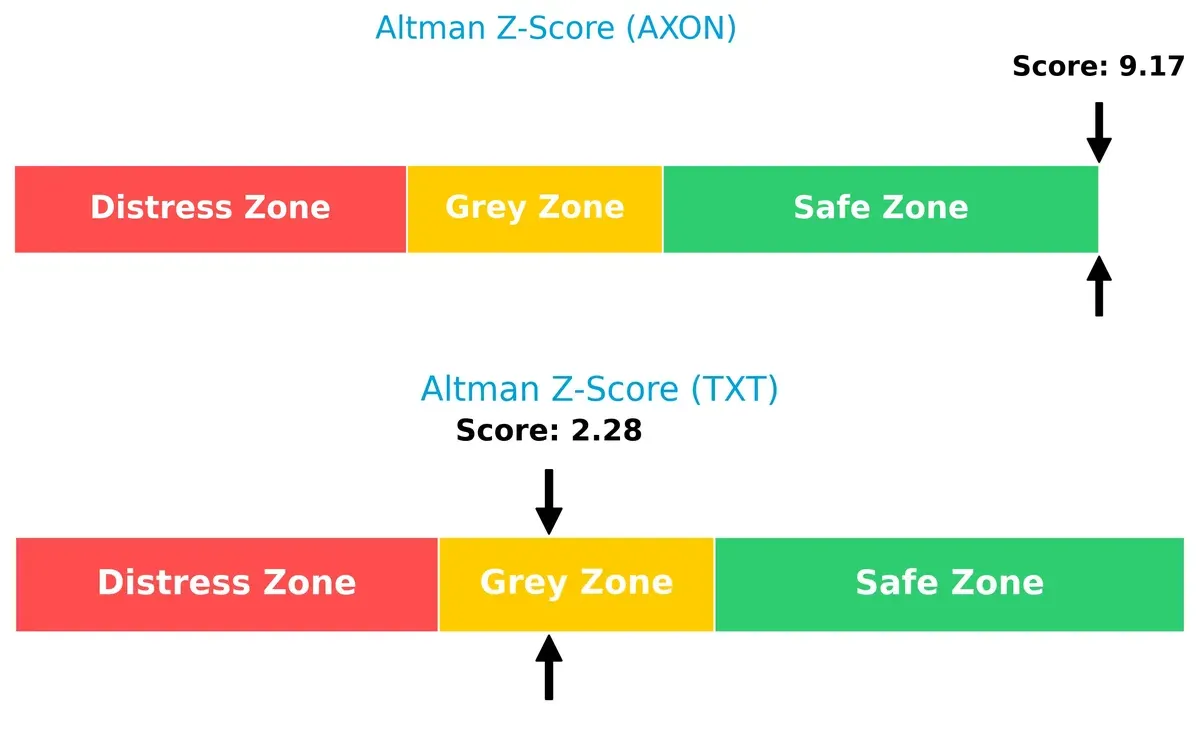
Bankruptcy Risk: Solvency Showdown
Axon’s Altman Z-Score of 9.17 firmly places it in the safe zone, indicating very low bankruptcy risk. Textron’s 2.28 score sits in the grey zone, signaling moderate financial distress potential in this cycle:
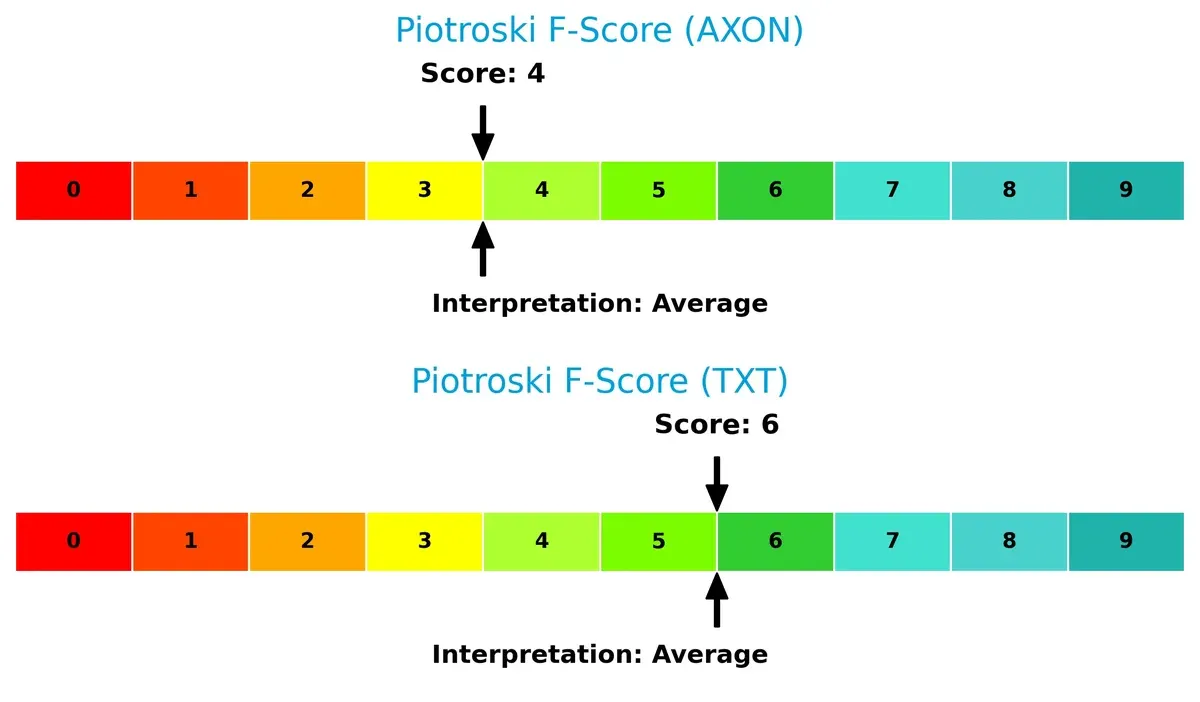
Financial Health: Quality of Operations
Textron’s Piotroski F-Score of 6 surpasses Axon’s 4, suggesting stronger internal financial health and fewer red flags in profitability and efficiency metrics:
How are the two companies positioned?
This section dissects Axon and Textron’s operational DNA by comparing revenue distribution and internal strengths and weaknesses. The goal is to confront their economic moats to reveal which model sustains the strongest competitive edge today.
Revenue Segmentation: The Strategic Mix
The following visual comparison dissects how Axon Enterprise, Inc. and Textron Inc. diversify their income streams and where their primary sector bets lie:
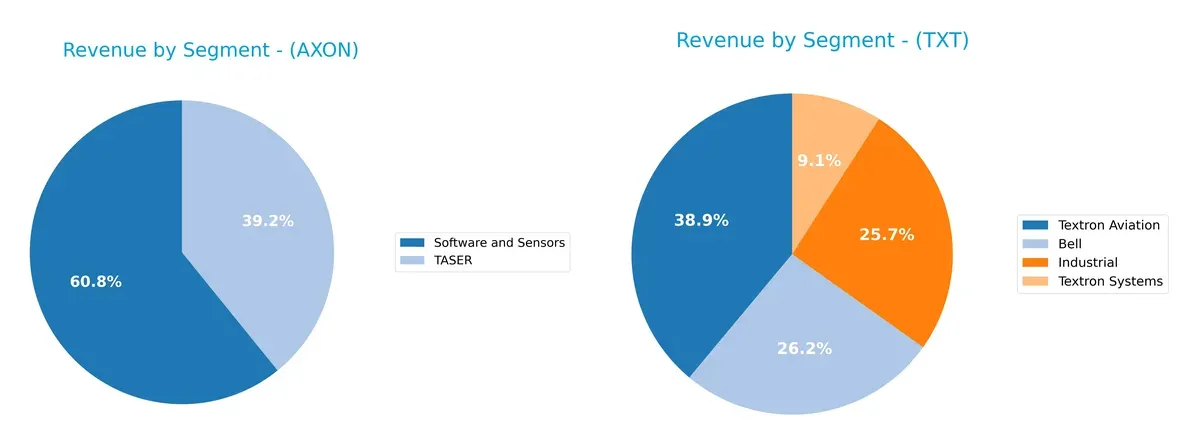
Axon’s revenue pivots mainly on two segments: Software and Sensors ($951M) and TASER ($613M), showing moderate diversification. Textron dominates with four large segments, led by Textron Aviation ($5.3B), Bell ($3.6B), Industrial ($3.5B), and Textron Systems ($1.2B). Textron’s broader mix reduces concentration risk, while Axon’s focus on security tech signals a strategic bet on ecosystem lock-in and innovation-driven growth.
Strengths and Weaknesses Comparison
This table compares the strengths and weaknesses of Axon Enterprise, Inc. and Textron Inc.:
Axon Strengths
- High net margin at 18.1%
- Strong ROE of 16.2%
- Favorable quick ratio of 1.21
- Excellent interest coverage at 54.75
- Growing Software and Sensors revenue stream
- Solid U.S. market presence with 1.78B revenue
Textron Strengths
- Favorable WACC at 7.56%
- Strong quick ratio of 2.33
- Low debt-to-assets at 19.49%
- Consistent global diversification with large U.S. and international sales
- Broad product segmentation across Aviation, Industrial, Bell, and Systems
- Favorable fixed asset turnover of 5.29
Axon Weaknesses
- Unfavorable ROIC at 1.66% below WACC of 10.18%
- Very high P/E at 119.4 and P/B at 19.34 indicate overvaluation
- Asset turnover weak at 0.47
- No dividend yield
- Neutral current ratio of 1.37
- Heavy U.S. revenue dependence with limited international diversification
Textron Weaknesses
- Unfavorable current ratio at 5.94 suggests inefficient working capital management
- Neutral net margin at 6.01% and ROE at 10.46% indicate modest profitability
- Dividend yield low at 0.12%
- Asset turnover neutral at 0.76
- Lower interest coverage at 10.72 compared to Axon
Axon excels in profitability and interest coverage but faces valuation and efficiency challenges. Textron benefits from diversified revenue and solid capital structure but shows room to improve profitability and working capital efficiency. These factors influence their strategic focus on innovation, market expansion, and financial discipline.
The Moat Duel: Analyzing Competitive Defensibility
A structural moat is the only true shield preventing long-term profits from being eroded by competition pressures and market shifts:
Axon Enterprise, Inc.: Intangible Assets & Network Effects
Axon’s moat stems from its proprietary TASER brand and integrated digital evidence software. This combination delivers stable margins and strong revenue growth. Expansion in cloud-based solutions in 2026 could deepen its moat.
Textron Inc.: Diversified Industrial Scale & Cost Advantage
Textron leverages its scale across aerospace, defense, and industrial segments, driving operational efficiency. Unlike Axon, its margin profile is thinner but benefits from broad market reach. New defense contracts may enhance its position.
Moat Strength Faceoff: Intangible Assets vs. Industrial Scale
Both firms destroy value relative to WACC but show improving ROIC trends. Axon’s niche technology and software moat appear deeper, while Textron’s scale offers breadth. Axon is better positioned to defend market share via innovation.
Which stock offers better returns?
Over the past year, Axon Enterprise, Inc. experienced a strong price rise with some recent pullback, while Textron Inc. showed an overall decline despite short-term gains.
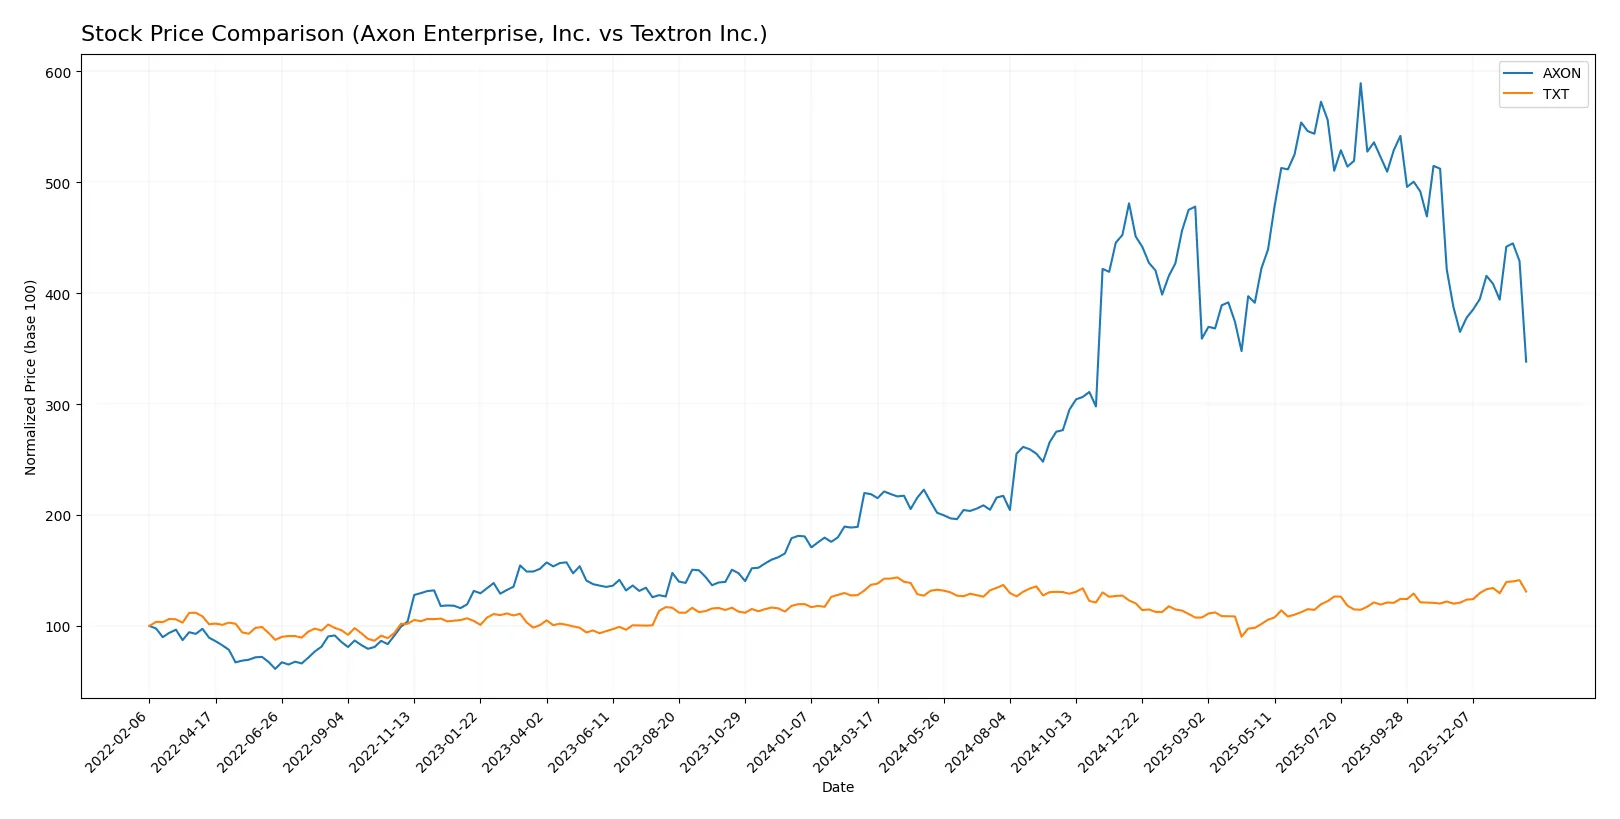
Trend Comparison
Axon’s stock rose 54.6% over the past 12 months, marking a bullish trend with decelerating momentum. The price ranged from 280.5 to 842.5, reflecting significant volatility.
Textron’s stock fell 4.42% over the same period, indicating a bearish trend with accelerating downward momentum. The price fluctuated between 60.72 and 96.65 with low volatility.
Comparing both, Axon delivered the highest market performance with a strong overall gain, while Textron lagged behind despite recent upward movement.
Target Prices
Analysts set clear upside potential for both Axon Enterprise and Textron, indicating strong confidence in their growth prospects.
| Company | Target Low | Target High | Consensus |
|---|---|---|---|
| Axon Enterprise, Inc. | 713 | 900 | 815 |
| Textron Inc. | 92 | 115 | 102 |
Axon’s consensus target price of 815 suggests a 69% upside from its current 484 price. Textron’s 102 target implies a 16% gain above its 88 price.

Don’t Let Luck Decide Your Entry Point
Optimize your entry points with our advanced ProRealTime indicators. You’ll get efficient buy signals with precise price targets for maximum performance. Start outperforming now!
How do institutions grade them?
Institutional grade comparisons for Axon Enterprise, Inc. and Textron Inc. are as follows:
Axon Enterprise, Inc. Grades
The table below summarizes recent grades assigned to Axon Enterprise, Inc. by reputable firms.
| Grading Company | Action | New Grade | Date |
|---|---|---|---|
| Morgan Stanley | maintain | Overweight | 2025-12-17 |
| Barclays | maintain | Overweight | 2025-11-06 |
| Piper Sandler | maintain | Overweight | 2025-11-05 |
| UBS | maintain | Neutral | 2025-11-05 |
| Goldman Sachs | maintain | Buy | 2025-11-05 |
| JMP Securities | maintain | Market Outperform | 2025-09-29 |
| Needham | maintain | Buy | 2025-09-24 |
| B of A Securities | maintain | Buy | 2025-08-06 |
| Raymond James | maintain | Outperform | 2025-08-05 |
| Craig-Hallum | upgrade | Buy | 2025-08-05 |
Textron Inc. Grades
The table below presents recent grades assigned to Textron Inc. by recognized grading companies.
| Grading Company | Action | New Grade | Date |
|---|---|---|---|
| JP Morgan | maintain | Neutral | 2026-01-29 |
| Citigroup | maintain | Neutral | 2026-01-29 |
| UBS | maintain | Neutral | 2026-01-15 |
| Citigroup | maintain | Neutral | 2026-01-13 |
| JP Morgan | maintain | Neutral | 2025-10-27 |
| TD Cowen | maintain | Hold | 2025-10-24 |
| UBS | maintain | Neutral | 2025-10-24 |
| Barclays | maintain | Overweight | 2025-07-29 |
| UBS | upgrade | Neutral | 2025-07-28 |
| Susquehanna | maintain | Positive | 2025-07-25 |
Which company has the best grades?
Axon Enterprise, Inc. consistently receives higher grades, including multiple Buy and Overweight ratings, while Textron Inc. mostly holds Neutral and Hold grades. This disparity suggests Axon is viewed more favorably by analysts, potentially reflecting stronger growth prospects or operational performance. Investors may interpret this as a signal of relative confidence in Axon’s future relative to Textron.
Risks specific to each company
The following categories identify critical pressure points and systemic threats facing Axon Enterprise, Inc. and Textron Inc. in the 2026 market environment:
1. Market & Competition
Axon Enterprise, Inc.
- Faces intense competition in law enforcement tech, pressured by innovation cycles and pricing.
Textron Inc.
- Competes across diverse aerospace and defense segments, exposed to cyclical demand and defense budgets.
2. Capital Structure & Debt
Axon Enterprise, Inc.
- Moderate debt level (D/E 0.6), interest coverage strong at 54.75x, signaling low financial distress risk.
Textron Inc.
- Lower debt ratio (D/E 0.45) and solid interest coverage (10.72x) provide financial flexibility and stability.
3. Stock Volatility
Axon Enterprise, Inc.
- Beta at 1.414 indicates higher volatility than market; stock price range wide (469-886), riskier for risk-averse investors.
Textron Inc.
- Beta near 1.0 reflects market-comparable volatility; price range narrower, indicating steadier trading behavior.
4. Regulatory & Legal
Axon Enterprise, Inc.
- Subject to scrutiny on use of conducted energy devices and data privacy for body cameras.
Textron Inc.
- Faces regulatory risks tied to defense contracts, export controls, and environmental compliance.
5. Supply Chain & Operations
Axon Enterprise, Inc.
- Relies on advanced technology components; vulnerable to semiconductor shortages and logistics disruptions.
Textron Inc.
- Complex global supply chain for aerospace parts; exposed to geopolitical tensions and raw material price swings.
6. ESG & Climate Transition
Axon Enterprise, Inc.
- Increasing pressure to improve sustainability in manufacturing and reduce carbon footprint.
Textron Inc.
- Under scrutiny for emissions in manufacturing and military product lines; transition risks in defense sector.
7. Geopolitical Exposure
Axon Enterprise, Inc.
- Primarily US-focused with limited international exposure, moderating geopolitical risk.
Textron Inc.
- Extensive international footprint in defense markets exposes Textron to trade tensions and regulatory changes.
Which company shows a better risk-adjusted profile?
Textron’s diversified aerospace and defense operations, combined with stronger balance sheet metrics and lower stock volatility, suggest a more balanced risk profile. Axon’s higher beta and concentrated market niche elevate its risk despite strong profitability. Textron’s Altman Z-score in the grey zone versus Axon’s safe zone highlights differing financial distress risks, but Axon’s elevated valuation multiples and operating leverage raise caution. Recent data reveal Axon’s ROIC below WACC, signaling capital inefficiency, while Textron maintains more favorable capital returns. Overall, Textron offers superior risk-adjusted stability for investors focused on prudent capital allocation.
Final Verdict: Which stock to choose?
Axon Enterprise, Inc. excels as a high-growth innovator with a strong income statement and expanding profitability. Its superpower lies in rapid margin expansion and robust revenue growth, although its elevated valuation and low capital efficiency warrant caution. It suits investors aiming for aggressive growth exposure.
Textron Inc. offers a solid strategic moat through operational stability and consistent cash flow generation. Its moderate valuation and superior financial safety profile provide a buffer against volatility, making it a fit for investors seeking growth at a reasonable price with more defensive characteristics.
If you prioritize high-growth potential and are comfortable with valuation premiums and capital efficiency risks, Axon outshines with its dynamic profitability surge. However, if you seek better stability and a more balanced risk-return profile, Textron offers a compelling scenario with its steady cash flow and financial resilience.
Disclaimer: Investment carries a risk of loss of initial capital. The past performance is not a reliable indicator of future results. Be sure to understand risks before making an investment decision.
Go Further
I encourage you to read the complete analyses of Axon Enterprise, Inc. and Textron Inc. to enhance your investment decisions: