Home > Comparison > Industrials > RTX vs AXON
The strategic rivalry between RTX Corporation and Axon Enterprise, Inc. shapes the Aerospace & Defense industry’s innovation and market reach. RTX operates as a capital-intensive industrial giant with diverse aerospace segments, while Axon focuses on high-margin, technology-driven law enforcement solutions. This analysis explores their contrasting growth models and competitive moats. It aims to identify which company offers a superior risk-adjusted return for a diversified portfolio navigating complex sector dynamics.
Table of contents
Companies Overview
RTX Corporation and Axon Enterprise, Inc. stand as pivotal players in the Aerospace & Defense sector, each commanding significant market influence.
RTX Corporation: Aerospace & Defense Giant
RTX Corporation dominates aerospace and defense, generating revenue through diversified segments: Collins Aerospace, Pratt & Whitney, and Raytheon. Its core business includes aircraft systems, engines, and defense technologies. In 2026, RTX focused on innovation in propulsion and integrated defense solutions, reinforcing its leadership in commercial and military aerospace markets.
Axon Enterprise, Inc.: Law Enforcement Technology Innovator
Axon Enterprise leads in conducted energy devices and digital evidence management for law enforcement. Its business model combines TASER hardware with cloud-based software, enhancing public safety operations. In 2026, Axon prioritized expanding real-time crime center capabilities through strategic partnerships, aiming to revolutionize law enforcement situational awareness and operational efficiency.
Strategic Collision: Similarities & Divergences
RTX emphasizes a broad aerospace and defense portfolio with deep integration across segments. Axon adopts a specialized approach, focusing on law enforcement technology and software ecosystems. They compete primarily in public safety and defense innovation. RTX offers scale and diversified revenue; Axon provides niche technology with high growth potential, reflecting distinct risk and return profiles.
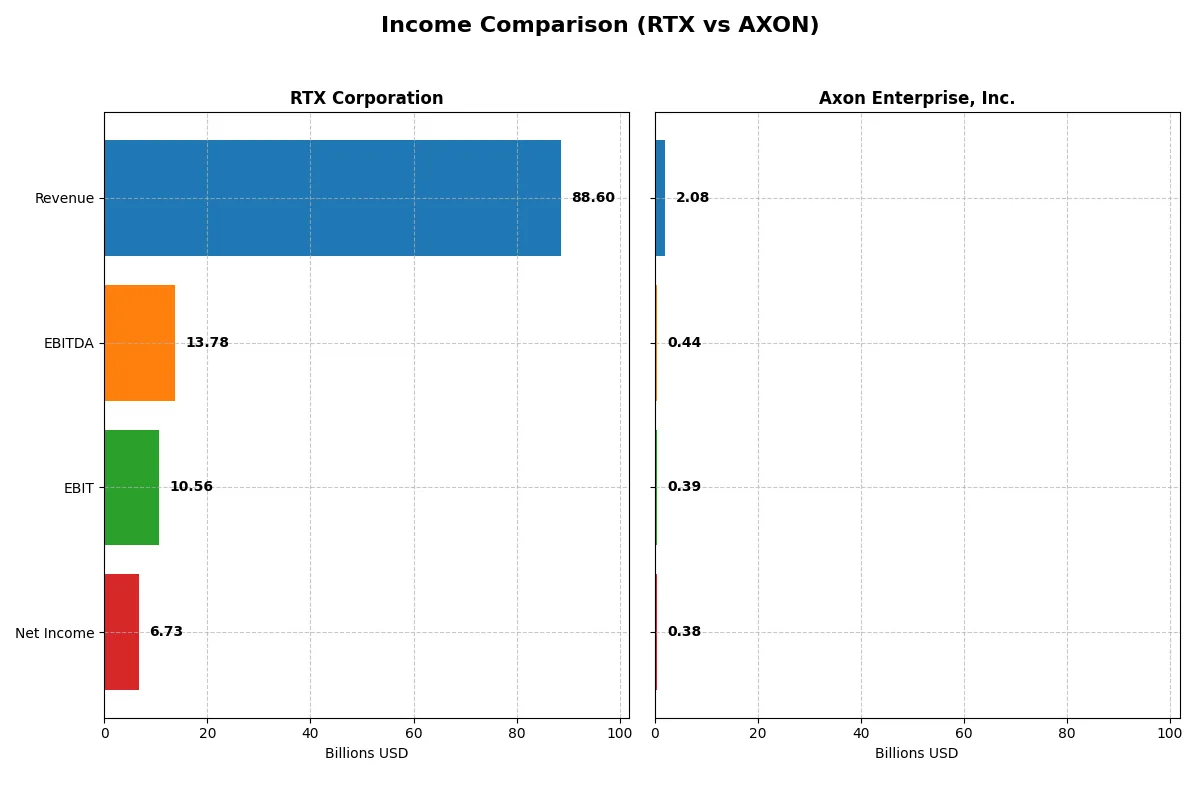
Income Statement Comparison
This data dissects the core profitability and scalability of both corporate engines to reveal who dominates the bottom line:
| Metric | RTX Corporation (RTX) | Axon Enterprise, Inc. (AXON) |
|---|---|---|
| Revenue | 88.6B | 2.08B |
| Cost of Revenue | 70.8B | 841M |
| Operating Expenses | 8.9B | 1.18B |
| Gross Profit | 17.8B | 1.24B |
| EBITDA | 13.8B | 437M |
| EBIT | 10.6B | 389M |
| Interest Expense | 1.83B | 7.1M |
| Net Income | 6.73B | 377M |
| EPS | 5.03 | 4.98 |
| Fiscal Year | 2025 | 2024 |
Income Statement Analysis: The Bottom-Line Duel
This income statement comparison reveals which corporate engine runs more efficiently through their revenue and profit dynamics.
RTX Corporation Analysis
RTX Corporation’s revenue climbed steadily from $64B in 2021 to $88.6B in 2025, driving net income from $3.9B to $6.7B. Gross and net margins hold firm at 20.1% and 7.6%, respectively, reflecting solid operational control. The latest year shows accelerating EBIT growth of 29.4%, signaling robust momentum and margin expansion.
Axon Enterprise, Inc. Analysis
Axon Enterprise’s revenue surged from $863M in 2021 to $2.08B in 2024, with net income leaping from a loss to $377M. Exceptional gross and net margins at 59.6% and 18.1% underscore superior profitability. Despite some unfavorable expense growth, EBIT jumped 137% last year, highlighting rapid scaling and improving efficiency.
Margin Strength vs. Growth Trajectory
RTX delivers steady, robust margin expansion and consistent profit growth. Axon impresses with explosive revenue and earnings growth, paired with high margins. RTX wins on scale and stable profitability, while Axon appeals to growth-focused investors seeking rapid momentum and margin leverage. Each profile suits distinct investment appetites.
Financial Ratios Comparison
These vital ratios act as a diagnostic tool to expose the underlying fiscal health, valuation premiums, and capital efficiency of the companies compared below:
| Ratios | RTX Corporation (RTX) | Axon Enterprise, Inc. (AXON) |
|---|---|---|
| ROE | 10.32% | 16.20% |
| ROIC | 6.22% | 1.66% |
| P/E | 36.64 | 119.40 |
| P/B | 3.78 | 19.34 |
| Current Ratio | 1.03 | 1.37 |
| Quick Ratio | 0.80 | 1.21 |
| D/E | 0.63 | 0.60 |
| Debt-to-Assets | 24.03% | 31.33% |
| Interest Coverage | 4.86 | 8.25 |
| Asset Turnover | 0.52 | 0.47 |
| Fixed Asset Turnover | 4.72 | 8.42 |
| Payout ratio | 53.09% | 0% |
| Dividend yield | 1.45% | 0% |
| Fiscal Year | 2025 | 2024 |
Efficiency & Valuation Duel: The Vital Signs
Ratios act as a company’s DNA, revealing hidden risks and operational excellence behind headline numbers.
RTX Corporation
RTX shows moderate profitability with a 10.3% ROE and 7.6% net margin, reflecting operational stability. Its P/E of 36.6 and P/B of 3.78 signal a stretched valuation. The company balances shareholder returns with a 1.45% dividend yield alongside reinvestment in R&D, supporting long-term growth.
Axon Enterprise, Inc.
Axon delivers robust profitability, boasting a 16.2% ROE and an 18.1% net margin, indicating strong operational efficiency. However, its valuation is highly stretched, with a P/E of 119.4 and P/B near 19.3. Axon pays no dividend, channeling capital into aggressive R&D and innovation to fuel growth.
Premium Valuation vs. Operational Safety
RTX offers a more balanced risk-reward profile with moderate profitability and fairer valuation, supported by dividends and R&D. Axon excels in profitability but trades at a steep premium without shareholder payouts. RTX suits investors prioritizing stability; Axon fits those seeking high-growth potential despite valuation risk.
Which one offers the Superior Shareholder Reward?
I see RTX Corporation offers a 1.45% dividend yield with a sustainable 53% payout ratio, backed by solid free cash flow of 5.9/share. Its buybacks are moderate but consistent, enhancing total returns. Axon Enterprise pays no dividend, focusing entirely on reinvestment and rapid growth, with an aggressive buyback program absent. RTX’s balanced distribution—dividends plus buybacks—provides a more reliable shareholder reward in 2026. Axon’s high valuation and zero yield pose higher risk despite growth potential. I favor RTX for sustainable, superior total return.
Comparative Score Analysis: The Strategic Profile
The radar chart reveals the fundamental DNA and trade-offs between RTX Corporation and Axon Enterprise, highlighting their core financial strengths and valuation challenges:
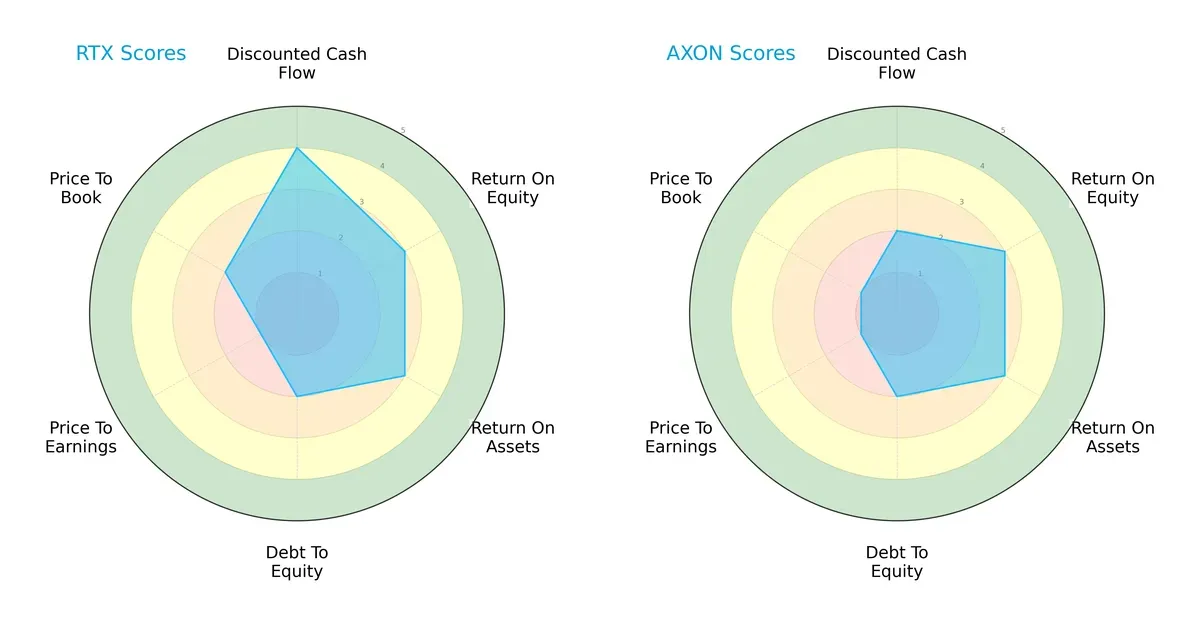
RTX shows a more balanced profile with moderate returns (ROE 3, ROA 3) and a favorable DCF score (4). Axon matches RTX’s operational efficiency (ROE 3, ROA 3) but scores lower in DCF (2). Both face high valuation risk (P/E score 1), but RTX’s slightly better price-to-book score (2 vs. 1) and overall score (3 vs. 2) suggest a more stable investment foundation.
Bankruptcy Risk: Solvency Showdown
The Altman Z-Score gap highlights Axon’s superior solvency standing compared to RTX, implying a safer long-term survival outlook in this market cycle:
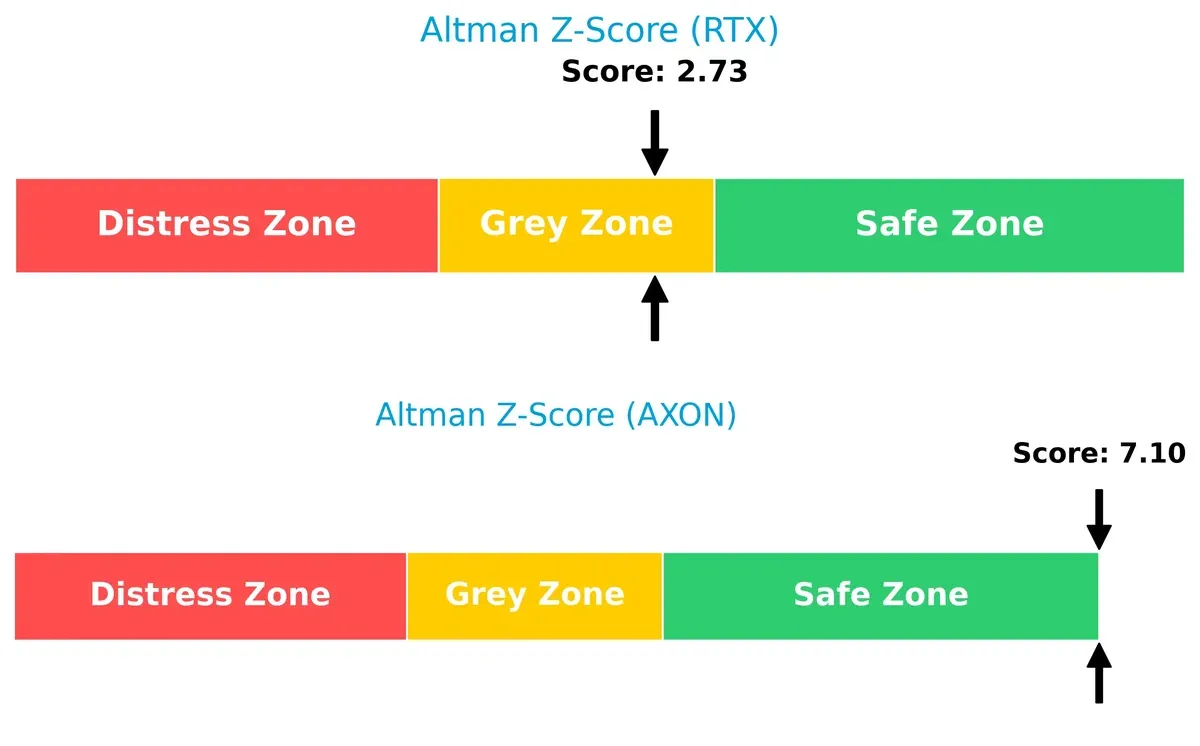
Axon’s Z-Score of 7.1 places it firmly in the safe zone, signaling robust financial health and low bankruptcy risk. RTX’s 2.73 score lies in the grey zone, indicating moderate risk and warranting caution for conservative investors.
Financial Health: Quality of Operations
RTX’s Piotroski F-Score outperforms Axon’s, signaling stronger operational quality and fewer internal red flags:
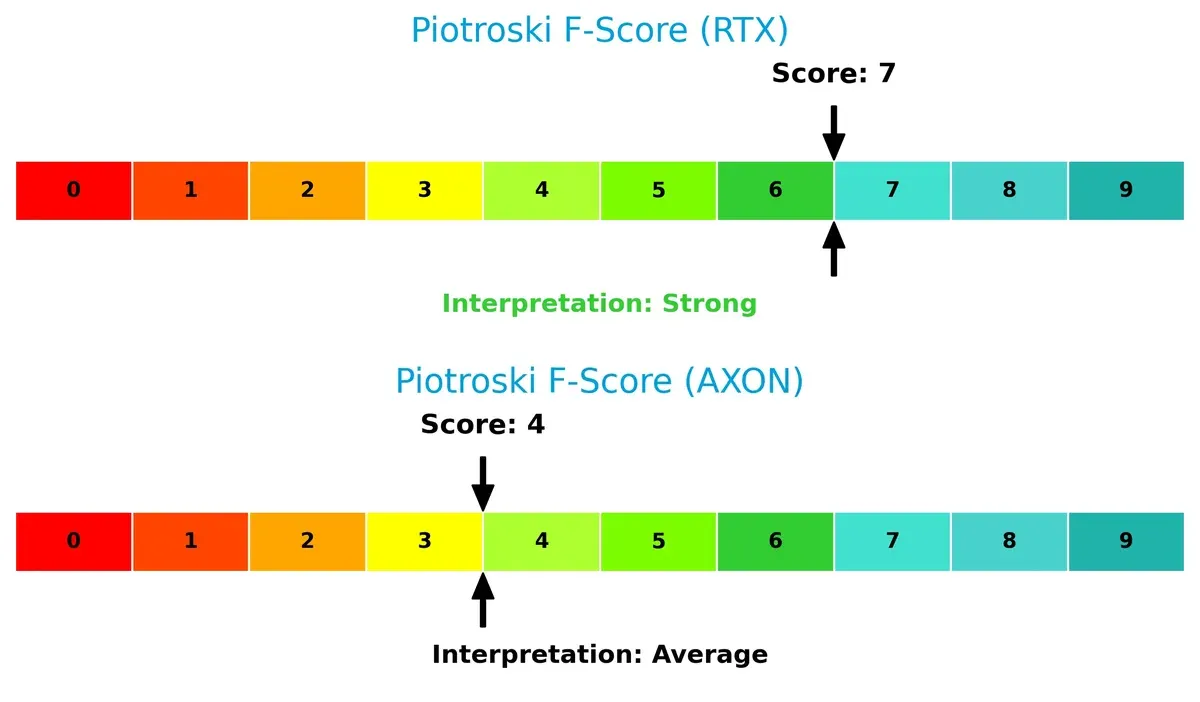
With a score of 7, RTX demonstrates strong profitability, liquidity, and efficiency metrics. Axon’s average score of 4 reveals potential weaknesses in financial discipline and operational execution, raising concerns over its resilience amid economic pressures.
How are the two companies positioned?
This section dissects RTX and Axon’s operational DNA by comparing their revenue distribution and internal strengths and weaknesses. The goal is to confront their economic moats to reveal which model delivers the most resilient, sustainable competitive advantage today.
Revenue Segmentation: The Strategic Mix
This visual comparison dissects how RTX Corporation and Axon Enterprise, Inc. diversify their income streams and reveals where their primary sector bets lie:
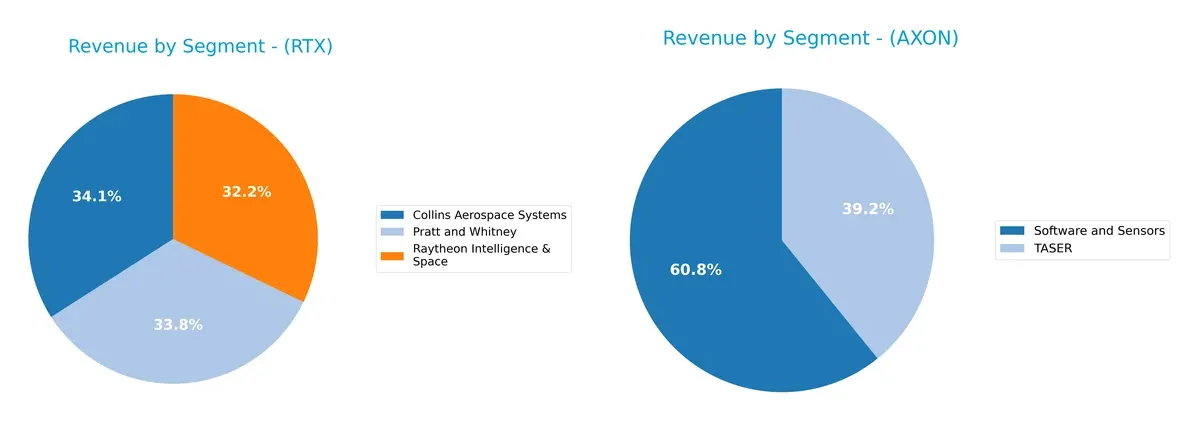
RTX Corporation exhibits a well-balanced revenue distribution across Collins Aerospace Systems ($28.3B), Pratt and Whitney ($28.1B), and Raytheon Intelligence & Space ($26.7B). This diversified mix anchors RTX’s defense and aerospace ecosystem, reducing concentration risk. Conversely, Axon Enterprise relies heavily on Software and Sensors ($951M) and TASER products ($613M), reflecting a narrower focus on law enforcement tech. Axon’s concentration pivots on innovation in software-driven safety solutions but faces higher dependence on fewer segments.
Strengths and Weaknesses Comparison
This table compares the Strengths and Weaknesses of RTX and Axon Enterprise, Inc.:
RTX Strengths
- Diversified revenues across aerospace, defense, and intelligence segments
- Strong global presence with significant US and Europe sales
- ROIC exceeds WACC, indicating value creation
- Favorable debt-to-assets ratio and interest coverage
- High fixed asset turnover signals efficient asset use
Axon Strengths
- High profitability with strong net margin and ROE
- Favorable quick ratio and excellent interest coverage
- Growing Software and Sensors segment
- Focused product offering with TASER and software
- Positive operating leverage in core business
RTX Weaknesses
- Neutral profitability metrics limit margin expansion appeal
- Elevated P/E and P/B ratios suggest valuation risk
- Quick ratio below 1 signals liquidity constraint
- Moderate asset turnover may hinder growth efficiency
Axon Weaknesses
- Low ROIC relative to WACC implies value destruction
- Very high P/E and P/B ratios increase valuation risk
- Higher debt-to-assets ratio with neutral status
- No dividend yield reduces income appeal
- Asset turnover below benchmark highlights operational inefficiency
RTX’s diversified business and balanced capital structure support stability but limit margin upside. Axon excels in profitability and coverage yet faces valuation and efficiency challenges. Both firms must align their strategies to leverage strengths while addressing these weaknesses.
The Moat Duel: Analyzing Competitive Defensibility
A structural moat shields long-term profits from relentless competitive pressures. Without it, earnings inevitably erode. Let’s dissect RTX Corporation and Axon Enterprise’s moats:
RTX Corporation: Diversified Aerospace Moat
RTX’s moat stems from intangible assets and scale, supported by its diversified aerospace and defense portfolio. It shows stable margins and a growing ROIC trend, indicating improving profitability. New defense contracts and aerospace innovations in 2026 may deepen this moat but global competition remains a threat.
Axon Enterprise, Inc.: Software-Driven Network Moat
Axon’s primary moat is network effects through its integrated hardware-software ecosystem for law enforcement. Despite currently shedding value, its ROIC growth signals rising efficiency. Rapid expansion of digital evidence management and real-time crime solutions could disrupt traditional defense players if executed well.
Industrial Scale vs. Network Effects: Which Moat Holds?
RTX’s broader industrial-scale moat offers more stable margin defense than Axon’s emerging network effects. While Axon’s accelerating ROIC growth is promising, RTX is better positioned to defend market share through scale and diversified contracts in 2026.
Which stock offers better returns?
The past year saw RTX Corporation’s shares surge strongly with accelerating gains, while Axon Enterprise, Inc. experienced a more modest rise overall but recent weakness in price momentum.

Trend Comparison
RTX’s stock rose 114% over the past 12 months, showing a bullish trend with accelerating price gains and moderate volatility. It peaked near 202 and bottomed around 93.
Axon’s shares gained 35% over the same period, maintaining a bullish but decelerating trend. Volatility was high, with a recent 21% price drop indicating a short-term bearish shift.
RTX outperformed Axon by a wide margin in total returns, driven by sustained acceleration and stronger buyer dominance over the year.
Target Prices
Analysts present a bullish target consensus for RTX Corporation and Axon Enterprise, Inc.
| Company | Target Low | Target High | Consensus |
|---|---|---|---|
| RTX Corporation | 168 | 235 | 214.7 |
| Axon Enterprise, Inc. | 713 | 860 | 767 |
The consensus target prices for RTX and Axon exceed their current prices of $198.66 and $414.20, respectively, signaling analyst confidence in their growth potential.

Don’t Let Luck Decide Your Entry Point
Optimize your entry points with our advanced ProRealTime indicators. You’ll get efficient buy signals with precise price targets for maximum performance. Start outperforming now!
How do institutions grade them?
This section compares the recent institutional grades assigned to RTX Corporation and Axon Enterprise, Inc.:
RTX Corporation Grades
The following table summarizes RTX Corporation’s recent grades from well-known financial institutions.
| Grading Company | Action | New Grade | Date |
|---|---|---|---|
| Citigroup | Maintain | Buy | 2026-02-05 |
| UBS | Maintain | Neutral | 2026-01-28 |
| JP Morgan | Maintain | Overweight | 2026-01-28 |
| RBC Capital | Maintain | Outperform | 2026-01-28 |
| Citigroup | Maintain | Buy | 2026-01-13 |
| UBS | Downgrade | Neutral | 2026-01-05 |
| JP Morgan | Maintain | Overweight | 2025-12-19 |
| B of A Securities | Maintain | Buy | 2025-10-27 |
| UBS | Maintain | Buy | 2025-10-22 |
| Goldman Sachs | Maintain | Neutral | 2025-10-22 |
Axon Enterprise, Inc. Grades
The following table summarizes Axon Enterprise, Inc.’s recent grades from reputable grading firms.
| Grading Company | Action | New Grade | Date |
|---|---|---|---|
| Morgan Stanley | Maintain | Overweight | 2025-12-17 |
| Barclays | Maintain | Overweight | 2025-11-06 |
| UBS | Maintain | Neutral | 2025-11-05 |
| Goldman Sachs | Maintain | Buy | 2025-11-05 |
| Piper Sandler | Maintain | Overweight | 2025-11-05 |
| JMP Securities | Maintain | Market Outperform | 2025-09-29 |
| Needham | Maintain | Buy | 2025-09-24 |
| B of A Securities | Maintain | Buy | 2025-08-06 |
| UBS | Maintain | Neutral | 2025-08-05 |
| Raymond James | Maintain | Outperform | 2025-08-05 |
Which company has the best grades?
Axon Enterprise, Inc. consistently earns high marks such as Overweight, Buy, and Outperform. RTX Corporation also receives solid Buy and Outperform grades but with more Neutral ratings. Investors may view Axon’s stronger consensus as a signal of higher confidence among analysts.
Risks specific to each company
The following categories identify critical pressure points and systemic threats facing RTX Corporation and Axon Enterprise in the challenging 2026 market environment:
1. Market & Competition
RTX Corporation
- Operates in aerospace & defense with diversified segments, facing intense global competition and cyclical defense budgets.
Axon Enterprise, Inc.
- Competes in law enforcement tech with rapid innovation pressure and emerging rivals in body cams and digital evidence management.
2. Capital Structure & Debt
RTX Corporation
- Debt-to-assets at 24%, interest coverage solid at 5.77x, moderate leverage but watchful for rising interest rates.
Axon Enterprise, Inc.
- Slightly higher debt-to-assets at 31%, very strong interest coverage of 54.75x, yet higher WACC at 10.42% signals expensive capital.
3. Stock Volatility
RTX Corporation
- Beta of 0.42 indicates low market volatility sensitivity, appealing for risk-averse investors.
Axon Enterprise, Inc.
- Beta of 1.48 reveals high volatility, exposing investors to sharp price swings amid market uncertainty.
4. Regulatory & Legal
RTX Corporation
- Subject to stringent aerospace and defense regulations globally, with potential export restrictions.
Axon Enterprise, Inc.
- Faces regulatory scrutiny on law enforcement technology, privacy, and data security risks.
5. Supply Chain & Operations
RTX Corporation
- Complex global supply chains vulnerable to geopolitical tensions and component shortages.
Axon Enterprise, Inc.
- Relies on tech hardware supply chains; smaller scale but sensitive to semiconductor and manufacturing disruptions.
6. ESG & Climate Transition
RTX Corporation
- Pressure to reduce carbon footprint in aerospace manufacturing and defense operations.
Axon Enterprise, Inc.
- ESG risks lower but must address data privacy and ethical use of surveillance technology.
7. Geopolitical Exposure
RTX Corporation
- High exposure to U.S. government defense contracts and international markets sensitive to geopolitical shifts.
Axon Enterprise, Inc.
- Primarily U.S. focused but expanding globally; geopolitical risks moderate but growing with international sales.
Which company shows a better risk-adjusted profile?
RTX’s most impactful risk lies in supply chain complexity amid geopolitical tensions, threatening timely delivery and cost control. Axon’s dominant risk is its high stock volatility combined with costly capital structure, increasing financial vulnerability. I see RTX presenting a better risk-adjusted profile, supported by its low beta and favorable debt metrics. Its Altman Z-Score in the grey zone and strong Piotroski score suggest moderate financial stability, contrasting with Axon’s safe Z-Score but weaker Piotroski score and elevated valuation multiples. These factors justify caution around Axon’s market pricing and capital costs in 2026.
Final Verdict: Which stock to choose?
RTX Corporation’s superpower lies in its steadily growing profitability and disciplined capital allocation. It demonstrates improving returns and maintains a slightly favorable moat despite shedding some value. A point of vigilance is its stretched valuation multiples and modest liquidity ratios. RTX fits well within a core portfolio seeking stable industrial growth.
Axon Enterprise’s strategic moat is its high-margin, rapidly expanding product ecosystem backed by strong recurring revenues. It offers superior income growth and a safer liquidity profile compared to RTX. However, its valuation appears stretched and it is currently shedding value on invested capital. Axon suits investors aiming for GARP with a tolerance for premium pricing.
If you prioritize consistent value creation and stable cash flow, RTX outshines as the compelling choice due to its improving returns and favorable financial health. However, if you seek aggressive growth with strong revenue momentum, Axon offers superior growth potential albeit with higher risk and valuation premiums. Each represents a distinct analytical scenario tailored to different investor profiles.
Disclaimer: Investment carries a risk of loss of initial capital. The past performance is not a reliable indicator of future results. Be sure to understand risks before making an investment decision.
Go Further
I encourage you to read the complete analyses of RTX Corporation and Axon Enterprise, Inc. to enhance your investment decisions: