Home > Comparison > Industrials > NOC vs AXON
The strategic rivalry between Northrop Grumman Corporation and Axon Enterprise, Inc. shapes the aerospace and defense sector’s evolution. Northrop Grumman operates as a capital-intensive industrial giant, delivering advanced aerospace systems and defense technologies globally. Axon Enterprise, in contrast, focuses on high-margin, technology-driven law enforcement hardware and software solutions. This analysis compares their distinct operational models to identify which company presents a superior risk-adjusted growth opportunity for diversified portfolios.
Table of contents
Companies Overview
Northrop Grumman and Axon Enterprise are pivotal players in the evolving aerospace and defense landscape.
Northrop Grumman Corporation: Aerospace & Defense Powerhouse
Northrop Grumman dominates as a global aerospace and defense leader. It generates revenue through advanced aircraft systems, missile defense, and cyber solutions. In 2026, it strategically focuses on integrating cutting-edge ISR systems and hypersonic propulsion, reinforcing its competitive edge in high-tech military innovation.
Axon Enterprise, Inc.: Innovator in Law Enforcement Tech
Axon Enterprise leads in conducted energy devices and digital evidence management. Its revenue stems from TASER products and cloud-based software for law enforcement agencies. The 2026 strategy emphasizes expanding real-time crime center capabilities and enhancing situational awareness through strategic partnerships and software innovation.
Strategic Collision: Similarities & Divergences
Northrop Grumman pursues a broad defense systems approach, while Axon specializes in law enforcement technology with a software-driven model. Both compete in public safety domains but on different fronts: aerospace dominance versus digital policing tools. Their investment profiles diverge sharply, reflecting Northrop’s vast scale and Axon’s growth-oriented innovation focus.
Income Statement Comparison
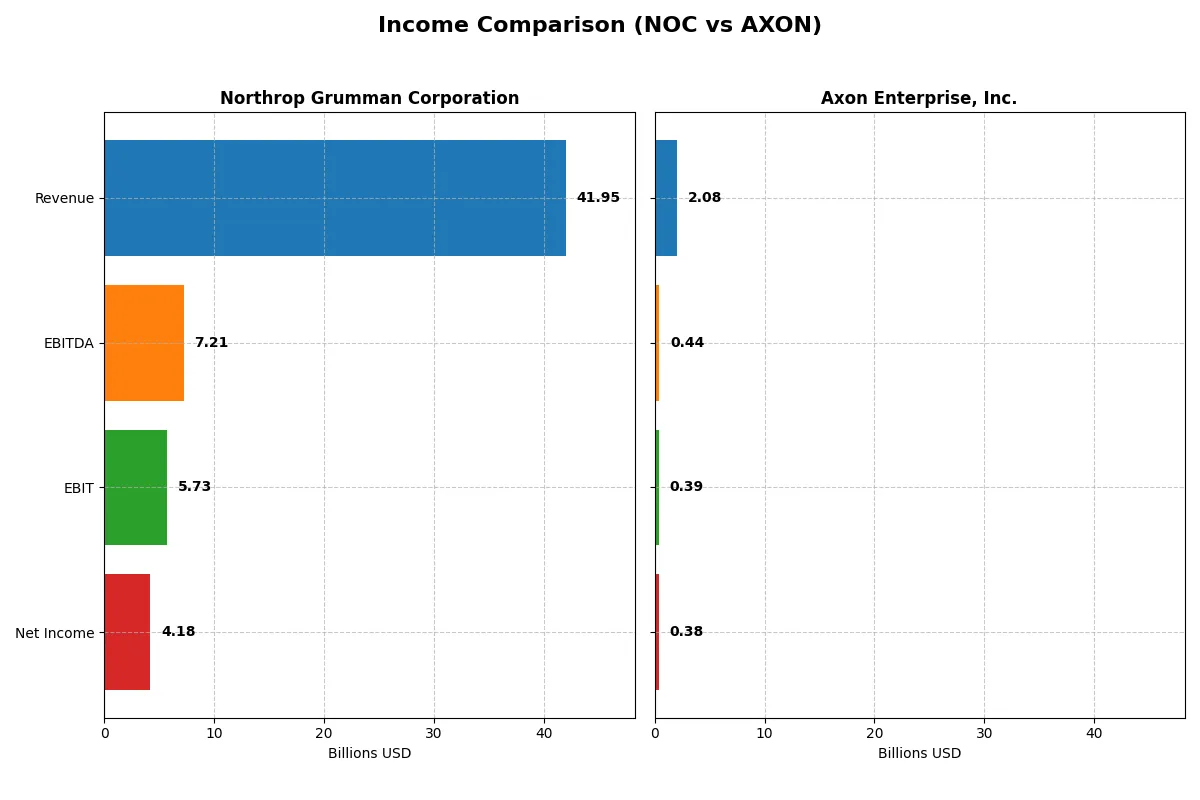
This data dissects the core profitability and scalability of both corporate engines to reveal who dominates the bottom line:
| Metric | Northrop Grumman Corporation (NOC) | Axon Enterprise, Inc. (AXON) |
|---|---|---|
| Revenue | 41.95B | 2.08B |
| Cost of Revenue | 33.64B | 841M |
| Operating Expenses | 4.03B | 1.18B |
| Gross Profit | 8.31B | 1.24B |
| EBITDA | 7.21B | 437M |
| EBIT | 5.73B | 389M |
| Interest Expense | 665M | 7.1M |
| Net Income | 4.18B | 377M |
| EPS | 29.14 | 4.98 |
| Fiscal Year | 2025 | 2024 |
Income Statement Analysis: The Bottom-Line Duel
This income statement comparison reveals which company converts sales into profits most efficiently, reflecting their true operational strength.
Northrop Grumman Corporation Analysis
Northrop Grumman’s revenue rose steadily from $35.7B in 2021 to $41.95B in 2025, showing a 17.6% growth over five years. Net income, however, declined sharply by over 40% in the same period, signaling margin pressure despite a strong gross margin near 20%. The 2025 net margin of 9.97% remains solid, supported by favorable EBIT margin of 13.66%, indicating operational resilience amid slower revenue growth.
Axon Enterprise, Inc. Analysis
Axon Enterprise’s revenue surged from $681M in 2020 to $2.08B in 2024, marking over 200% expansion. Net income exploded from a loss in 2020 to $377M in 2024, driving net margin to a healthy 18.1%. The company’s gross margin above 59% and EBIT margin near 19% highlight superior profitability and scaling efficiency. Recent years show accelerating momentum with EBITDA and EPS growth exceeding 100%, underscoring Axon’s rapid operational improvement.
Verdict: Established Scale vs. Rapid Margin Expansion
Northrop Grumman delivers consistent revenue scale with stable but declining net income, reflecting mature industry dynamics and margin headwinds. Axon outpaces with exceptional top- and bottom-line growth, boosted by high margins and expanding profitability. For investors, Northrop offers steady cash flow potential, while Axon’s profile suits those seeking aggressive earnings growth and margin expansion.
Financial Ratios Comparison
These vital ratios act as a diagnostic tool to expose the underlying fiscal health, valuation premiums, and capital efficiency of the companies compared below:
| Ratios | Northrop Grumman Corporation (NOC) | Axon Enterprise, Inc. (AXON) |
|---|---|---|
| ROE | 25.1% | 16.2% |
| ROIC | 9.9% | 1.7% |
| P/E | 19.6 | 119.4 |
| P/B | 4.91 | 19.34 |
| Current Ratio | 1.10 | 1.37 |
| Quick Ratio | 1.10 | 1.21 |
| D/E (Debt-to-Equity) | 0.11 | 0.60 |
| Debt-to-Assets | 3.6% | 31.3% |
| Interest Coverage | -6.78 | 8.25 |
| Asset Turnover | 0.82 | 0.47 |
| Fixed Asset Turnover | 3.27 | 8.42 |
| Payout Ratio | 31% | 0% |
| Dividend Yield | 1.58% | 0% |
| Fiscal Year | 2025 | 2024 |
Efficiency & Valuation Duel: The Vital Signs
Financial ratios act as a company’s DNA, revealing hidden risks and operational excellence that shape investment decisions.
Northrop Grumman Corporation
Northrop Grumman delivers strong profitability with a 25% ROE and a neutral net margin near 10%. Its P/E of 19.6 signals fair valuation, though a high P/B at 4.9 appears stretched. The firm supports shareholders with a 1.58% dividend yield, balancing capital allocation between stable returns and reinvestment.
Axon Enterprise, Inc.
Axon shows a higher net margin of 18.1% but a lower 16.2% ROE. Its valuation appears stretched with a P/E of 119.4 and a P/B of 19.3, indicating market optimism. The company pays no dividend, focusing heavily on R&D and growth investments, reflected in high SG&A and stock-based compensation ratios.
Premium Valuation vs. Operational Safety
Northrop Grumman offers a more balanced risk-reward profile with solid profitability and modest valuation metrics. Axon’s premium multiples and no dividend highlight growth ambitions but increase valuation risk. Investors seeking stability may prefer Northrop, while growth-focused profiles might consider Axon’s innovation-driven strategy.
Which one offers the Superior Shareholder Reward?
I compare Northrop Grumman Corporation (NOC) and Axon Enterprise, Inc. (AXON) on distribution philosophies, dividend yields, payout ratios, and buyback intensity. NOC yields 1.58% with a 31% payout ratio, sustainably covered by 70% FCF. AXON pays no dividends but reinvests heavily in growth, supported by 81% FCF buyback coverage. NOC’s consistent dividends and moderate buybacks offer steady income and capital return. AXON’s zero dividend and high valuation (P/E ~119) reflect growth bets with limited immediate shareholder payback. I find NOC’s balanced distribution model more sustainable and attractive for total returns in 2026.
Comparative Score Analysis: The Strategic Profile
The radar chart reveals the fundamental DNA and trade-offs of Northrop Grumman Corporation and Axon Enterprise, Inc., exposing their financial strengths and vulnerabilities:
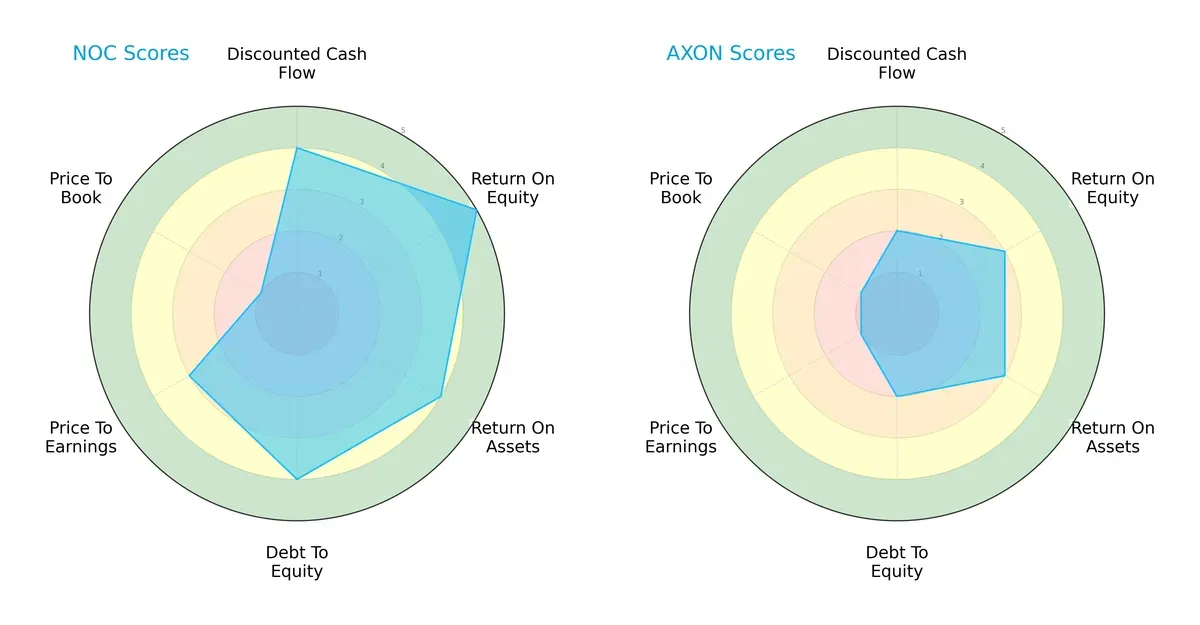
Northrop Grumman shows a balanced profile with strong ROE (5) and ROA (4), solid debt management (4), and favorable DCF (4). Axon lags with moderate scores across the board, relying on no particular edge. Notably, Northrop’s valuation scores reveal a steep price-to-book disadvantage (1), signaling market skepticism despite operational strength. Axon suffers from weaker valuation and leverage metrics, indicating higher financial risk and less efficient capital allocation.
Bankruptcy Risk: Solvency Showdown
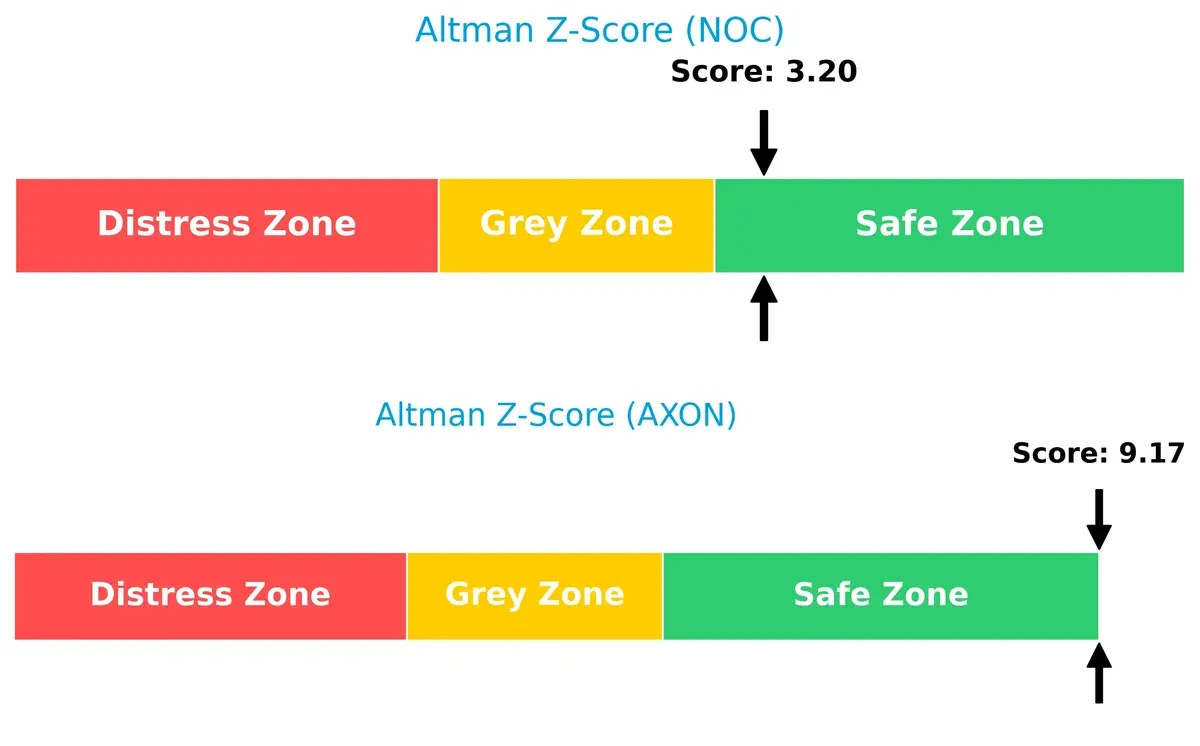
Northrop Grumman and Axon Enterprise both reside in the safe zone by Altman Z-Score, but Axon’s 9.17 score far exceeds Northrop’s 3.20, implying a stronger buffer against bankruptcy in volatile cycles:
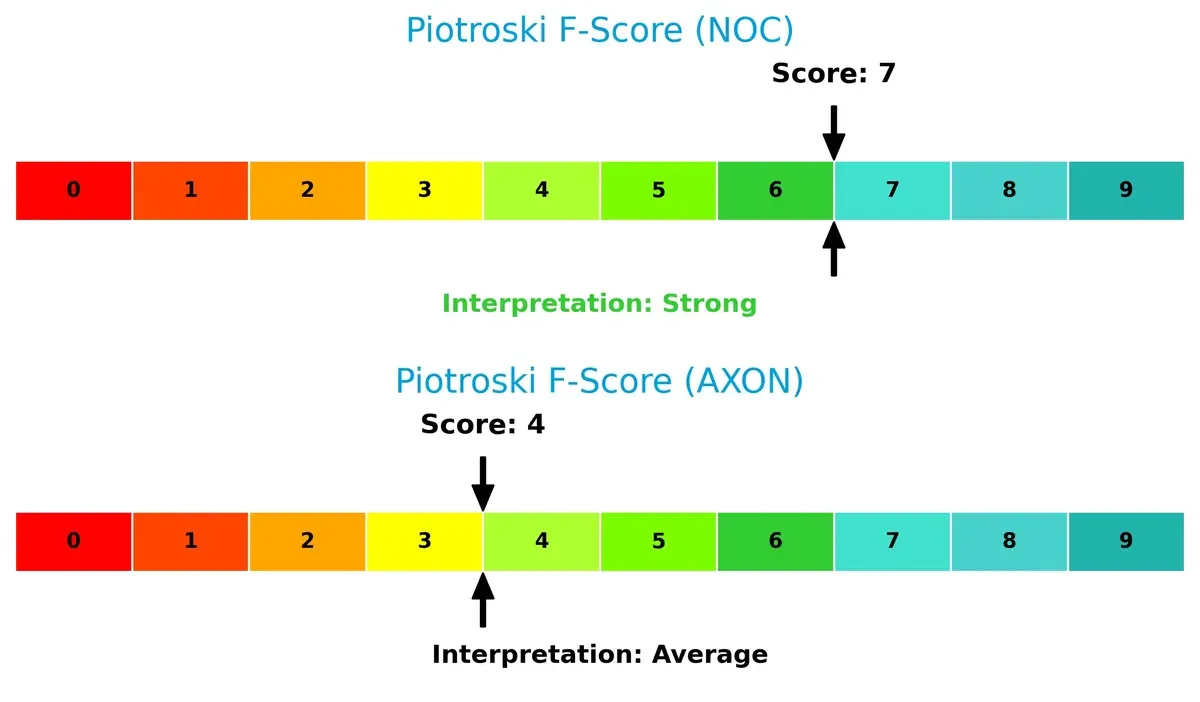
Financial Health: Quality of Operations
Northrop Grumman’s Piotroski F-Score of 7 indicates robust financial health and operational quality. Axon’s score of 4 flags moderate risk and weaker internal controls, suggesting potential red flags in profitability or liquidity:
How are the two companies positioned?
This section dissects the operational DNA of Northrop Grumman and Axon by comparing their revenue distribution by segment and internal dynamics. The goal is to confront their economic moats and identify which business model offers the most resilient, sustainable competitive advantage today.
Revenue Segmentation: The Strategic Mix
The following visual comparison dissects how Northrop Grumman Corporation and Axon Enterprise, Inc. diversify their income streams and where their primary sector bets lie:
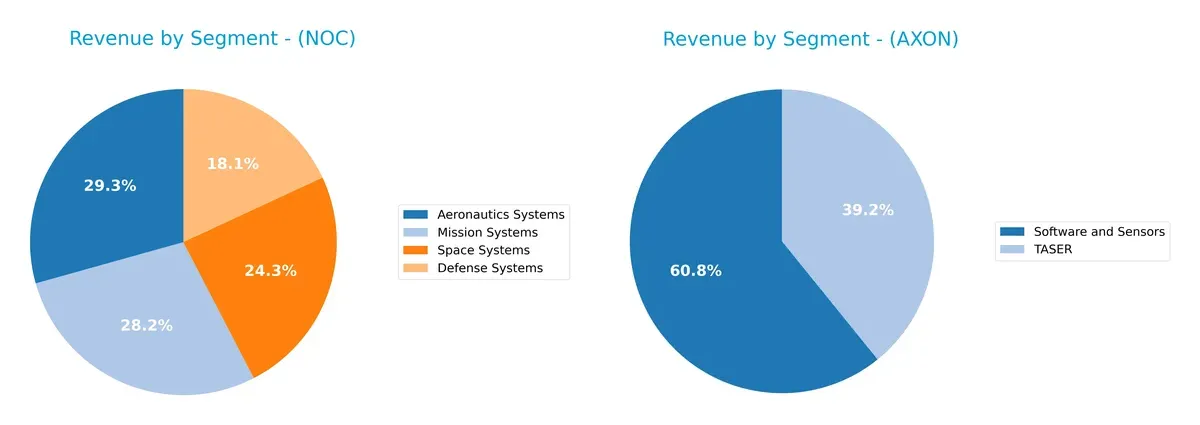
Northrop Grumman dwarfs Axon in scale and diversification, with four robust aerospace and defense segments ranging from $8B to $13B. It avoids concentration risk by anchoring revenue across Aeronautics, Mission, Space, and Defense Systems. Axon pivots around two key segments, Software and Sensors ($951M) and TASER ($613M), revealing reliance on a narrower product ecosystem. Northrop’s broad portfolio signals infrastructure dominance; Axon’s focus suggests concentrated innovation but higher vulnerability to market shifts.
Strengths and Weaknesses Comparison
This table compares the strengths and weaknesses of Northrop Grumman Corporation and Axon Enterprise, Inc.:
Northrop Grumman Corporation Strengths
- Diversified revenue across Aeronautics, Defense, Mission, and Space Systems
- Favorable ROE at 25.08% exceeds typical industry benchmarks
- Low debt-to-assets at 3.61% supports financial stability
- Strong fixed asset turnover at 3.27 indicating efficient asset use
- Global presence with significant US, Europe, and Asia Pacific sales
Axon Enterprise, Inc. Strengths
- High net margin at 18.1% signaling strong profitability
- Favorable interest coverage at 54.75 showing robust debt service ability
- Favorable fixed asset turnover at 8.42 reflecting efficient capital use
- Growing US and international sales with expanding non-US presence
- Favorable quick ratio at 1.21 indicating liquidity strength
Northrop Grumman Corporation Weaknesses
- Neutral net margin at 9.97% limits profitability upside
- Unfavorable PB ratio at 4.91 suggests valuation premium risk
- Current ratio at 1.1 is barely above liquidity caution threshold
- Neutral asset turnover at 0.82 may indicate moderate sales efficiency
- Limited innovation data restricts competitive edge assessment
Axon Enterprise, Inc. Weaknesses
- Low ROIC at 1.66% below WACC at 10.18% impairs capital returns
- High PE at 119.4 and PB at 19.34 imply overvaluation risks
- Asset turnover low at 0.47 signals weak operational efficiency
- No dividend yield reduces appeal to income-focused investors
- Debt-to-assets at 31.33% elevates financial leverage risk
Northrop Grumman’s strengths lie in diversified operations and conservative financial leverage. Axon excels in profitability and asset efficiency but faces challenges with valuation and capital returns. Each company’s weaknesses highlight areas critical for strategic focus.
The Moat Duel: Analyzing Competitive Defensibility
A structural moat is the only true shield protecting long-term profits from relentless competition erosion. Let’s dissect the competitive defenses of two leaders in aerospace and defense:
Northrop Grumman Corporation: Intangible Assets with Scale and Integration
Northrop’s moat stems from deep intangible assets and integrated systems expertise, reflected in a ROIC 5.5% above WACC. Margin stability supports defense contract durability. However, declining ROIC signals challenges ahead in sustaining profitability by 2026.
Axon Enterprise, Inc.: Rapid Innovation with Network Effects
Axon’s moat hinges on network effects from its integrated hardware-software ecosystem, fueling robust 582% ROIC growth despite current value destruction. Its soaring revenue and earnings growth suggest expanding market influence and disruption potential beyond traditional defense.
Intangible Assets vs. Network Effects: Scale and Innovation in Defense
Northrop’s wider moat benefits from entrenched government contracts and high barriers to entry. Axon innovates rapidly but must convert growth into sustained value creation. I see Northrop better positioned today to defend market share, though Axon’s evolving ecosystem demands close monitoring.
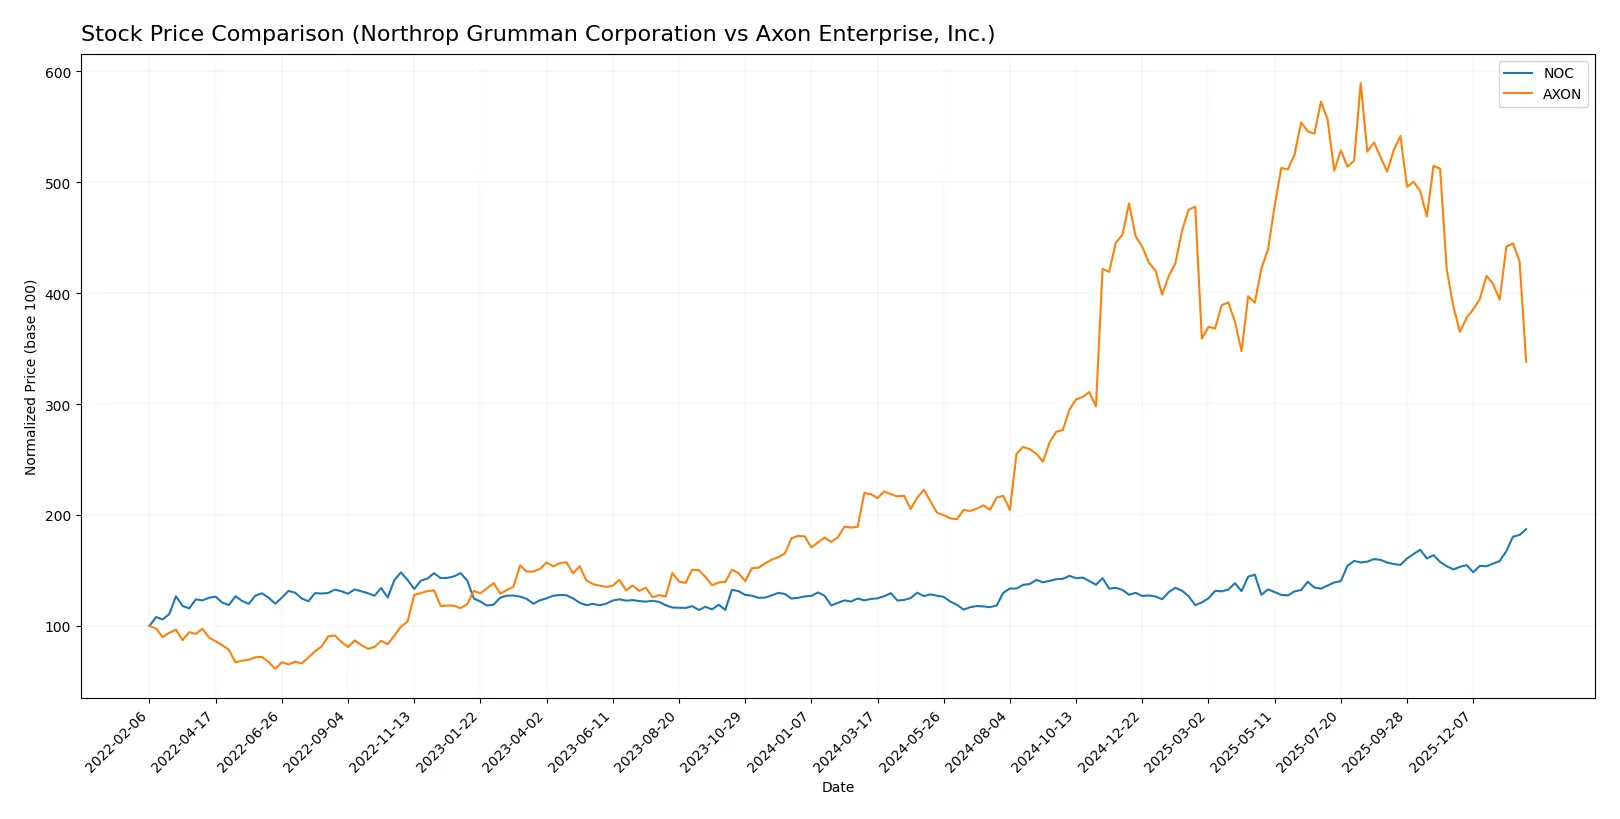
Which stock offers better returns?
The past year revealed contrasting dynamics: Northrop Grumman’s stock rose steadily with accelerating gains, while Axon’s price showed higher volatility and recent decline.
Trend Comparison
Northrop Grumman’s stock gained 50.66% over 12 months, showing a bullish trend with accelerating momentum and a high near 692.26. Volatility is moderate with a 57.5 std deviation.
Axon’s stock increased 54.6% over the year, also bullish but with decelerating gains. It exhibited significant volatility (170.39 std deviation) and a recent negative trend of -12.77%.
Axon delivered slightly higher annual returns but faces recent weakness. Northrop Grumman’s accelerating trend contrasts with Axon’s recent deceleration and loss of momentum.
Target Prices
Analysts present bullish target price ranges for Northrop Grumman Corporation and Axon Enterprise, Inc.
| Company | Target Low | Target High | Consensus |
|---|---|---|---|
| Northrop Grumman Corporation | 623 | 815 | 736.09 |
| Axon Enterprise, Inc. | 713 | 900 | 814.78 |
The consensus targets exceed Northrop Grumman’s current price of 692.26 by about 6%. Axon’s target consensus is significantly above its 483.58 share price, suggesting strong growth expectations.

Don’t Let Luck Decide Your Entry Point
Optimize your entry points with our advanced ProRealTime indicators. You’ll get efficient buy signals with precise price targets for maximum performance. Start outperforming now!
How do institutions grade them?
Northrop Grumman Corporation Grades
The table below summarizes recent grades from major financial institutions for Northrop Grumman Corporation.
| Grading Company | Action | New Grade | Date |
|---|---|---|---|
| BTIG | Maintain | Buy | 2026-01-28 |
| UBS | Maintain | Buy | 2026-01-28 |
| RBC Capital | Maintain | Outperform | 2026-01-28 |
| B of A Securities | Maintain | Buy | 2026-01-28 |
| Citigroup | Maintain | Buy | 2026-01-28 |
| UBS | Maintain | Buy | 2026-01-15 |
| Citigroup | Maintain | Buy | 2026-01-13 |
| Truist Securities | Downgrade | Hold | 2026-01-09 |
| Morgan Stanley | Maintain | Overweight | 2025-12-16 |
| Alembic Global | Upgrade | Overweight | 2025-12-15 |
Axon Enterprise, Inc. Grades
Below is the summary of recent grades from reputable institutions for Axon Enterprise, Inc.
| Grading Company | Action | New Grade | Date |
|---|---|---|---|
| Morgan Stanley | Maintain | Overweight | 2025-12-17 |
| Barclays | Maintain | Overweight | 2025-11-06 |
| Piper Sandler | Maintain | Overweight | 2025-11-05 |
| UBS | Maintain | Neutral | 2025-11-05 |
| Goldman Sachs | Maintain | Buy | 2025-11-05 |
| JMP Securities | Maintain | Market Outperform | 2025-09-29 |
| Needham | Maintain | Buy | 2025-09-24 |
| B of A Securities | Maintain | Buy | 2025-08-06 |
| Raymond James | Maintain | Outperform | 2025-08-05 |
| Craig-Hallum | Upgrade | Buy | 2025-08-05 |
Which company has the best grades?
Northrop Grumman displays predominantly Buy and Outperform ratings, with only one Hold downgrade, signaling strong institutional confidence. Axon’s grades cluster around Overweight and Buy, with a broader range including Neutral and Hold upgrades. Investors may perceive Northrop Grumman as having slightly more consistent positive sentiment.
Risks specific to each company
The following categories identify the critical pressure points and systemic threats facing both firms in the 2026 market environment:
1. Market & Competition
Northrop Grumman Corporation
- Operates in a mature aerospace and defense sector with strong government contracts but faces intense competition for large defense budgets.
Axon Enterprise, Inc.
- Faces fierce competition in law enforcement technology with innovation pressure and dependence on public sector spending cycles.
2. Capital Structure & Debt
Northrop Grumman Corporation
- Maintains low debt-to-equity ratio (0.11), indicating strong balance sheet and financial stability.
Axon Enterprise, Inc.
- Higher debt-to-equity ratio (0.6) poses moderate financial risk, though interest coverage remains very strong.
3. Stock Volatility
Northrop Grumman Corporation
- Exhibits very low beta (0.049), reflecting stable stock with limited market risk exposure.
Axon Enterprise, Inc.
- High beta (1.414) signals significant stock price volatility and higher market risk.
4. Regulatory & Legal
Northrop Grumman Corporation
- Must comply with stringent defense regulations and export controls, risking contract delays or penalties.
Axon Enterprise, Inc.
- Faces regulatory scrutiny on law enforcement equipment use and data privacy in digital evidence management.
5. Supply Chain & Operations
Northrop Grumman Corporation
- Complex global supply chain vulnerable to geopolitical disruptions but benefits from long-term government contracts.
Axon Enterprise, Inc.
- Relies on hardware manufacturing and cloud infrastructure, exposing it to tech supply chain and cybersecurity risks.
6. ESG & Climate Transition
Northrop Grumman Corporation
- Aerospace and defense sector faces growing ESG pressures, particularly on emissions and ethical concerns.
Axon Enterprise, Inc.
- Increasing demand for transparency on product impact and corporate governance amid social justice movements.
7. Geopolitical Exposure
Northrop Grumman Corporation
- High exposure due to reliance on U.S. and allied defense spending amid global tensions.
Axon Enterprise, Inc.
- Limited direct geopolitical risk, but indirect exposure through international law enforcement partnerships.
Which company shows a better risk-adjusted profile?
Northrop Grumman faces its largest risk in geopolitical and regulatory exposure but boasts a rock-solid capital structure and low stock volatility. Axon’s highest risk lies in market competition and valuation volatility, exacerbated by a weaker capital structure and stretched valuation multiples. Given these factors, Northrop Grumman presents a stronger risk-adjusted profile. Its Altman Z-Score above 3 and favorable debt metrics underscore financial resilience. Meanwhile, Axon’s sky-high PE ratio and beta reveal elevated risk levels demanding caution.
Final Verdict: Which stock to choose?
Northrop Grumman’s superpower lies in its robust capital efficiency and consistent value creation. Its disciplined use of invested capital supports a strong moat, despite a cautious note on its slightly declining profitability. This stock suits portfolios aiming for steady, slightly favorable risk-adjusted returns in the industrial defense sector.
Axon Enterprise stands out with its strategic moat rooted in rapid innovation and recurring revenue streams from law enforcement technologies. While it carries a higher valuation premium and less capital efficiency, its accelerating profitability trend offers growth potential with somewhat higher risk tolerance. It fits well within a growth-at-a-reasonable-price (GARP) or innovation-focused portfolio.
If you prioritize proven capital discipline and stable value creation, Northrop Grumman is the compelling choice due to its safer financial footing and solid income metrics. However, if you seek dynamic growth and are comfortable with valuation risks, Axon offers superior top-line momentum and an expanding profitability profile. Both demand careful risk management given their distinct profiles.
Disclaimer: Investment carries a risk of loss of initial capital. The past performance is not a reliable indicator of future results. Be sure to understand risks before making an investment decision.
Go Further
I encourage you to read the complete analyses of Northrop Grumman Corporation and Axon Enterprise, Inc. to enhance your investment decisions: