Home > Comparison > Industrials > LHX vs AXON
The strategic rivalry between L3Harris Technologies and Axon Enterprise defines the evolving Aerospace & Defense landscape. L3Harris operates as a capital-intensive industrial giant with broad mission-critical systems, while Axon focuses on innovative, high-margin law enforcement technology solutions. This head-to-head highlights a classic contrast: diversified defense manufacturing versus specialized tech-driven growth. This analysis will clarify which trajectory offers superior risk-adjusted returns for a well-balanced, diversified portfolio.
Table of contents
Companies Overview
L3Harris Technologies and Axon Enterprise both shape critical segments within the aerospace and defense industry. Their market roles reflect evolving demands for security and tactical innovation.
L3Harris Technologies, Inc.: Aerospace & Defense Innovator
L3Harris dominates with mission-critical aerospace and defense technology. Its revenue stems from integrated mission systems, communication, and space and airborne systems. In 2026, L3Harris focuses strategically on enhancing ISR capabilities and advanced electronic warfare, fortifying government and commercial contracts worldwide.
Axon Enterprise, Inc.: Public Safety Technology Leader
Axon excels as a provider of conducted energy devices and digital evidence solutions. Its core income arises from TASER products and cloud-based software for law enforcement. The company’s 2026 strategy centers on expanding real-time crime center technologies and integrating hardware with cloud software to boost public safety outcomes.
Strategic Collision: Similarities & Divergences
Both firms emphasize defense and security technology but diverge sharply in approach. L3Harris pursues a broad, integrated aerospace systems model, while Axon specializes in focused law enforcement hardware and software. Their competition plays out in the digital and tactical security domains. Investors will find L3Harris offers scale and diversification, whereas Axon delivers innovation in a niche market.
Income Statement Comparison
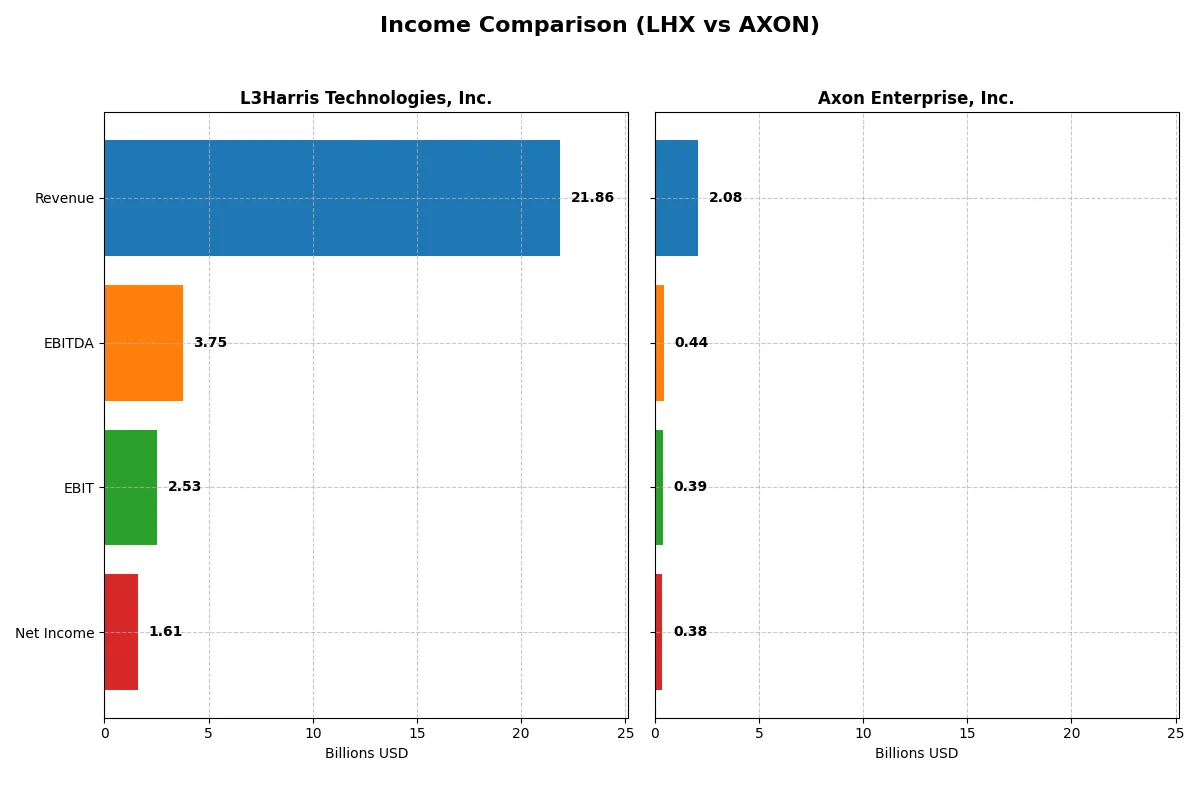
This data dissects the core profitability and scalability of both corporate engines to reveal who dominates the bottom line:
| Metric | L3Harris Technologies, Inc. (LHX) | Axon Enterprise, Inc. (AXON) |
|---|---|---|
| Revenue | 21.9B | 2.1B |
| Cost of Revenue | 16.2B | 841M |
| Operating Expenses | 3.4B | 1.2B |
| Gross Profit | 5.6B | 1.2B |
| EBITDA | 3.8B | 437M |
| EBIT | 2.5B | 389M |
| Interest Expense | 597M | 7.1M |
| Net Income | 1.6B | 377M |
| EPS | 8.57 | 4.98 |
| Fiscal Year | 2025 | 2024 |
Income Statement Analysis: The Bottom-Line Duel
This income statement comparison reveals how efficiently each company converts sales into profit and manages costs amid evolving market dynamics.
L3Harris Technologies, Inc. Analysis
L3Harris steadily grows revenue, hitting $21.9B in 2025 with a $1.6B net income. Its gross margin expands to 25.7%, reflecting solid cost control. Net margin holds at 7.35%, indicating moderate profitability. Despite slower revenue growth (2.5% last year), EBIT margin improvement (11.6%) signals operational momentum and disciplined expense management.
Axon Enterprise, Inc. Analysis
Axon surges with 33.4% revenue growth to $2.08B in 2024, earning $377M net income. Gross margin impresses at 59.6%, showcasing premium pricing or efficient production. Net margin of 18.1% doubles L3Harris’s, while EBIT margin climbs to 18.7%. Rapid margin expansion and strong EPS growth reflect high operational leverage and growth momentum.
Margin Strength vs. Revenue Scale
Axon’s superior margin profile and explosive growth outpace L3Harris’s larger revenue base and steadier margins. Axon’s exceptional profitability and growth metrics position it as a high-momentum player. L3Harris offers scale with consistent profitability but slower expansion. Investors may prefer Axon’s dynamic profile or L3Harris’s established revenue foundation depending on risk appetite.
Financial Ratios Comparison
These vital ratios act as a diagnostic tool to expose the underlying fiscal health, valuation premiums, and capital efficiency of the companies compared below:
| Ratios | L3Harris Technologies, Inc. (LHX) | Axon Enterprise, Inc. (AXON) |
|---|---|---|
| ROE | 8.18% | 16.20% |
| ROIC | 5.37% | 1.66% |
| P/E | 34.26 | 119.40 |
| P/B | 2.80 | 19.34 |
| Current Ratio | 1.19 | 1.37 |
| Quick Ratio | 1.02 | 1.21 |
| D/E | 0.53 | 0.60 |
| Debt-to-Assets | 25.35% | 31.33% |
| Interest Coverage | 3.68 | 8.25 |
| Asset Turnover | 0.53 | 0.47 |
| Fixed Asset Turnover | 8.20 | 8.42 |
| Payout ratio | 56.23% | 0% |
| Dividend yield | 1.64% | 0% |
| Fiscal Year | 2025 | 2024 |
Efficiency & Valuation Duel: The Vital Signs
Ratios serve as a company’s DNA, uncovering hidden risks and operational strengths crucial for sound investment decisions.
L3Harris Technologies, Inc.
L3Harris posts a modest 8.18% ROE and stable 7.35% net margin, reflecting operational steadiness but limited profitability. Its P/E ratio of 34.26 signals a stretched valuation relative to earnings. The company balances shareholder returns with a 1.64% dividend yield and cautious reinvestment, maintaining financial discipline amid moderate growth.
Axon Enterprise, Inc.
Axon exhibits a robust 16.2% ROE and a strong 18.1% net margin, demonstrating superior profitability. However, the stock trades at a steep P/E of 119.4 and a high P/B of 19.34, indicating an expensive valuation. Axon reinvests heavily into R&D and growth initiatives, foregoing dividends to fuel future expansion.
Premium Valuation vs. Operational Safety
L3Harris offers a balanced profile with reasonable valuation and consistent shareholder returns, while Axon commands a premium price driven by growth prospects but carries higher valuation risk. Conservative investors may prefer L3Harris’s stability; growth-oriented investors might lean toward Axon’s aggressive expansion.
Which one offers the Superior Shareholder Reward?
I compare L3Harris Technologies, Inc. (LHX) and Axon Enterprise, Inc. (AXON) on their shareholder reward models. LHX pays a consistent dividend yield around 1.6–2.2% with a sustainable payout ratio near 56%. Its free cash flow comfortably covers dividends and capex, signaling steady cash returns. LHX also supports buybacks, enhancing total shareholder return. AXON, by contrast, pays no dividend, focusing on reinvestment in R&D and growth, reflected in its high price multiples (P/E ~119) and strong profit margins (~18%). Its buybacks appear minimal, limiting immediate cash returns. Historically, LHX’s balanced dividend and buyback approach offers more sustainable and reliable shareholder rewards. In 2026, I favor LHX for a superior total return profile due to its prudent capital allocation and consistent cash distributions.
Comparative Score Analysis: The Strategic Profile
The radar chart reveals the fundamental DNA and trade-offs of L3Harris Technologies, Inc. and Axon Enterprise, Inc., illustrating their core financial strengths and vulnerabilities:
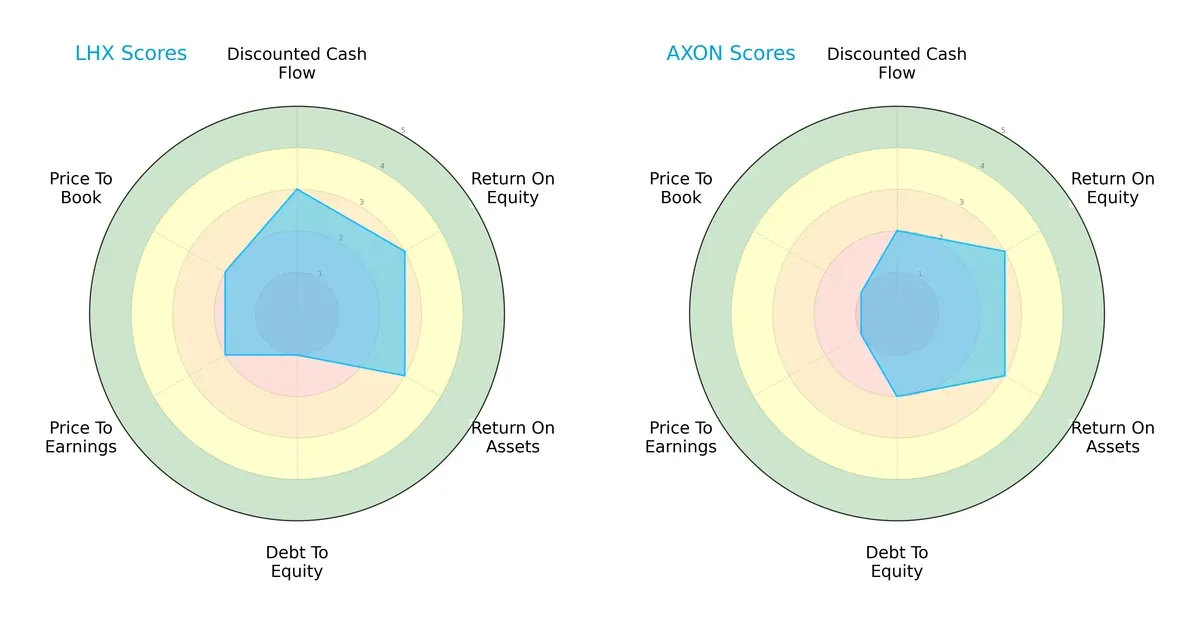
L3Harris boasts higher scores in discounted cash flow and valuation metrics, showing better market pricing and cash generation. Axon matches L3Harris on profitability (ROE, ROA) but maintains a healthier debt profile. L3Harris’s weak debt-to-equity score signals financial risk, while Axon’s valuation scores indicate potential overvaluation. Overall, L3Harris displays a more balanced profile, leveraging valuation and cash flow, whereas Axon relies on operational efficiency and lower leverage.
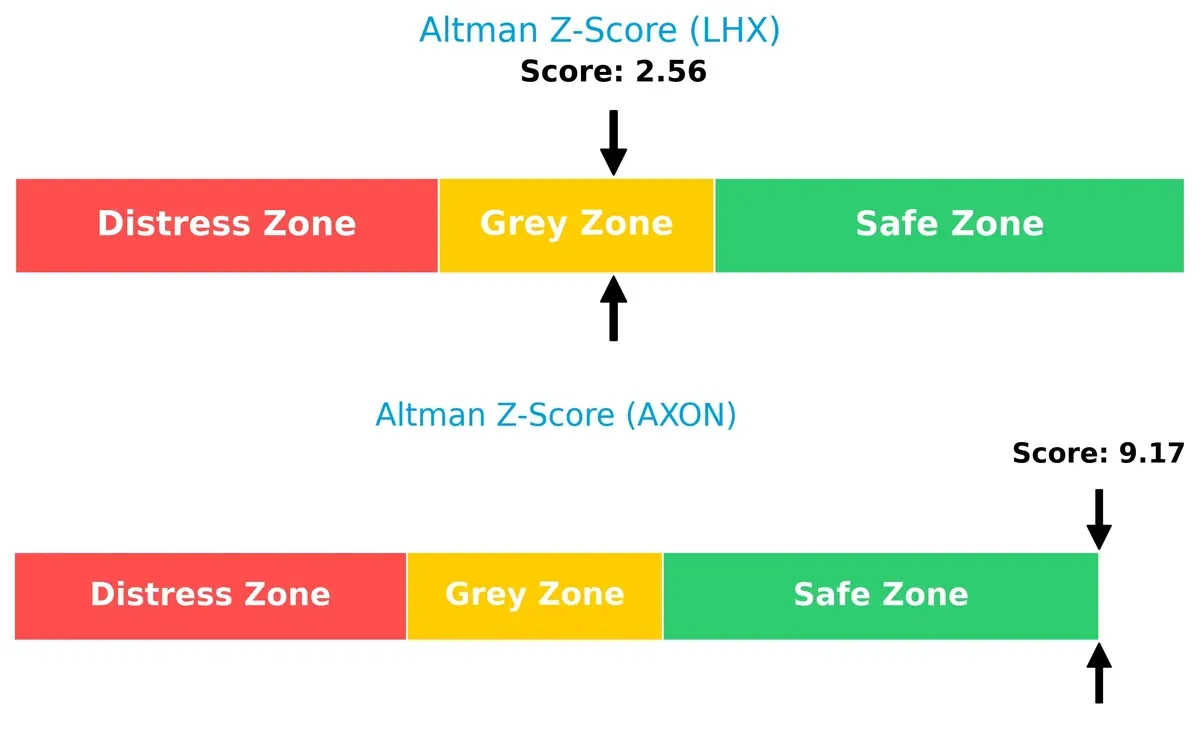
Bankruptcy Risk: Solvency Showdown
The Altman Z-Score gap highlights Axon’s superior solvency, firmly in the safe zone, while L3Harris lingers in the grey zone, signaling moderate bankruptcy risk in this cycle:
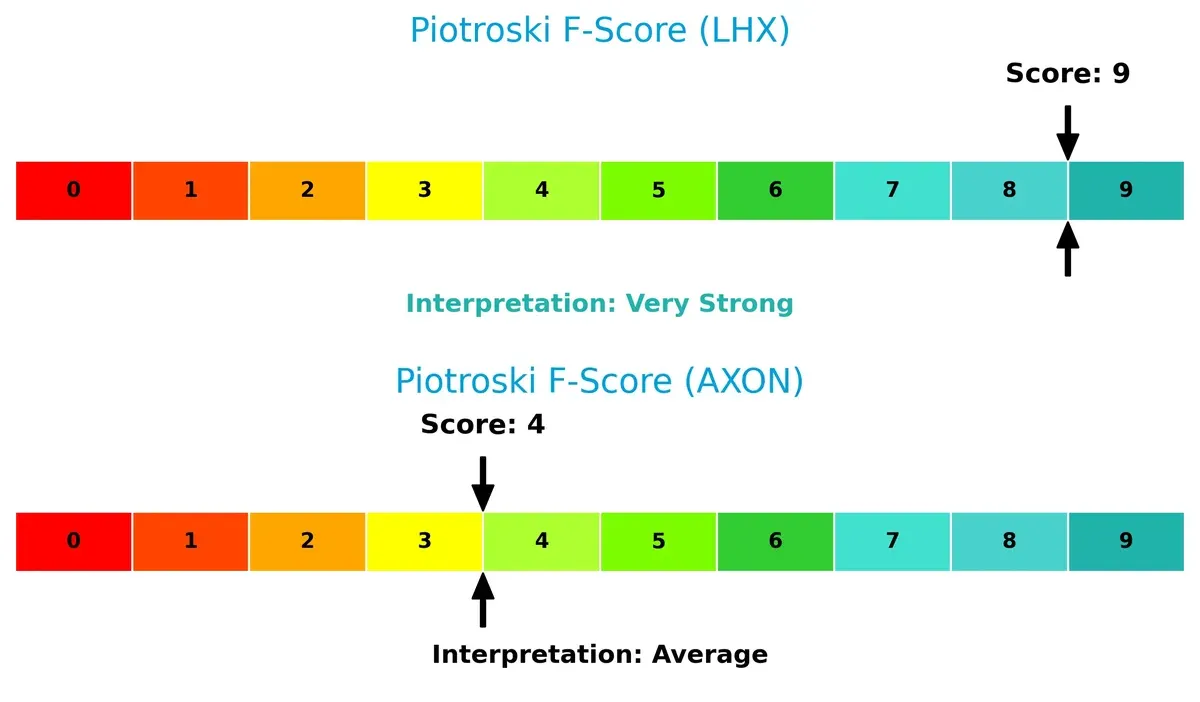
Financial Health: Quality of Operations
L3Harris scores a perfect 9 on the Piotroski F-Score, signifying peak financial health and operational strength. Axon’s 4 suggests average health, raising caution about its internal metrics compared to L3Harris:
How are the two companies positioned?
This section dissects LHX and AXON’s operational DNA by comparing their revenue distribution and internal strengths and weaknesses. The goal is to confront their economic moats and identify which model offers the most resilient, sustainable competitive advantage today.
Revenue Segmentation: The Strategic Mix
This visual comparison dissects how L3Harris Technologies and Axon Enterprise diversify their income streams and where their primary sector bets lie:
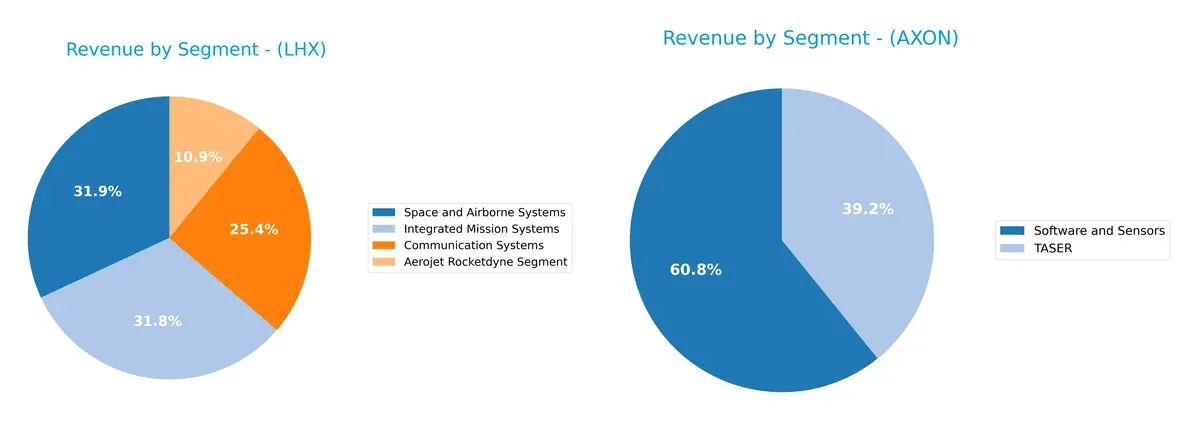
L3Harris dominates with four strong segments, including $6.8B in Space and Airborne Systems, showing a well-balanced portfolio. Axon relies heavily on Software and Sensors at $951M and TASER at $613M, revealing concentration risk. L3Harris’s diversified mix anchors its defense ecosystem, reducing volatility. Axon’s focus pivots on law enforcement tech, making it vulnerable to sector shifts despite strong niche positioning.
Strengths and Weaknesses Comparison
This table compares the Strengths and Weaknesses of L3Harris Technologies and Axon Enterprise:
LHX Strengths
- Diverse revenue streams across four segments including Communication and Space Systems
- Favorable weighted average cost of capital (6.65%) supports capital efficiency
- Strong fixed asset turnover (8.2) indicates effective asset use
- Favorable quick ratio (1.02) suggests good short-term liquidity
AXON Strengths
- High net margin (18.1%) and return on equity (16.2%) demonstrate strong profitability
- Favorable interest coverage (54.75) indicates robust debt servicing ability
- Favorable quick ratio (1.21) supports liquidity
- Strong fixed asset turnover (8.42) shows efficient use of fixed assets
LHX Weaknesses
- Return on equity (8.18%) below cost of capital, signaling value creation challenges
- Elevated price-to-earnings ratio (34.26) may indicate overvaluation
- Moderate current ratio (1.19) is neutral but suggests limited cushion
- Neutral net margin (7.35%) is lower than Axon
AXON Weaknesses
- Low return on invested capital (1.66%) below WACC (10.18%) reflects poor capital efficiency
- High valuation multiples (PE 119.4, PB 19.34) imply market exuberance
- Unfavorable asset turnover (0.47) points to less efficient asset use
- Zero dividend yield limits income potential
Overall, L3Harris benefits from diversified revenue and capital efficiency but faces profitability and valuation headwinds. Axon excels in profitability and liquidity but contends with high valuation and inefficient capital use. These factors shape each company’s strategic focus on balancing growth and financial discipline.
The Moat Duel: Analyzing Competitive Defensibility
A structural moat is a company’s only defense against profit erosion from competition over the long term:
L3Harris Technologies, Inc.: Integrated Systems and Mission-Critical Defense Moat
LHX relies on its complex, government-grade aerospace and defense systems. This intangible asset moat drives stable margins but declining ROIC signals growing competitive pressure in 2026.
Axon Enterprise, Inc.: Software-Enabled Public Safety Ecosystem Moat
Axon’s moat centers on network effects from its TASER hardware and cloud-based evidence management software. Its accelerating ROIC trend suggests expanding profitability and market footprint in 2026.
Verdict: Complex Defense Systems vs. Scalable Software Ecosystem
LHX’s deep government ties face margin pressure and shrinking value creation. Axon’s growing ROIC and software integration offer a more durable, scalable moat. I view Axon as better positioned to defend and expand market share.
Which stock offers better returns?
Over the past 12 months, L3Harris Technologies, Inc. and Axon Enterprise, Inc. exhibited strong price gains with contrasting momentum and volatility profiles.
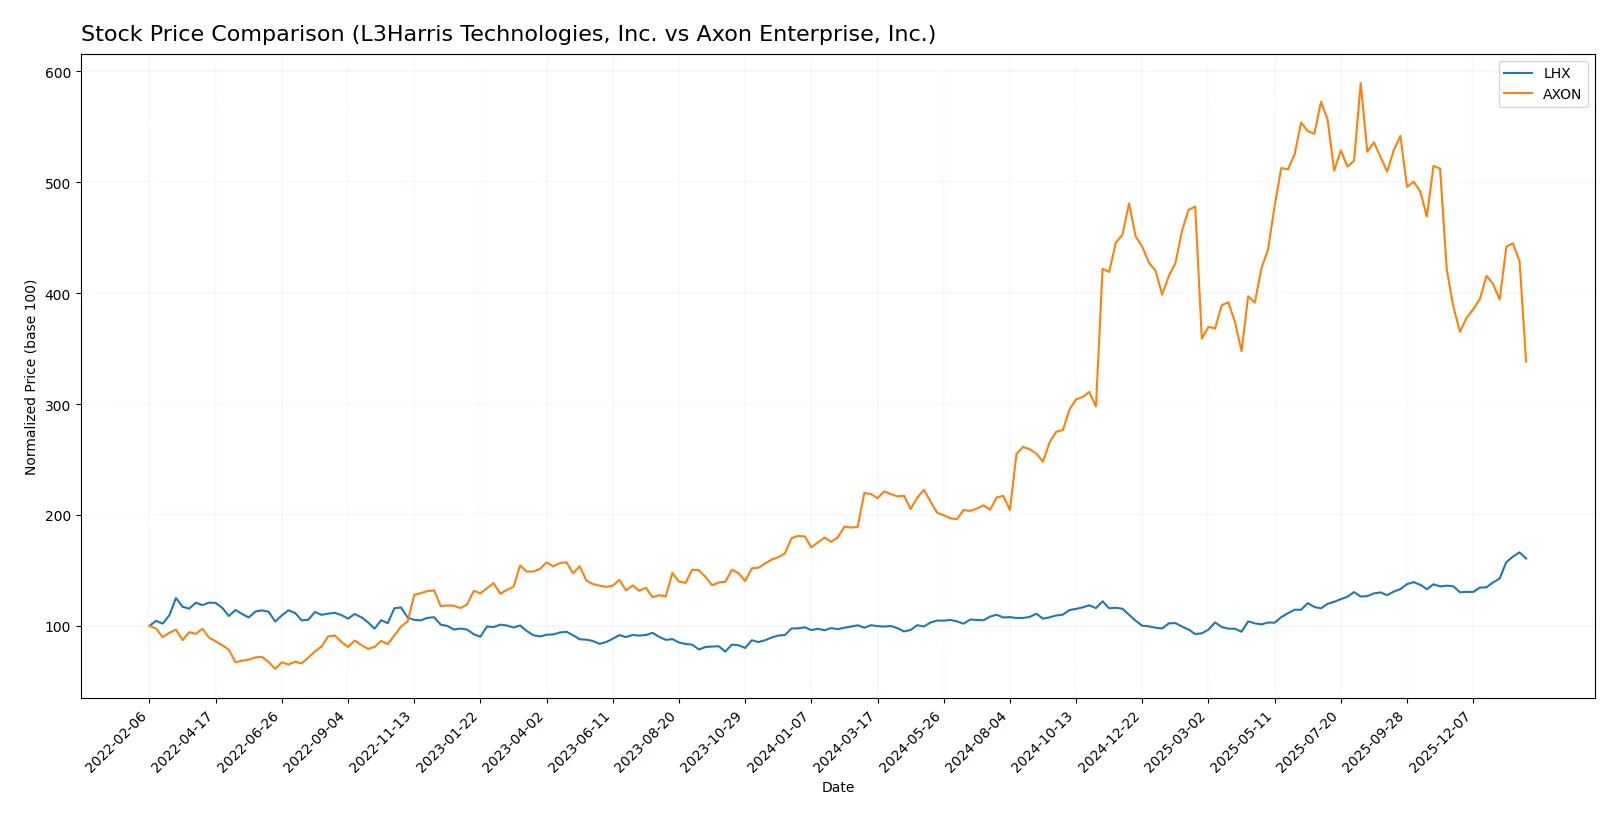
Trend Comparison
L3Harris Technologies, Inc. showed a 59.76% price increase over the past year, indicating a bullish trend with acceleration and moderate volatility (std dev 35.05). Its recent three-month gain was 18.47%, sustaining positive momentum.
Axon Enterprise, Inc. posted a 54.6% price rise over the same period, also bullish but with deceleration and significantly higher volatility (std dev 170.39). Recently, the price dropped 12.77%, reflecting a short-term bearish turn.
Comparing both, L3Harris outperformed Axon in overall returns and recent momentum, delivering the highest market performance with steadier price appreciation.
Target Prices
Analysts present a bullish target consensus for both L3Harris Technologies, Inc. and Axon Enterprise, Inc.
| Company | Target Low | Target High | Consensus |
|---|---|---|---|
| L3Harris Technologies, Inc. | 323 | 367 | 352.25 |
| Axon Enterprise, Inc. | 713 | 900 | 814.78 |
The consensus target prices imply 2.7% upside for L3Harris from its current 343 price. Axon’s target suggests a robust 68.5% potential gain from 484. These reflect strong analyst confidence despite recent volatility.

Don’t Let Luck Decide Your Entry Point
Optimize your entry points with our advanced ProRealTime indicators. You’ll get efficient buy signals with precise price targets for maximum performance. Start outperforming now!
How do institutions grade them?
L3Harris Technologies, Inc. Grades
The following table shows recent institutional grades for L3Harris Technologies, Inc.:
| Grading Company | Action | New Grade | Date |
|---|---|---|---|
| RBC Capital | maintain | Sector Perform | 2026-01-30 |
| UBS | maintain | Neutral | 2026-01-15 |
| RBC Capital | maintain | Sector Perform | 2026-01-14 |
| Citigroup | maintain | Buy | 2026-01-13 |
| Morgan Stanley | upgrade | Overweight | 2025-12-16 |
| JP Morgan | maintain | Overweight | 2025-11-04 |
| UBS | maintain | Neutral | 2025-10-31 |
| Morgan Stanley | maintain | Equal Weight | 2025-10-15 |
| Truist Securities | maintain | Buy | 2025-10-15 |
| Barclays | maintain | Overweight | 2025-07-29 |
Axon Enterprise, Inc. Grades
The following table shows recent institutional grades for Axon Enterprise, Inc.:
| Grading Company | Action | New Grade | Date |
|---|---|---|---|
| Morgan Stanley | maintain | Overweight | 2025-12-17 |
| Barclays | maintain | Overweight | 2025-11-06 |
| Piper Sandler | maintain | Overweight | 2025-11-05 |
| UBS | maintain | Neutral | 2025-11-05 |
| Goldman Sachs | maintain | Buy | 2025-11-05 |
| JMP Securities | maintain | Market Outperform | 2025-09-29 |
| Needham | maintain | Buy | 2025-09-24 |
| B of A Securities | maintain | Buy | 2025-08-06 |
| Raymond James | maintain | Outperform | 2025-08-05 |
| Craig-Hallum | upgrade | Buy | 2025-08-05 |
Which company has the best grades?
Axon Enterprise generally receives higher grades, including multiple “Overweight,” “Buy,” and “Market Outperform” ratings. L3Harris shows a mix of “Sector Perform,” “Neutral,” and “Overweight.” Axon’s stronger grades may signal greater institutional confidence, potentially influencing investor sentiment.
Risks specific to each company
The following categories identify the critical pressure points and systemic threats facing both firms in the 2026 market environment:
1. Market & Competition
L3Harris Technologies, Inc. (LHX)
- Operates in a mature aerospace & defense sector with established government contracts but faces intense competition from large defense contractors.
Axon Enterprise, Inc. (AXON)
- Competes in law enforcement tech with innovation-driven pressure and emerging rivals in digital evidence and conducted energy devices.
2. Capital Structure & Debt
L3Harris Technologies, Inc. (LHX)
- Maintains moderate debt levels with a debt-to-assets ratio of 25.35% and neutral debt-to-equity at 0.53, indicating balanced leverage.
Axon Enterprise, Inc. (AXON)
- Slightly higher leverage with debt-to-assets at 31.33% and debt-to-equity at 0.6, but excellent interest coverage at 54.75 cushions debt risk.
3. Stock Volatility
L3Harris Technologies, Inc. (LHX)
- Exhibits low beta of 0.66 indicating less market volatility, appealing to risk-averse investors.
Axon Enterprise, Inc. (AXON)
- High beta of 1.414 signals significant stock price swings, increasing volatility risk for shareholders.
4. Regulatory & Legal
L3Harris Technologies, Inc. (LHX)
- Subject to stringent aerospace and defense regulations globally, with potential export control and compliance risks.
Axon Enterprise, Inc. (AXON)
- Faces complex regulatory scrutiny around law enforcement products and data privacy, with risks of litigation and policy changes.
5. Supply Chain & Operations
L3Harris Technologies, Inc. (LHX)
- Complex global supply chain for high-tech components, vulnerable to geopolitical tensions and material shortages.
Axon Enterprise, Inc. (AXON)
- Smaller operational scale but reliant on key suppliers for hardware and cloud infrastructure, exposing it to supply disruptions.
6. ESG & Climate Transition
L3Harris Technologies, Inc. (LHX)
- Aerospace sector faces growing pressure to reduce carbon footprint and increase sustainability in manufacturing and products.
Axon Enterprise, Inc. (AXON)
- Increasing demand for transparency and social responsibility in law enforcement technology amid heightened ESG scrutiny.
7. Geopolitical Exposure
L3Harris Technologies, Inc. (LHX)
- Significant exposure to U.S. government defense budgets and international defense agreements, sensitive to geopolitical tensions.
Axon Enterprise, Inc. (AXON)
- Primarily U.S.-focused but expanding internationally, with moderate geopolitical risk from evolving global law enforcement partnerships.
Which company shows a better risk-adjusted profile?
L3Harris’ key risk lies in geopolitical and regulatory complexity, impacting contract stability. Axon’s primary challenge is stock volatility and valuation risk amid regulatory scrutiny. L3Harris shows a better risk-adjusted profile, supported by its lower beta and balanced capital structure. Axon’s high P/E of 119.4 and volatile price action justify caution despite strong margins.
Final Verdict: Which stock to choose?
L3Harris Technologies, Inc. (LHX) stands out for its durable operational efficiency and solid cash flow generation. Its superpower lies in stable income quality and disciplined capital allocation despite a slight value erosion trend. The point of vigilance remains its declining ROIC versus cost of capital. LHX suits portfolios aiming for steady income with moderate growth exposure.
Axon Enterprise, Inc. (AXON) commands a strategic moat with rapid revenue growth and high margins fueled by its innovative product ecosystem. It offers a growth profile supported by strong profitability expansion, though at a steep valuation premium and weaker capital efficiency. Compared to LHX, AXON carries higher volatility but fits well in aggressive growth or GARP-oriented portfolios seeking market leadership in emerging tech.
If you prioritize capital preservation and consistent cash flow, LHX is the compelling choice due to its resilient business model and favorable income metrics despite ROIC concerns. However, if you seek accelerated growth and are comfortable with valuation risks, AXON offers superior earnings momentum and innovation-driven upside. Both present analytical scenarios for distinct investor profiles rather than a one-size-fits-all verdict.
Disclaimer: Investment carries a risk of loss of initial capital. The past performance is not a reliable indicator of future results. Be sure to understand risks before making an investment decision.
Go Further
I encourage you to read the complete analyses of L3Harris Technologies, Inc. and Axon Enterprise, Inc. to enhance your investment decisions: