Home > Comparison > Industrials > AXON vs HII
The strategic rivalry between Axon Enterprise, Inc. and Huntington Ingalls Industries, Inc. shapes the aerospace and defense landscape. Axon excels as a technology-driven innovator offering advanced conducted energy devices and digital evidence software. Huntington Ingalls commands a capital-intensive shipbuilding and naval services operation. This analysis will assess which model delivers superior risk-adjusted returns, guiding investors seeking balanced exposure within the complex industrial sector.
Table of contents
Companies Overview
Axon Enterprise and Huntington Ingalls Industries are pivotal players in the Aerospace & Defense sector, each commanding distinct market niches.
Axon Enterprise, Inc.: Leader in Law Enforcement Technology
Axon Enterprise dominates the market for conducted energy devices and digital evidence management solutions. Its core revenue stems from selling TASER devices and cloud-based software to law enforcement. In 2026, Axon focuses strategically on expanding real-time situational awareness through partnerships and enhancing its integrated hardware-software ecosystem.
Huntington Ingalls Industries, Inc.: Premier Military Shipbuilder
Huntington Ingalls Industries stands as the largest military shipbuilder in the U.S., specializing in nuclear and non-nuclear naval vessels. Its revenue derives from designing, building, and maintaining ships for the Navy and Coast Guard. The company’s 2026 strategy centers on lifecycle sustainment services and expanding high-end IT solutions for defense and federal customers.
Strategic Collision: Similarities & Divergences
Both companies serve critical defense needs but diverge sharply in approach: Axon builds a closed ecosystem of law enforcement tech, while Huntington Ingalls offers extensive shipbuilding and sustainment services. Their primary battleground is government contracting, though their products target different defense segments. Investment profiles differ; Axon’s growth hinges on innovation and software, Huntington Ingalls relies on scale and long-term contracts.
Income Statement Comparison
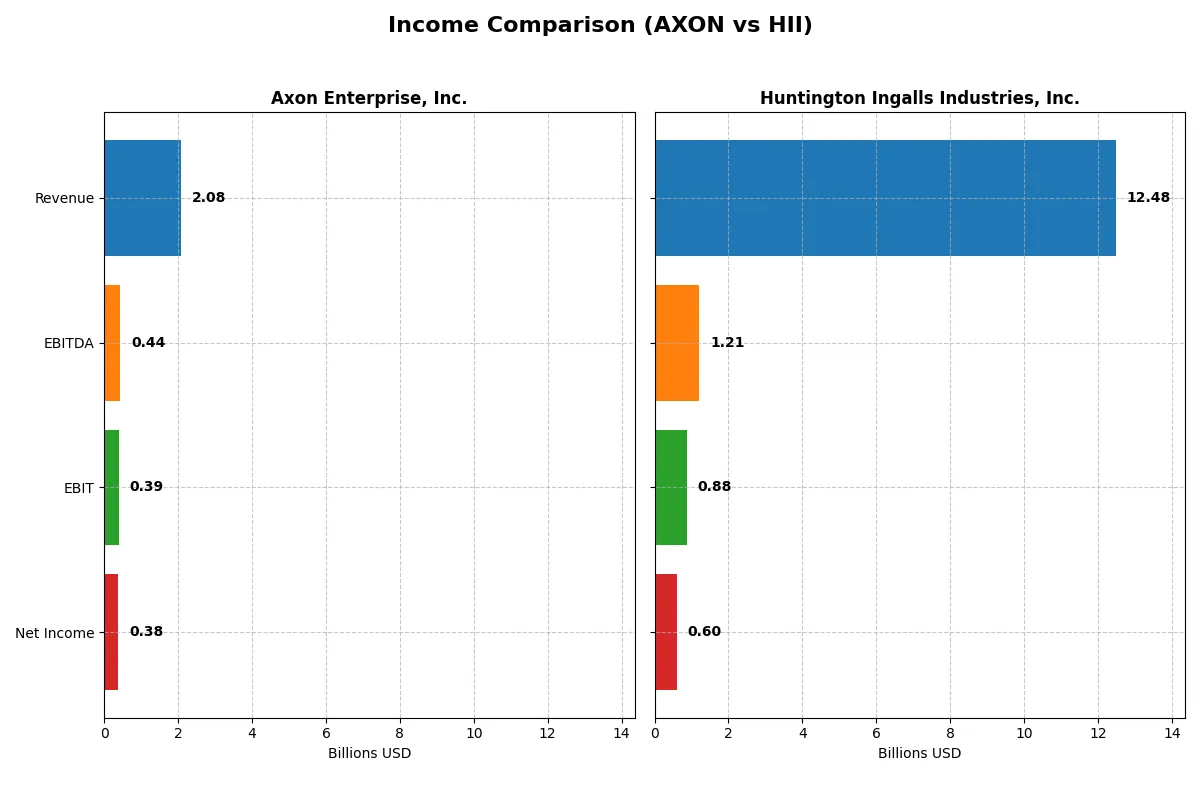
The following data dissects the core profitability and scalability of both corporate engines to reveal who dominates the bottom line:
| Metric | Axon Enterprise, Inc. (AXON) | Huntington Ingalls Industries, Inc. (HII) |
|---|---|---|
| Revenue | 2.08B | 11.54B |
| Cost of Revenue | 841M | 10.09B |
| Operating Expenses | 1.18B | 915M |
| Gross Profit | 1.24B | 1.45B |
| EBITDA | 437M | 1.06B |
| EBIT | 389M | 738M |
| Interest Expense | 7.1M | 95M |
| Net Income | 377M | 550M |
| EPS | 4.98 | 13.96 |
| Fiscal Year | 2024 | 2024 |
Income Statement Analysis: The Bottom-Line Duel
This income statement comparison reveals each company’s operational efficiency and profitability trends over recent years.
Axon Enterprise, Inc. Analysis
Axon’s revenue surged from 681M in 2020 to 2.08B in 2024, with net income rocketing from a loss of 1.7M to 377M. The firm sustains strong gross margins around 60%, while net margins improved to 18.1%, signaling enhanced operational leverage and profitability momentum in 2024.
Huntington Ingalls Industries, Inc. Analysis
HII’s revenue expanded steadily from 9.5B in 2021 to 12.5B in 2025, with net income growing from 544M to 605M. Gross margin lingers at a modest 12.7%, and net margin at 4.85%, reflecting the capital-intensive nature of its sector but consistent, moderate profit growth and margin stability.
Verdict: High-Growth Tech Margins vs. Steady Industrial Scale
Axon delivers explosive revenue and net income growth with robust margins, outperforming HII’s slower, steadier expansion and thinner profitability. For investors prioritizing margin expansion and earnings momentum, Axon’s profile stands out. HII appeals more to those valuing scale and stable industrial cash flow in a mature sector.
Financial Ratios Comparison
These vital ratios act as a diagnostic tool to expose the underlying fiscal health, valuation premiums, and capital efficiency of the companies compared below:
| Ratios | Axon Enterprise, Inc. (AXON) | Huntington Ingalls Industries, Inc. (HII) |
|---|---|---|
| ROE | 16.2% | 11.9% |
| ROIC | 1.7% | 9.0% |
| P/E | 119.4 | 22.1 |
| P/B | 19.3 | 2.63 |
| Current Ratio | 1.37 | 1.13 |
| Quick Ratio | 1.21 | 1.06 |
| D/E (Debt-to-Equity) | 0.60 | 0.62 |
| Debt-to-Assets | 31.3% | 24.7% |
| Interest Coverage | 8.25 | 5.79 |
| Asset Turnover | 0.47 | 0.98 |
| Fixed Asset Turnover | 8.42 | 3.35 |
| Payout Ratio | 0% | 35.2% |
| Dividend Yield | 0% | 1.59% |
| Fiscal Year | 2024 | 2025 |
Efficiency & Valuation Duel: The Vital Signs
Financial ratios serve as a company’s DNA, exposing hidden risks and operational strengths vital for informed investment decisions.
Axon Enterprise, Inc.
Axon delivers strong profitability with a 16.2% ROE and an 18.1% net margin, signaling operational excellence. However, valuation metrics are stretched, with a P/E of 119.4 and P/B of 19.34, indicating the stock trades at a premium. Axon returns no dividend, opting instead to reinvest heavily in R&D, fueling future growth.
Huntington Ingalls Industries, Inc.
HII posts a moderate 11.9% ROE and a slim 4.85% net margin, reflecting tighter profitability. Its valuation is more reasonable, with a P/E near 22 and P/B of 2.63, offering a less stretched profile. HII supports shareholders with a 1.59% dividend yield, balancing income with steady operational metrics and prudent capital allocation.
Premium Valuation vs. Operational Safety
Axon’s high valuation reflects growth expectations but carries risk given its weak ROIC relative to WACC. Huntington Ingalls offers a more balanced risk-reward, with stable profitability and reasonable multiples. Growth-focused investors may favor Axon’s innovation bet, while income seekers may prefer HII’s steadier, dividend-oriented profile.
Which one offers the Superior Shareholder Reward?
Axon Enterprise, Inc. (AXON) does not pay dividends but aggressively reinvests in growth, with zero payout ratio and no buybacks reported. Huntington Ingalls Industries, Inc. (HII) offers a 1.6–2.8% dividend yield, with payout ratios near 35%, and modest buybacks supporting total returns. I see HII’s balanced dividend and buyback model as more sustainable and attractive for 2026 shareholders. Its consistent free cash flow coverage and dividend stability beat Axon’s high valuation and zero cash returns. Therefore, HII delivers a superior total shareholder reward today.
Comparative Score Analysis: The Strategic Profile
The radar chart reveals the fundamental DNA and trade-offs of Axon Enterprise, Inc. and Huntington Ingalls Industries, Inc.:
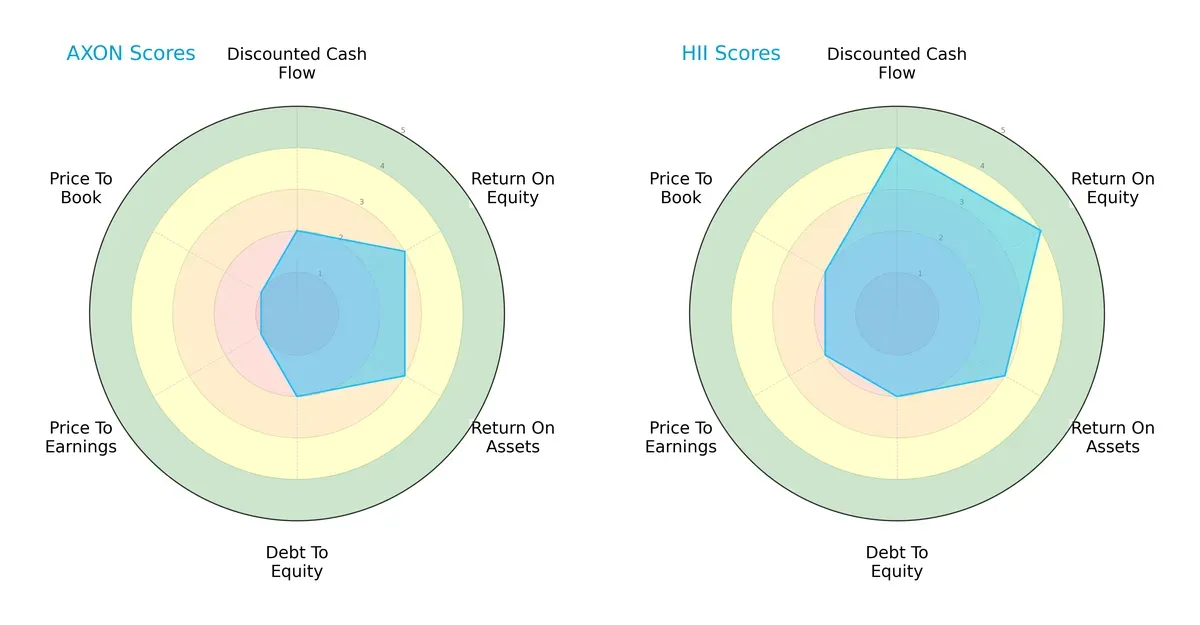
Huntington Ingalls exhibits a more balanced financial profile with stronger DCF (4 vs. 2), ROE (4 vs. 3), and valuation scores (P/E 2 vs. 1, P/B 2 vs. 1). Axon relies more on moderate returns (ROA 3 each) but suffers from weak valuation and debt metrics. Huntington Ingalls holds a clear edge in capital efficiency and market pricing.
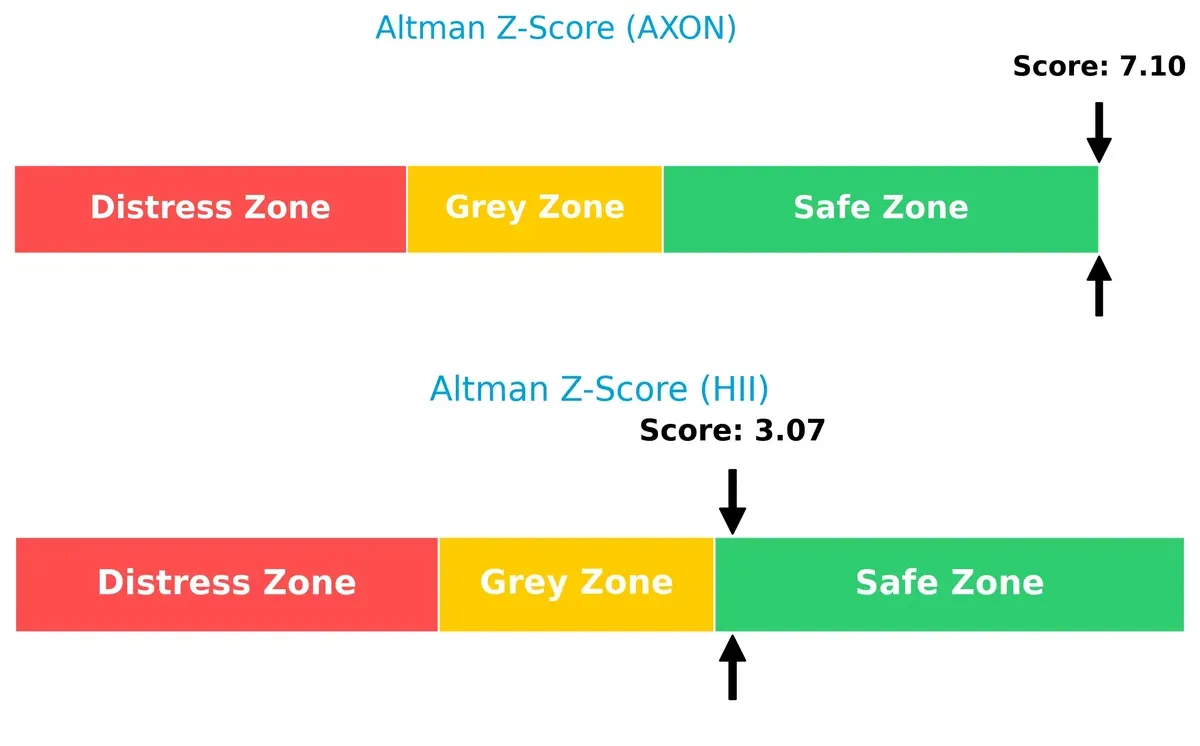
Bankruptcy Risk: Solvency Showdown
Huntington Ingalls’ Altman Z-Score of 3.07 versus Axon’s 7.10 signals both firms reside safely above distress thresholds, with Axon notably more insulated against bankruptcy risk in this cycle:
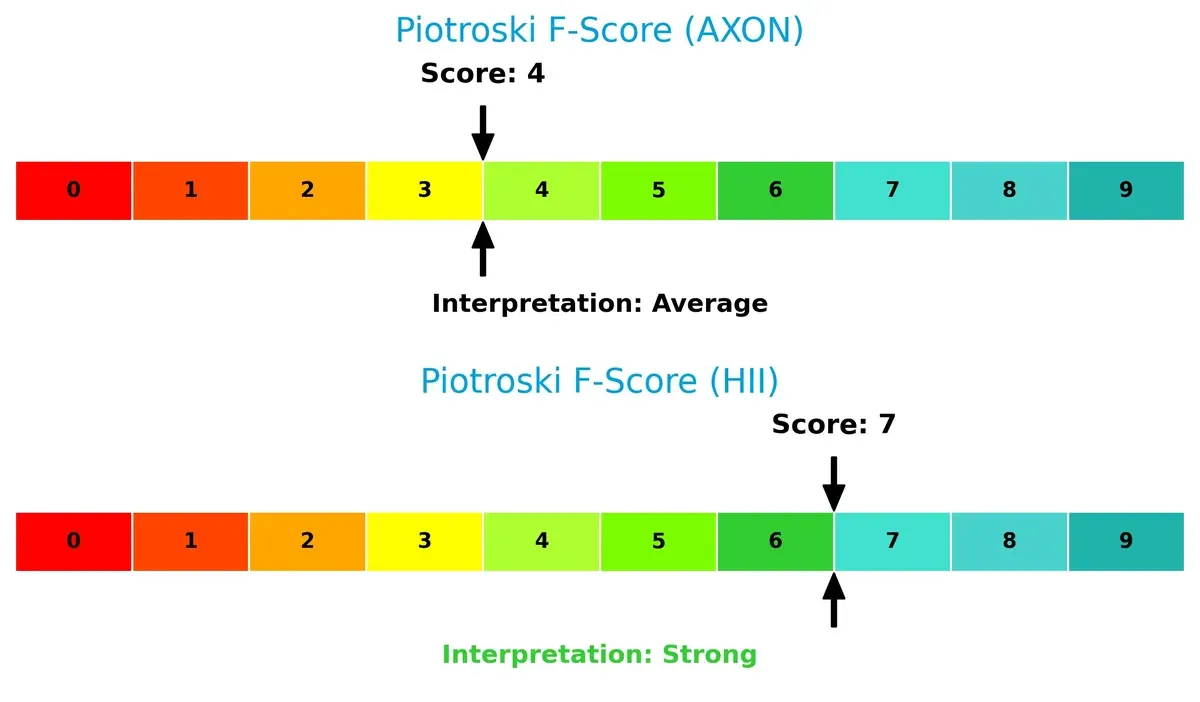
Financial Health: Quality of Operations
Huntington Ingalls’ Piotroski F-Score of 7 versus Axon’s 4 indicates a stronger operational quality and internal financial health. Axon shows moderate red flags in profitability and efficiency metrics compared to its peer:
How are the two companies positioned?
This section dissects the operational DNA of Axon and HII by comparing their revenue distribution and internal dynamics. The goal is to confront their economic moats to identify which model offers the most resilient, sustainable competitive advantage today.
Revenue Segmentation: The Strategic Mix
This side-by-side visual dissects how Axon Enterprise and Huntington Ingalls Industries diversify income streams and where their primary sector bets lie:
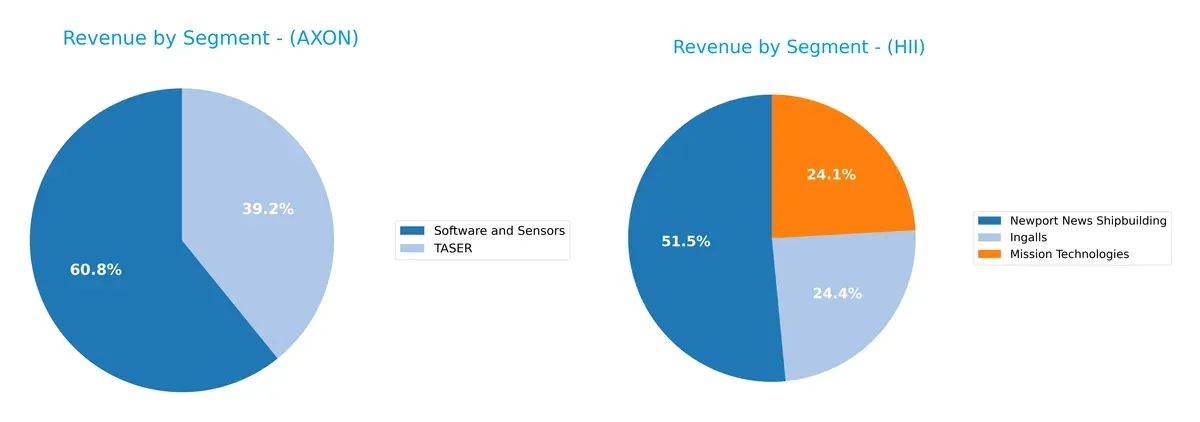
Axon Enterprise leans heavily on two segments: Software and Sensors at $951M and TASER at $613M in 2023. This split signals a focused but diversified tech and hardware approach. Huntington Ingalls Industries dwarfs Axon’s scale with three large segments, led by Newport News Shipbuilding at $6.5B, plus Ingalls and Mission Technologies near $3B each. HII’s broader mix reflects infrastructure dominance and mitigates concentration risk better than Axon’s narrower base.
Strengths and Weaknesses Comparison
This table compares the Strengths and Weaknesses of Axon Enterprise, Inc. and Huntington Ingalls Industries, Inc.:
Axon Strengths
- Strong net margin at 18.1%
- Favorable ROE at 16.2%
- High interest coverage at 54.75
- Significant software and sensors revenue
- Growing US and international sales
Huntington Ingalls Strengths
- Favorable WACC at 4.94%
- Neutral ROIC at 9.03%
- Strong interest coverage at 8.4
- Large diversified revenue from three segments
- Consistent high revenue in shipbuilding and technologies
Axon Weaknesses
- Unfavorable ROIC at 1.66% below WACC
- High P/E and P/B ratios indicating overvaluation
- Unfavorable asset turnover at 0.47
- No dividend yield
- Slightly unfavorable overall ratio opinion
Huntington Ingalls Weaknesses
- Low net margin at 4.85%
- Neutral ROE at 11.93% below sector leaders
- Moderate current and quick ratios
- Neutral P/E and P/B ratios
- Slightly favorable overall ratio opinion but with limited geographic diversification
Axon shows strong profitability and innovation in software but faces challenges in capital efficiency and valuation. Huntington Ingalls benefits from stable diversified revenues and financial prudence but has pressure on profitability and lacks geographic diversification. Both companies exhibit distinct strategic profiles influencing their financial health and market positioning.
The Moat Duel: Analyzing Competitive Defensibility
A structural moat is the only shield defending long-term profits from relentless competition erosion. Here’s how Axon and Huntington Ingalls Industries stack up:
Axon Enterprise, Inc.: Intangible Assets and Ecosystem Lock-in
Axon leverages strong intangible assets through its TASER brand and integrated digital evidence platform. This yields improving profitability despite current value destruction. Expansion in cloud-based law enforcement tech could deepen its moat in 2026.
Huntington Ingalls Industries, Inc.: Cost Advantage and Scale in Defense Shipbuilding
HII’s moat stems from scale and specialized shipbuilding contracts, creating cost advantages unmatched by small competitors. It consistently creates value with rising ROIC. Growth in naval projects offers solid expansion and market disruption potential.
Moat Battle: Intangible Ecosystem vs. Industrial Scale Advantage
HII holds the wider and deeper moat with ROIC exceeding WACC by 4%, signaling durable value creation. Axon’s moat shows promise but remains slightly unfavorable, risking profit erosion. HII is better positioned to defend its market share long term.
Which stock offers better returns?
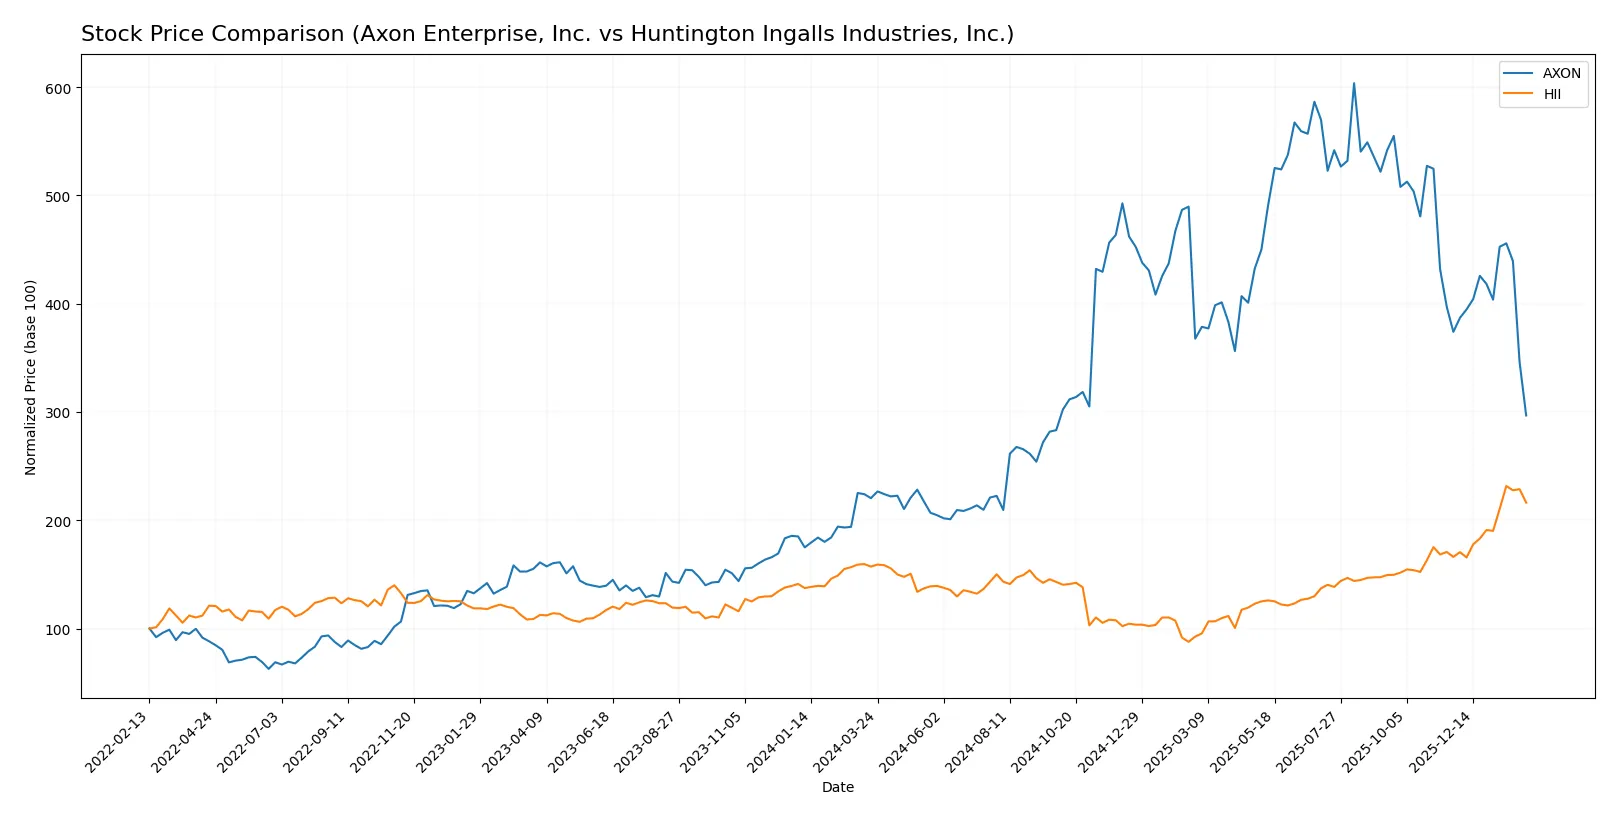
The past year saw Axon Enterprise’s stock rise sharply before recent deceleration, while Huntington Ingalls gained steadily with accelerating momentum and stronger buyer dominance.
Trend Comparison
Axon Enterprise’s stock climbed 34.63% over 12 months, showing a bullish trend with decelerating gains, peaking at 842.5 and bottoming at 280.5. Recent months reveal a bearish pullback of -20.65%.
Huntington Ingalls’ stock advanced 37.63% over the same period, marking a bullish trend with acceleration. It reached a high of 425.9 and a low of 161.27. Recent gains accelerated by 30.21%, reflecting strong upward momentum.
Huntington Ingalls delivered higher overall returns with accelerating upward momentum, outperforming Axon Enterprise’s decelerating trend and recent negative price movement.
Target Prices
Analysts present a bullish consensus for both Axon Enterprise, Inc. and Huntington Ingalls Industries, Inc.
| Company | Target Low | Target High | Consensus |
|---|---|---|---|
| Axon Enterprise, Inc. | 713 | 860 | 767 |
| Huntington Ingalls Industries, Inc. | 264 | 419 | 365 |
Axon’s consensus target of 767 implies an 85% upside from its current price of 414.2. Huntington Ingalls’ consensus target of 365 suggests modest upside near 9% versus its current price of 397.77.

Don’t Let Luck Decide Your Entry Point
Optimize your entry points with our advanced ProRealTime indicators. You’ll get efficient buy signals with precise price targets for maximum performance. Start outperforming now!
How do institutions grade them?
The following summarizes the latest institutional grades for both companies:
Axon Enterprise, Inc. Grades
This table shows recent grade actions from leading financial institutions for Axon Enterprise, Inc.:
| Grading Company | Action | New Grade | Date |
|---|---|---|---|
| Morgan Stanley | Maintain | Overweight | 2025-12-17 |
| Barclays | Maintain | Overweight | 2025-11-06 |
| UBS | Maintain | Neutral | 2025-11-05 |
| Goldman Sachs | Maintain | Buy | 2025-11-05 |
| Piper Sandler | Maintain | Overweight | 2025-11-05 |
| JMP Securities | Maintain | Market Outperform | 2025-09-29 |
| Needham | Maintain | Buy | 2025-09-24 |
| B of A Securities | Maintain | Buy | 2025-08-06 |
| UBS | Maintain | Neutral | 2025-08-05 |
| Raymond James | Maintain | Outperform | 2025-08-05 |
Huntington Ingalls Industries, Inc. Grades
This table presents the latest institutional grade updates for Huntington Ingalls Industries, Inc.:
| Grading Company | Action | New Grade | Date |
|---|---|---|---|
| Goldman Sachs | Maintain | Buy | 2026-01-20 |
| Citigroup | Maintain | Buy | 2026-01-13 |
| JP Morgan | Maintain | Neutral | 2025-11-03 |
| Goldman Sachs | Maintain | Buy | 2025-10-31 |
| TD Cowen | Maintain | Buy | 2025-10-31 |
| B of A Securities | Maintain | Underperform | 2025-08-13 |
| Barclays | Maintain | Equal Weight | 2025-08-04 |
| TD Cowen | Upgrade | Buy | 2025-07-10 |
| Barclays | Maintain | Equal Weight | 2025-05-05 |
| Goldman Sachs | Maintain | Buy | 2025-05-02 |
Which company has the best grades?
Axon Enterprise consistently receives strong buy and overweight ratings from multiple firms, reflecting a more bullish consensus. Huntington Ingalls shows mixed ratings, including buy and underperform grades, indicating more varied institutional views. Investors might interpret Axon’s stronger grades as greater confidence in its outlook.
Risks specific to each company
The following categories identify the critical pressure points and systemic threats facing both firms in the 2026 market environment:
1. Market & Competition
Axon Enterprise, Inc.
- Faces pressure from high valuation multiples and innovation demands in law enforcement tech.
Huntington Ingalls Industries, Inc.
- Competes in a capital-intensive shipbuilding sector with steady government contracts but limited diversification.
2. Capital Structure & Debt
Axon Enterprise, Inc.
- Moderate debt levels with a 0.6 debt-to-equity ratio; interest coverage is very strong at 54.75x.
Huntington Ingalls Industries, Inc.
- Slightly higher leverage with 0.62 debt-to-equity; interest coverage is adequate at 8.4x.
3. Stock Volatility
Axon Enterprise, Inc.
- High beta of 1.48 signals elevated stock price volatility compared to the market.
Huntington Ingalls Industries, Inc.
- Low beta of 0.33 indicates defensive characteristics and less sensitivity to market swings.
4. Regulatory & Legal
Axon Enterprise, Inc.
- Subject to evolving law enforcement regulations and potential scrutiny on use of force technology.
Huntington Ingalls Industries, Inc.
- Faces strict government oversight and compliance risks tied to defense contracting and nuclear operations.
5. Supply Chain & Operations
Axon Enterprise, Inc.
- Relies on hardware manufacturing and cloud infrastructure, vulnerable to tech supply chain disruptions.
Huntington Ingalls Industries, Inc.
- Complex shipbuilding supply chain with risk from labor shortages, raw material costs, and long project cycles.
6. ESG & Climate Transition
Axon Enterprise, Inc.
- Increasing pressure to enhance product sustainability and data privacy in public safety tech.
Huntington Ingalls Industries, Inc.
- High exposure to environmental regulations due to nuclear services and shipbuilding emissions.
7. Geopolitical Exposure
Axon Enterprise, Inc.
- Limited direct geopolitical risk but sensitive to US domestic law enforcement policies.
Huntington Ingalls Industries, Inc.
- Highly exposed to US government defense budgets and geopolitical tensions affecting naval priorities.
Which company shows a better risk-adjusted profile?
Huntington Ingalls Industries’ key risk is geopolitical exposure coupled with regulatory complexity in defense contracting. Axon’s biggest challenge lies in its stretched valuation and volatile market sentiment. Despite Axon’s strong interest coverage, its unfavorable ROIC versus WACC signals inefficient capital use. HII’s lower leverage, better Piotroski score (7 vs. 4), and safer Altman Z-score reflect a stronger financial cushion. Thus, HII presents a superior risk-adjusted profile grounded in stable government demand and prudent capital management. Recent data shows Axon’s stock has a wide price range (396-886), confirming investor nervousness amid tech sector volatility.
Final Verdict: Which stock to choose?
Axon Enterprise, Inc. shines with a superpower in robust income growth and exceptional operating margins. Its rising profitability signals potential, but a weak return on invested capital remains a point of vigilance. Axon suits investors targeting aggressive growth with an appetite for elevated valuation risks.
Huntington Ingalls Industries, Inc. offers a strategic moat through consistent value creation and efficient capital use, supported by a very favorable ROIC versus WACC. Its more balanced financial profile and safer valuation set it apart from Axon. Huntington fits well within growth-at-a-reasonable-price (GARP) portfolios seeking steadier returns.
If you prioritize rapid expansion and are willing to tolerate valuation premium and capital efficiency concerns, Axon is the compelling choice due to its accelerating income growth. However, if you seek better stability, a durable competitive advantage, and a more attractive risk-return tradeoff, Huntington outshines Axon as a more prudent investment scenario.
Disclaimer: Investment carries a risk of loss of initial capital. The past performance is not a reliable indicator of future results. Be sure to understand risks before making an investment decision.
Go Further
I encourage you to read the complete analyses of Axon Enterprise, Inc. and Huntington Ingalls Industries, Inc. to enhance your investment decisions: