Home > Comparison > Industrials > GD vs AXON
The strategic rivalry between General Dynamics Corporation and Axon Enterprise, Inc. shapes the aerospace and defense sector’s evolution. General Dynamics is a capital-intensive industrial giant with diversified segments including aerospace, marine, and combat systems. Axon Enterprise, by contrast, focuses on high-margin, technology-driven law enforcement hardware and software solutions. This analysis weighs their differing operational models to identify which corporate trajectory offers superior risk-adjusted returns for a diversified portfolio.
Table of contents
Companies Overview
General Dynamics Corporation and Axon Enterprise, Inc. both shape the future of aerospace and defense with distinct market footprints.
General Dynamics Corporation: Aerospace & Defense Powerhouse
General Dynamics commands a broad aerospace and defense portfolio, generating revenue through four diverse segments: Aerospace, Marine Systems, Combat Systems, and Technologies. Its core strength lies in manufacturing business jets, naval ships, combat vehicles, and advanced IT solutions. In 2026, the company emphasizes cutting-edge defense technology and lifecycle support, reinforcing its position in military modernization and mission-critical services.
Axon Enterprise, Inc.: Innovator in Law Enforcement Tech
Axon Enterprise leads in conducted energy devices and digital evidence management for law enforcement. Its revenue streams revolve around TASER devices and cloud-based hardware-software ecosystems that capture and analyze digital evidence. In 2026, Axon focuses on expanding real-time crime center capabilities through strategic partnerships and advanced cloud solutions, shaping the future of public safety technology.
Strategic Collision: Similarities & Divergences
Both companies operate within aerospace and defense but adopt contrasting approaches. General Dynamics pursues a diversified, hardware-heavy model with extensive government contracting. Axon prioritizes a software-driven, integrated solution targeting law enforcement modernization. Their battleground centers on defense and security innovation, with General Dynamics appealing to traditional defense investors, while Axon attracts growth-oriented profiles focused on technology disruption.
Income Statement Comparison
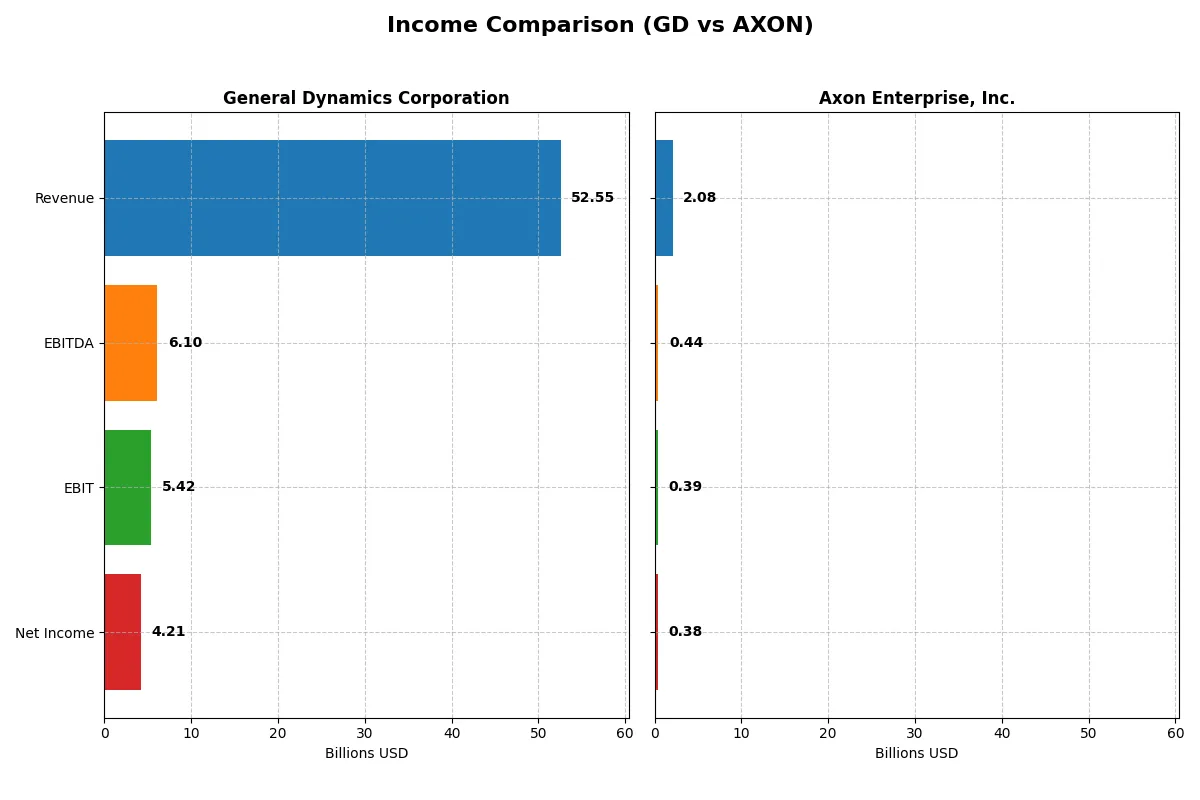
This data dissects the core profitability and scalability of both corporate engines to reveal who dominates the bottom line:
| Metric | General Dynamics Corporation (GD) | Axon Enterprise, Inc. (AXON) |
|---|---|---|
| Revenue | 52.6B | 2.1B |
| Cost of Revenue | 44.6B | 841M |
| Operating Expenses | 2.6B | 1.2B |
| Gross Profit | 7.9B | 1.2B |
| EBITDA | 6.1B | 437M |
| EBIT | 5.4B | 389M |
| Interest Expense | 314M | 7.1M |
| Net Income | 4.2B | 377M |
| EPS | 15.64 | 4.98 |
| Fiscal Year | 2025 | 2024 |
Income Statement Analysis: The Bottom-Line Duel
This income statement comparison exposes which company operates with superior efficiency and sustainable profit dynamics.
General Dynamics Corporation Analysis
General Dynamics steadily grows revenue from 38.5B in 2021 to 52.6B in 2025, with net income rising from 3.3B to 4.2B. Gross margins hover near 15%, while net margin improves to 8%. The 2025 results reflect solid operational leverage, boosting EBIT margin to 10.3%, underscoring consistent profitability in a mature defense sector.
Axon Enterprise, Inc. Analysis
Axon Enterprise exhibits explosive growth, expanding revenue over 2B in 2024 from 863M in 2021. Net income surges from a loss to 377M, driving net margin to an impressive 18.1%. Gross margin exceeds 59%, and EBIT margin hits 18.7%, signaling rapid scaling but with rising operating expenses, challenging cost control amid aggressive expansion.
Margin Power vs. Revenue Scale
Axon’s high margin profile and rapid profit growth contrast with General Dynamics’ steady revenue scale and moderate margin expansion. Axon dominates profit efficiency with nearly double the net margin and faster EPS growth. For investors, Axon offers a high-growth, high-margin profile, while General Dynamics presents stable scale and consistent income, appealing to different risk appetites.
Financial Ratios Comparison
These vital ratios act as a diagnostic tool to expose underlying fiscal health, valuation premiums, and capital efficiency of the companies compared below:
| Ratios | General Dynamics Corporation (GD) | Axon Enterprise, Inc. (AXON) |
|---|---|---|
| ROE | 16.4% | 16.2% |
| ROIC | 10.7% | 1.7% |
| P/E | 21.6 | 119.4 |
| P/B | 3.55 | 19.3 |
| Current Ratio | 1.44 | 1.37 |
| Quick Ratio | 0.89 | 1.21 |
| D/E | 0.31 | 0.60 |
| Debt-to-Assets | 14.0% | 31.3% |
| Interest Coverage | 17.1 | 8.2 |
| Asset Turnover | 0.92 | 0.47 |
| Fixed Asset Turnover | 6.98 | 8.42 |
| Payout ratio | 37.8% | 0% |
| Dividend yield | 1.75% | 0% |
| Fiscal Year | 2025 | 2024 |
Efficiency & Valuation Duel: The Vital Signs
Financial ratios act as a company’s DNA, revealing its hidden risks and operational strengths in clear, quantifiable terms.
General Dynamics Corporation
General Dynamics posts a solid 16.4% ROE and a 10.7% ROIC, both above its 5.6% WACC, signaling efficient capital use. The P/E ratio at 21.6 is neutral, suggesting fair valuation. Its 1.75% dividend yield underlines steady shareholder returns, reflecting disciplined capital allocation rather than heavy reinvestment.
Axon Enterprise, Inc.
Axon shows a strong 18.1% net margin and 16.2% ROE but a weak 1.7% ROIC versus a high 10.2% WACC, indicating inefficient capital deployment. The stretched P/E ratio at 119.4 points to expensive stock pricing. Lack of dividends emphasizes reinvestment into growth and R&D, reflecting a high-growth but riskier profile.
Valuation Discipline vs. Growth Ambition
General Dynamics balances operational efficiency with moderate valuation and shareholder returns, offering a safer risk-reward profile. Axon’s premium multiples and reinvestment strategy suggest higher growth potential but elevated risk. Investors seeking stability may favor General Dynamics; growth-oriented investors might lean toward Axon’s ambitious expansion.
Which one offers the Superior Shareholder Reward?
I compare General Dynamics (GD) and Axon Enterprise (AXON) on their shareholder reward strategies. GD pays a steady 2.0% dividend yield with a 38% payout ratio, well-covered by strong free cash flow of 14.7/share. It also maintains buybacks, supporting total returns. Axon pays no dividend but reinvests heavily in growth, with a high FCF conversion of 4.4/share and a share buyback program that is modest but growing. GD’s consistent dividend and buybacks offer reliable income and capital return, while Axon’s reinvestment targets future expansion at the cost of current yield. I find GD’s distribution model more sustainable and attractive for 2026 investors seeking balanced total returns.
Comparative Score Analysis: The Strategic Profile
The radar chart reveals the fundamental DNA and trade-offs of General Dynamics and Axon Enterprise, highlighting their distinct financial strengths and weaknesses:
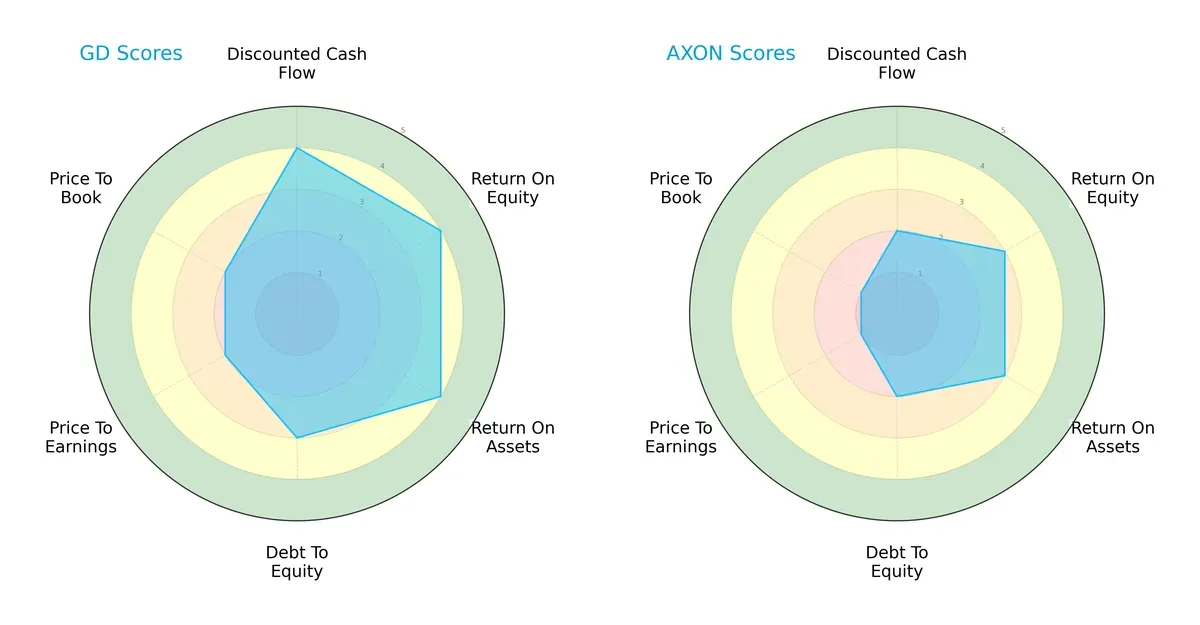
General Dynamics boasts superior DCF, ROE, and ROA scores, signaling efficient profitability and asset use. Its moderate debt-to-equity and valuation scores suggest balanced financial risk and fair market pricing. Axon Enterprise relies more on modest operational returns but scores weaker on valuation metrics, indicating potential overvaluation risk. Overall, General Dynamics presents a more balanced and robust profile, while Axon leans heavily on specific operational edges.
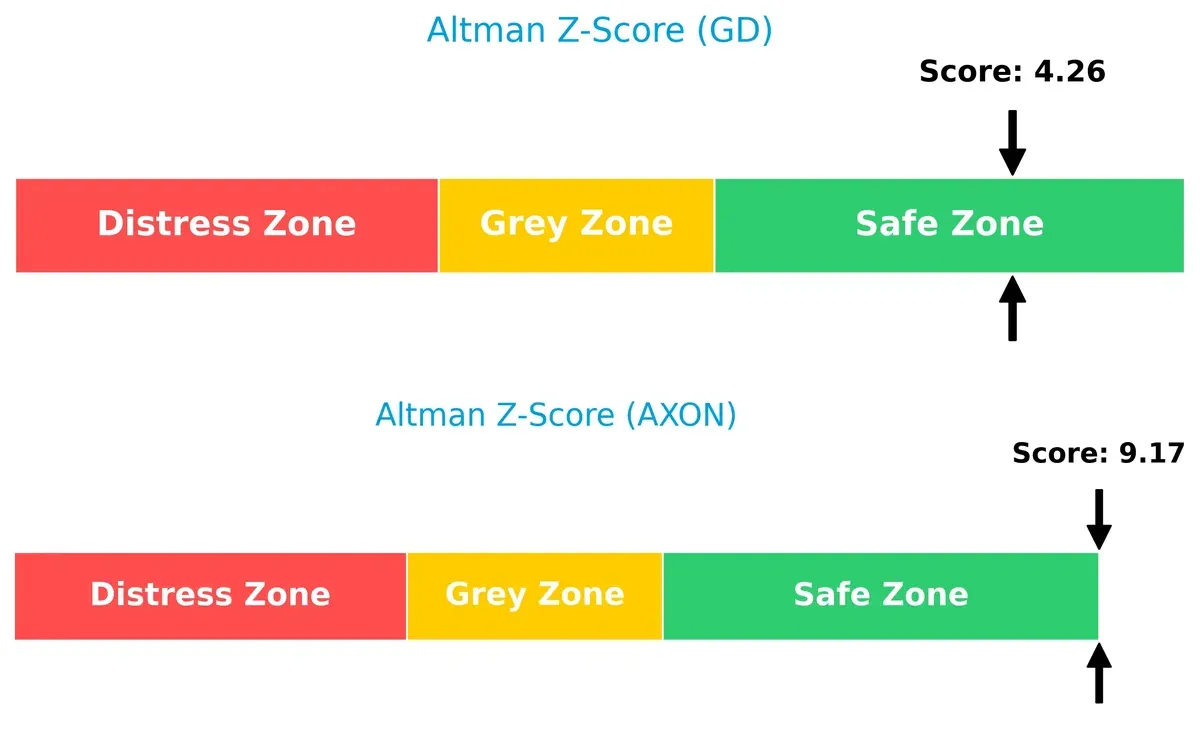
Bankruptcy Risk: Solvency Showdown
General Dynamics and Axon both score securely in the safe zone for Altman Z-Scores, but Axon’s markedly higher 9.17 versus General Dynamics’ 4.26 signals stronger resilience and lower bankruptcy risk in this cycle:
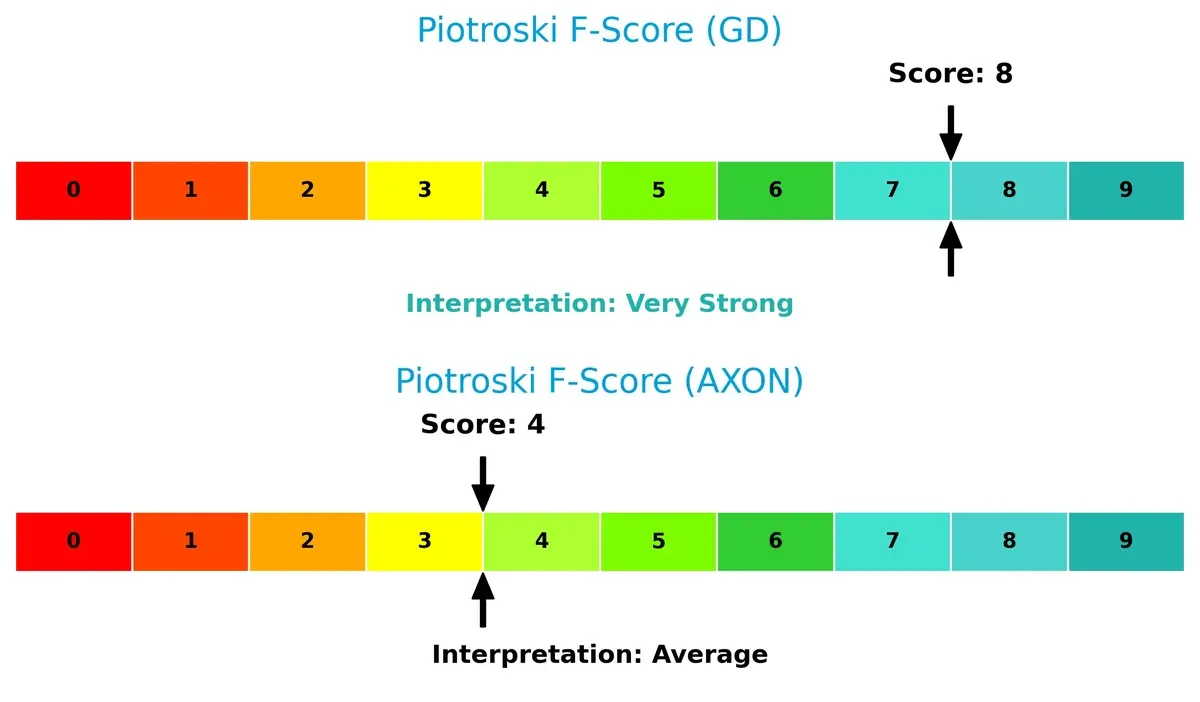
Financial Health: Quality of Operations
General Dynamics’ Piotroski F-Score of 8 reflects very strong financial health, with robust internal metrics. Axon’s middling score of 4 suggests average financial quality and potential red flags in operational efficiency or liquidity:
How are the two companies positioned?
This section dissects GD and AXON’s operational DNA by comparing their revenue distribution and internal strengths and weaknesses. The goal is to confront their economic moats to reveal which model offers the most resilient, sustainable advantage today.
Revenue Segmentation: The Strategic Mix
This revenue comparison dissects how General Dynamics and Axon Enterprise diversify their income streams and where their primary sector bets lie:
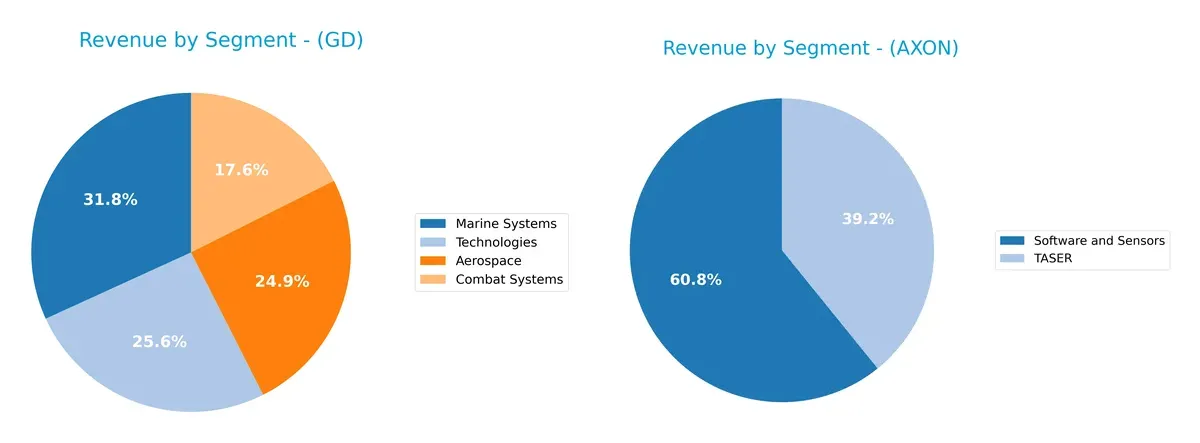
General Dynamics anchors its revenue in Marine Systems ($16.7B) and Technologies ($13.5B), showing a balanced mix across four major sectors. Axon Enterprise pivots around Software and Sensors ($951M) and TASER products ($613M), revealing a narrower focus. GD’s diversified portfolio mitigates concentration risk, leveraging infrastructure dominance across defense sectors. Axon’s reliance on two segments signals potential vulnerability but also a strong ecosystem lock-in in law enforcement tech.
Strengths and Weaknesses Comparison
This table compares the strengths and weaknesses of General Dynamics Corporation and Axon Enterprise, Inc.:
GD Strengths
- Diversified revenue across Aerospace, Combat Systems, Marine, and Technologies segments
- Favorable ROIC and WACC indicating efficient capital use
- Strong global presence with dominant North America and significant Europe and Asia Pacific sales
AXON Strengths
- High net margin and favorable ROE show solid profitability
- Favorable quick ratio and high interest coverage improve liquidity and debt servicing
- Innovation focus on Software and Sensors and TASER products
GD Weaknesses
- Unfavorable high price-to-book ratio suggests market undervaluation risk
- Neutral current and quick ratios point to moderate short-term liquidity
- Asset turnover is neutral, indicating average asset efficiency
AXON Weaknesses
- Unfavorable ROIC and WACC imply lower capital efficiency than cost of capital
- High PE and PB ratios signal potential overvaluation risks
- Low asset turnover and zero dividend yield raise concerns on operational efficiency and shareholder returns
General Dynamics exhibits broad diversification and solid financial ratios, supporting its capital efficiency and global footprint. Axon shows strong profitability but faces challenges in capital efficiency and valuation, reflecting its growth and innovation focus.
The Moat Duel: Analyzing Competitive Defensibility
A structural moat shields long-term profits from relentless competition erosion. Here’s how General Dynamics and Axon Enterprise defend their turf:
General Dynamics Corporation: Defense Industry’s Integrated Moat
General Dynamics leverages a diversified portfolio and government contracts as its moat. Its steady 5.1% ROIC above WACC signals durable value creation. Expanding marine and tech segments may deepen this moat in 2026.
Axon Enterprise, Inc.: Innovation-Driven Network Effects
Axon’s moat stems from its integrated hardware-software ecosystem, driving strong network effects. Despite a negative ROIC versus WACC, its soaring profitability and rapid growth hint at an emerging, yet unproven, competitive edge.
Moat Battle: Established Diversification vs. Emerging Ecosystem Lock-in
General Dynamics boasts a wider, more durable moat with consistent value creation. Axon’s moat is narrower but fast-growing. GD is better positioned to defend market share amid 2026’s evolving aerospace-defense landscape.
Which stock offers better returns?
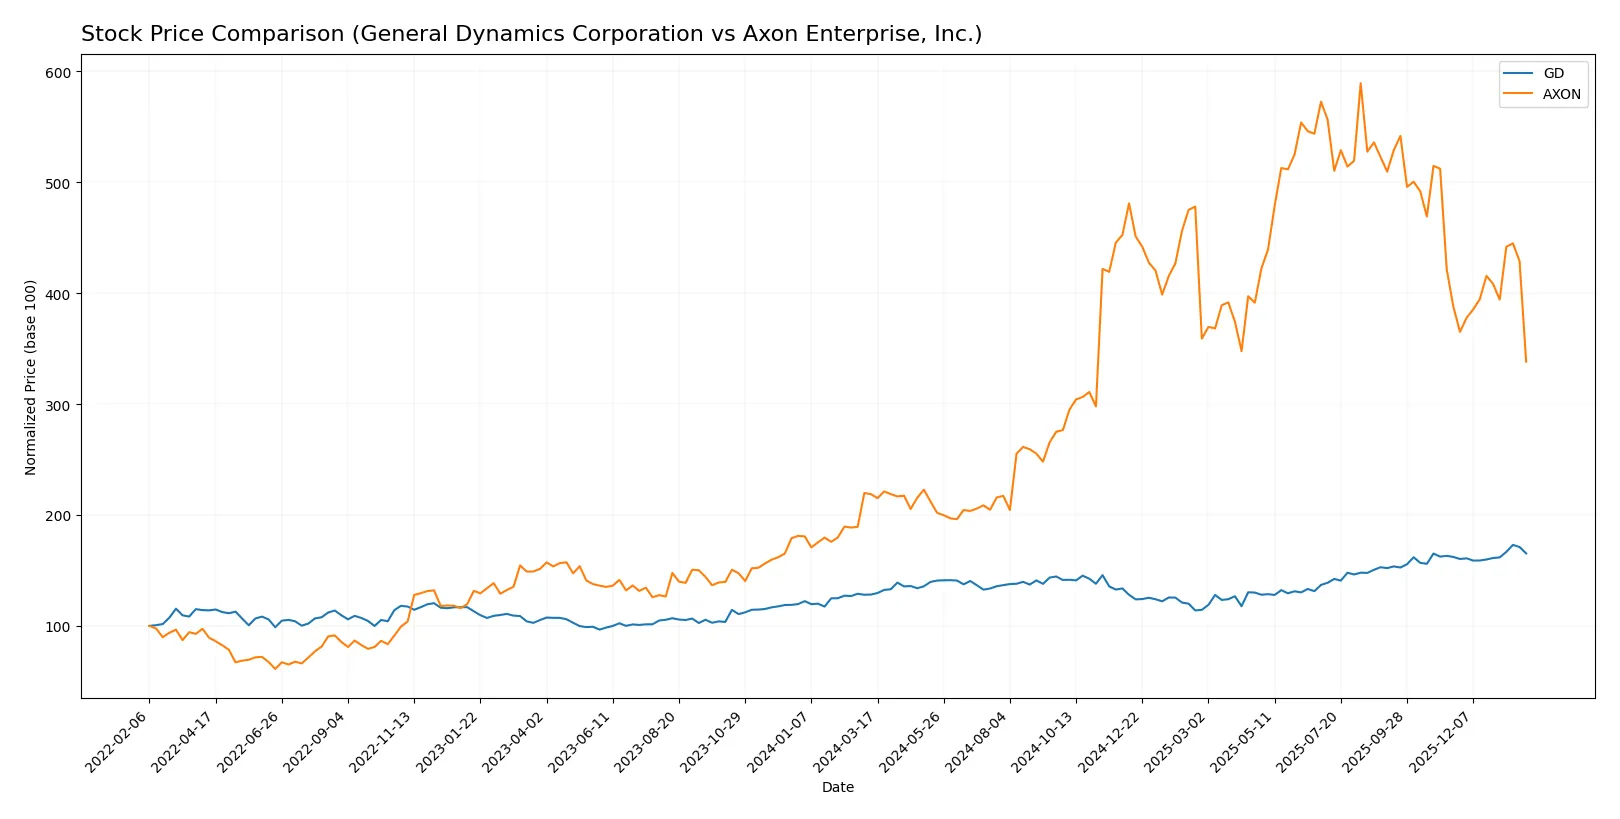
Over the past year, both General Dynamics Corporation and Axon Enterprise, Inc. showed significant price shifts, with distinct momentum and volatility patterns shaping their trading dynamics.
Trend Comparison
General Dynamics Corporation’s stock gained 28.93% over 12 months, signaling a bullish trend with accelerating momentum and a moderate volatility level of 28.77. It reached a high of 367.38 and a low of 241.94.
Axon Enterprise, Inc. outperformed with a 54.6% rise over the same period, maintaining a bullish trend despite deceleration and very high volatility at 170.39. Its price ranged between 280.5 and 842.5.
Axon Enterprise delivered the highest market performance, though with greater volatility; General Dynamics showed steadier acceleration but lower overall gains.
Target Prices
Analysts project solid upside potential for both General Dynamics Corporation and Axon Enterprise, Inc.
| Company | Target Low | Target High | Consensus |
|---|---|---|---|
| General Dynamics Corporation | 390 | 444 | 406.63 |
| Axon Enterprise, Inc. | 713 | 900 | 814.78 |
General Dynamics’ target consensus sits about 16% above its current 351 price, signaling moderate appreciation. Axon’s consensus target exceeds its 484 price by nearly 69%, reflecting higher growth expectations despite recent volatility.

Don’t Let Luck Decide Your Entry Point
Optimize your entry points with our advanced ProRealTime indicators. You’ll get efficient buy signals with precise price targets for maximum performance. Start outperforming now!
How do institutions grade them?
Here is a summary of recent institutional grades for General Dynamics Corporation and Axon Enterprise, Inc.:
General Dynamics Corporation Grades
The following table presents recent grades from reputable institutions for General Dynamics Corporation.
| Grading Company | Action | New Grade | Date |
|---|---|---|---|
| B of A Securities | Maintain | Buy | 2026-01-30 |
| UBS | Maintain | Neutral | 2026-01-15 |
| Citigroup | Maintain | Neutral | 2026-01-13 |
| JP Morgan | Maintain | Overweight | 2025-12-19 |
| Morgan Stanley | Upgrade | Overweight | 2025-12-16 |
| JP Morgan | Maintain | Overweight | 2025-10-28 |
| B of A Securities | Maintain | Buy | 2025-10-28 |
| Bernstein | Maintain | Market Perform | 2025-10-28 |
| UBS | Maintain | Neutral | 2025-10-27 |
| JP Morgan | Maintain | Overweight | 2025-10-27 |
Axon Enterprise, Inc. Grades
The following table presents recent grades from reputable institutions for Axon Enterprise, Inc.
| Grading Company | Action | New Grade | Date |
|---|---|---|---|
| Morgan Stanley | Maintain | Overweight | 2025-12-17 |
| Barclays | Maintain | Overweight | 2025-11-06 |
| Piper Sandler | Maintain | Overweight | 2025-11-05 |
| UBS | Maintain | Neutral | 2025-11-05 |
| Goldman Sachs | Maintain | Buy | 2025-11-05 |
| JMP Securities | Maintain | Market Outperform | 2025-09-29 |
| Needham | Maintain | Buy | 2025-09-24 |
| B of A Securities | Maintain | Buy | 2025-08-06 |
| Raymond James | Maintain | Outperform | 2025-08-05 |
| Craig-Hallum | Upgrade | Buy | 2025-08-05 |
Which company has the best grades?
Axon Enterprise has consistently received higher grades, including several Buy, Overweight, and Market Outperform ratings. General Dynamics shows solid Buy and Overweight grades but more Neutral ratings. Axon’s stronger grades may attract investors seeking growth potential, while General Dynamics offers more conservative endorsements.
Risks specific to each company
The following categories identify the critical pressure points and systemic threats facing both firms in the 2026 market environment:
1. Market & Competition
General Dynamics Corporation
- Operates in a mature aerospace & defense sector with stable government contracts but faces intense competition from large defense primes.
Axon Enterprise, Inc.
- Faces fierce competition in law enforcement tech and software, with rapid innovation cycles and pressure from emerging tech firms.
2. Capital Structure & Debt
General Dynamics Corporation
- Maintains a conservative debt profile (D/E 0.31), with strong interest coverage (17.25x), signaling solid financial stability.
Axon Enterprise, Inc.
- Higher leverage (D/E 0.60) and elevated debt-to-assets (31.3%), increasing financial risk amid volatile earnings.
3. Stock Volatility
General Dynamics Corporation
- Low beta (0.41) indicates defensive stock behavior, less sensitive to market swings.
Axon Enterprise, Inc.
- High beta (1.41) signals elevated stock price volatility, increasing risk for investors.
4. Regulatory & Legal
General Dynamics Corporation
- Subject to stringent U.S. defense regulations and export controls; political shifts could impact contracts.
Axon Enterprise, Inc.
- Faces regulatory scrutiny on law enforcement tech use and data privacy, with evolving legal frameworks adding uncertainty.
5. Supply Chain & Operations
General Dynamics Corporation
- Complex global supply chains for aerospace and marine manufacturing, vulnerable to geopolitical disruptions.
Axon Enterprise, Inc.
- Relies on high-tech components and cloud infrastructure; supply chain risks from semiconductor shortages and cyber threats.
6. ESG & Climate Transition
General Dynamics Corporation
- Increasing pressure to reduce environmental footprint in manufacturing; defense sector faces slow ESG adoption.
Axon Enterprise, Inc.
- Faces reputational risks related to product use in policing, but benefits from cloud-based solutions reducing physical footprint.
7. Geopolitical Exposure
General Dynamics Corporation
- Heavy exposure to U.S. government defense spending and global military tensions; sensitive to budget shifts.
Axon Enterprise, Inc.
- Primarily U.S.-focused but expanding internationally; geopolitical instability could affect global sales and regulatory environments.
Which company shows a better risk-adjusted profile?
General Dynamics faces significant regulatory and geopolitical risks but compensates with a robust capital structure and low stock volatility. Axon excels in profitability but grapples with high valuation multiples, elevated leverage, and greater stock price volatility. The most impactful risk for General Dynamics is its dependence on U.S. defense budgets amid geopolitical uncertainty. For Axon, valuation risk and capital structure raise red flags. Overall, General Dynamics presents a better risk-adjusted profile, supported by its strong Altman Z-score (4.26) and Piotroski score (8), reflecting financial resilience and stability in a cyclical industry.
Final Verdict: Which stock to choose?
General Dynamics Corporation’s superpower lies in its robust capital efficiency and durable competitive advantage. It consistently delivers returns well above its cost of capital, confirming a strong economic moat. A point of vigilance is its moderate price-to-book ratio, which suggests some valuation premium. It fits best within a conservative or balanced portfolio seeking steady industrial defense exposure.
Axon Enterprise, Inc. boasts a strategic moat rooted in rapid innovation and recurring revenue streams within the law enforcement technology space. Its growth trajectory is impressive, but it operates with a thinner margin of safety due to elevated valuation multiples and a weaker capital return profile. Axon suits portfolios aiming for aggressive growth with tolerance for higher volatility and risk.
If you prioritize capital preservation and steady value creation, General Dynamics outshines with its proven ability to generate economic profit and financial resilience. However, if you seek high growth potential and can weather valuation swings, Axon offers superior top-line momentum and innovation-driven upside. Both present analytical scenarios tailored to distinct investor profiles, balancing risk and reward.
Disclaimer: Investment carries a risk of loss of initial capital. The past performance is not a reliable indicator of future results. Be sure to understand risks before making an investment decision.
Go Further
I encourage you to read the complete analyses of General Dynamics Corporation and Axon Enterprise, Inc. to enhance your investment decisions: