Home > Comparison > Industrials > GE vs AXON
The strategic rivalry between GE Aerospace and Axon Enterprise defines the current trajectory of the Industrials sector’s Aerospace & Defense industry. GE Aerospace operates as a capital-intensive aerospace giant with a broad portfolio in jet engines and defense systems. Axon Enterprise, by contrast, focuses on high-tech conducted energy devices and digital law enforcement solutions. This analysis will reveal which business model offers superior risk-adjusted returns for a diversified portfolio amid evolving sector dynamics.
Table of contents
Companies Overview
GE Aerospace and Axon Enterprise, Inc. hold pivotal roles in the Aerospace & Defense sector, shaping industry innovation and security solutions.
GE Aerospace: Leader in Jet Engine Technology
GE Aerospace dominates as a premier aircraft engine manufacturer. Its core revenue derives from designing, producing, and servicing jet and turboprop engines for commercial and military aircraft. In 2026, GE focuses strategically on expanding its Commercial Engines & Services segment while advancing defense propulsion technologies to sustain its competitive edge.
Axon Enterprise, Inc.: Innovator in Law Enforcement Tech
Axon Enterprise, Inc. specializes in conducted energy devices and digital evidence management solutions. It generates revenue through sales of TASER devices and integrated software for law enforcement. The company prioritizes enhancing real-time situational awareness tools, leveraging cloud-based platforms and strategic partnerships to strengthen operational efficiency in 2026.
Strategic Collision: Similarities & Divergences
Both companies innovate within Aerospace & Defense but diverge sharply on business models. GE Aerospace emphasizes heavy industrial manufacturing and long-term service contracts, while Axon pursues a technology-driven, software-hardware ecosystem. Their battleground lies in delivering critical safety and operational solutions. Investors find GE offering scale and legacy strength, contrasting with Axon’s growth-oriented, tech-centric profile.
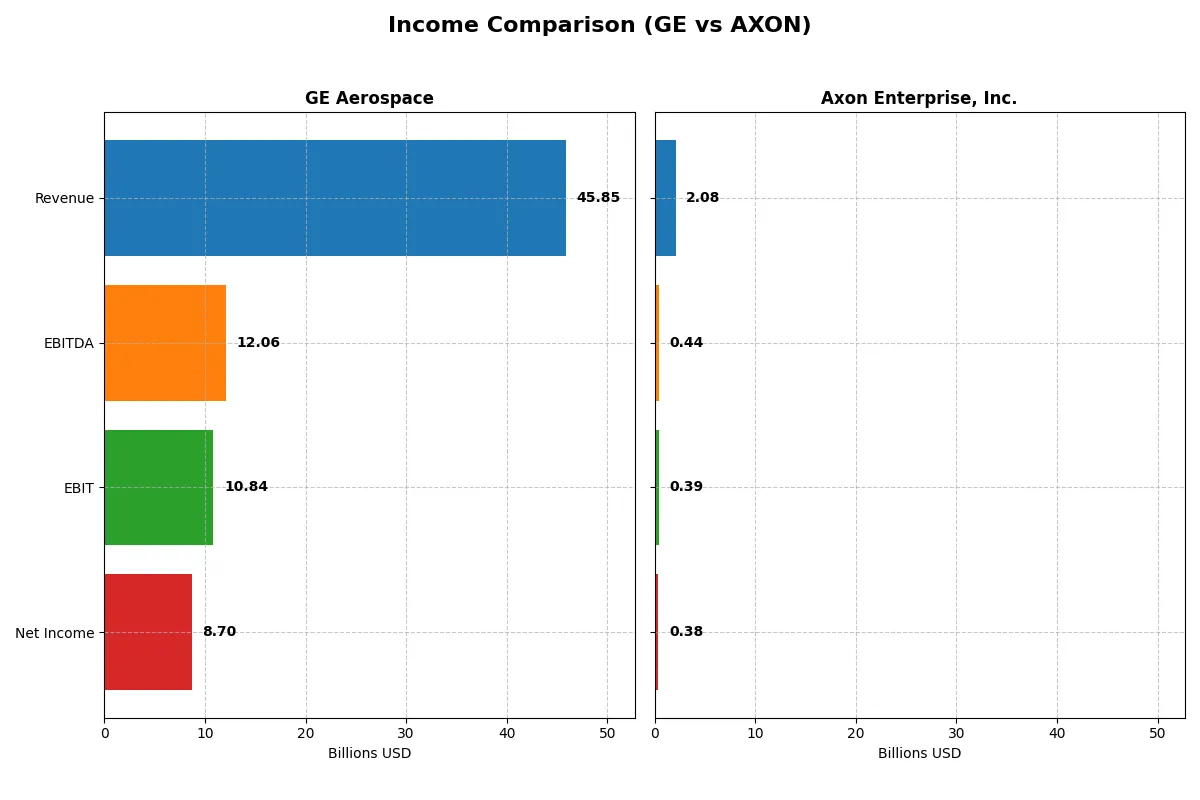
Income Statement Comparison
This data dissects the core profitability and scalability of both corporate engines to reveal who dominates the bottom line:
| Metric | GE Aerospace (GE) | Axon Enterprise, Inc. (AXON) |
|---|---|---|
| Revenue | 45.9B | 2.1B |
| Cost of Revenue | 28.97B | 841M |
| Operating Expenses | 8.12B | 1.18B |
| Gross Profit | 16.89B | 1.24B |
| EBITDA | 12.06B | 437M |
| EBIT | 10.84B | 389M |
| Interest Expense | 843M | 7.1M |
| Net Income | 8.70B | 377M |
| EPS | 8.16 | 4.98 |
| Fiscal Year | 2025 | 2024 |
Income Statement Analysis: The Bottom-Line Duel
This income statement comparison reveals which corporate engine delivers superior efficiency and sustainable profitability across recent market cycles.
GE Aerospace Analysis
GE Aerospace’s revenue rose from 29B in 2022 to 46B in 2025, showing strong recovery after a sharp 2021 loss. Its gross margin holds steady near 37%, while net margin improved to nearly 19% in 2025. The company’s 25.99% EBIT growth in 2025 signals accelerating operational momentum and disciplined cost control.
Axon Enterprise, Inc. Analysis
Axon’s revenue surged from 681M in 2020 to 2.08B in 2024, reflecting rapid expansion. Gross margin impresses at 60%, well above industry norms, though operating expenses grew faster than revenue last year. EBIT doubled in 2024, driving a net margin near 18%. The company exhibits high growth momentum despite margin pressures.
Revenue Scale vs. Margin Power
GE Aerospace leads in absolute scale and margin stability with consistent profitability gains after restructuring. Axon excels in growth velocity and margin expansion from a smaller base but faces rising cost ratios. Investors favoring scale and margin resilience may prefer GE, while growth-oriented profiles will find Axon’s rapid expansion more compelling.
Financial Ratios Comparison
These vital ratios act as a diagnostic tool to expose the underlying fiscal health, valuation premiums, and capital efficiency of the companies analyzed:
| Ratios | GE Aerospace (GE) | Axon Enterprise, Inc. (AXON) |
|---|---|---|
| ROE | 46.60% | 16.20% |
| ROIC | 8.12% | 1.66% |
| P/E | 37.8 | 119.4 |
| P/B | 17.60 | 19.34 |
| Current Ratio | 1.04 | 1.37 |
| Quick Ratio | 0.74 | 1.21 |
| D/E | 1.10 | 0.60 |
| Debt-to-Assets | 15.7% | 31.3% |
| Interest Coverage | 10.4 | 8.25 |
| Asset Turnover | 0.35 | 0.47 |
| Fixed Asset Turnover | 5.74 | 8.42 |
| Payout ratio | 16.7% | 0% |
| Dividend yield | 0.44% | 0% |
| Fiscal Year | 2025 | 2024 |
Efficiency & Valuation Duel: The Vital Signs
Financial ratios act as the company’s DNA, uncovering hidden risks and operational excellence behind headline figures.
GE Aerospace
GE Aerospace delivers a strong 46.6% ROE and a healthy 19% net margin, signaling robust profitability. However, its P/E of 37.8 and P/B of 17.6 mark the stock as expensive and stretched. Shareholder returns include a modest 0.44% dividend yield, reflecting a cautious capital allocation amid neutral liquidity and leverage metrics.
Axon Enterprise, Inc.
Axon posts a decent 16.2% ROE and 18.1% net margin but suffers from an uncompetitive 1.66% ROIC versus a 10.2% WACC. Its valuation is highly stretched with a P/E above 119 and P/B near 19. Axon pays no dividend, instead reinvesting heavily in R&D, consistent with its growth-focused profile and strong interest coverage.
Premium Valuation vs. Operational Safety
Both companies exhibit slightly unfavorable ratio profiles, yet GE balances superior profitability with more reasonable capital efficiency. Axon’s lofty multiples and weak ROIC heighten risk despite solid margins. GE suits investors prioritizing operational strength; Axon fits those chasing innovation-driven growth despite valuation risks.
Which one offers the Superior Shareholder Reward?
I observe that GE Aerospace pays a modest dividend yield around 0.44%–0.56%, supported by a sustainable payout ratio near 16%. Its dividend is well-covered by free cash flow at over 80%, complemented by steady buybacks enhancing shareholder returns. Axon Enterprise does not pay dividends, instead reinvesting heavily in growth and R&D, with no buybacks. Axon’s high valuation multiples (P/E above 100) reflect premium growth expectations but carry valuation risk. I judge GE Aerospace’s balanced yield-plus-buyback model offers a more attractive, lower-risk total return profile for 2026 investors than Axon’s aggressive growth-only strategy.
Comparative Score Analysis: The Strategic Profile
The radar chart reveals the fundamental DNA and trade-offs of both firms, highlighting key strengths and vulnerabilities across critical financial metrics:
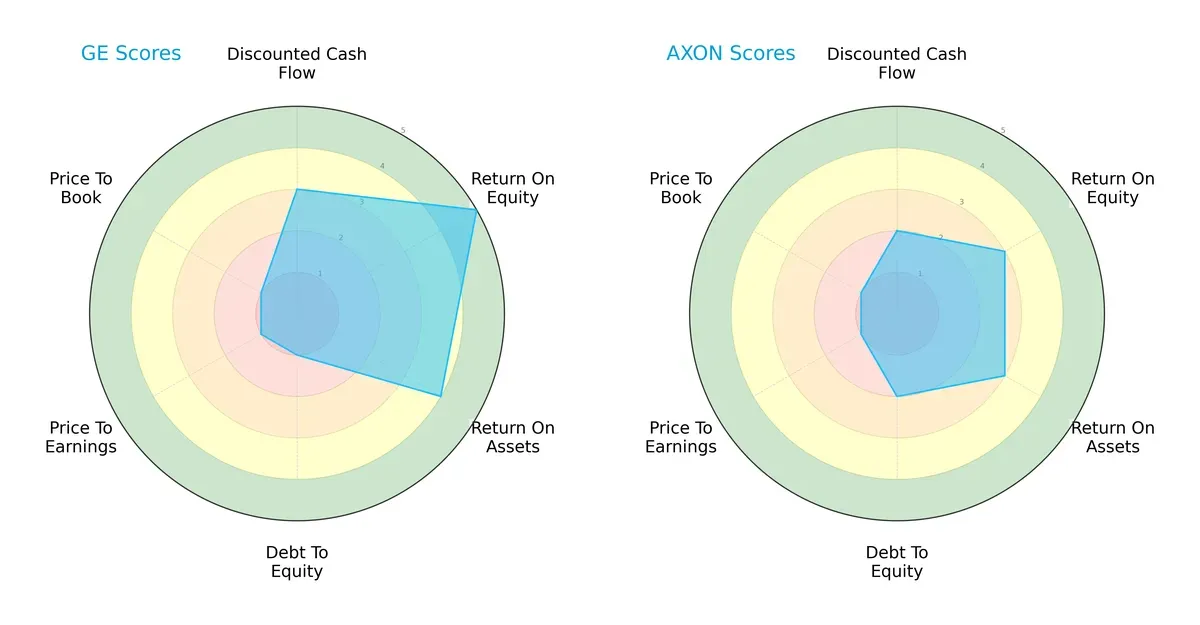
GE Aerospace showcases a more robust profit generation with higher ROE (5) and ROA (4) scores than Axon Enterprise (3 and 3). However, GE’s balance sheet is strained, indicated by a very unfavorable debt-to-equity score (1) and valuation ratios (P/E and P/B both 1). Axon’s profile is more balanced with moderate scores in leverage (2) and profitability but lacks GE’s efficiency edge. GE leans heavily on operational efficiency, while Axon maintains moderate financial stability and less risk exposure.
Bankruptcy Risk: Solvency Showdown
The Altman Z-Score difference signals a clear safety margin:
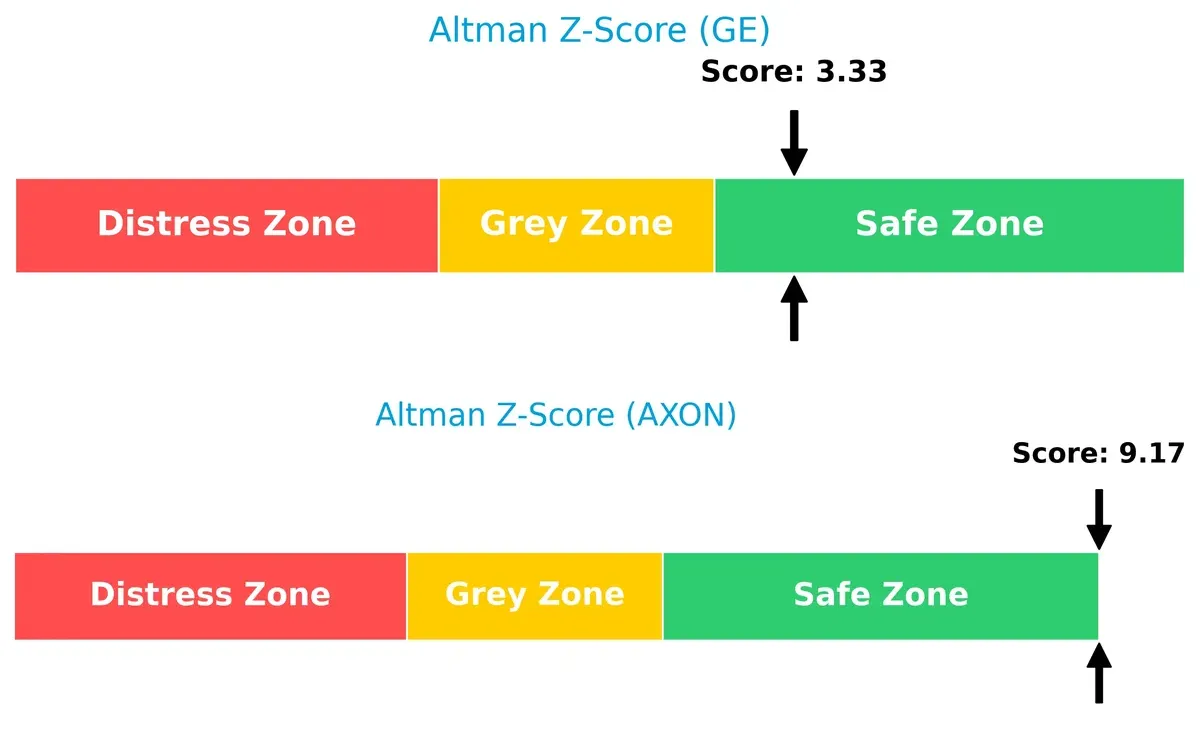
Axon Enterprise’s Z-score of 9.17 places it deep in the safe zone, indicating strong solvency and very low bankruptcy risk. GE Aerospace’s score of 3.33, while also in the safe zone, borders on a moderate risk threshold, reflecting higher financial leverage and potential vulnerability in a downturn. I see Axon as better positioned for long-term survival in volatile cycles.
Financial Health: Quality of Operations
Piotroski F-Scores reflect internal operational strength and risk:
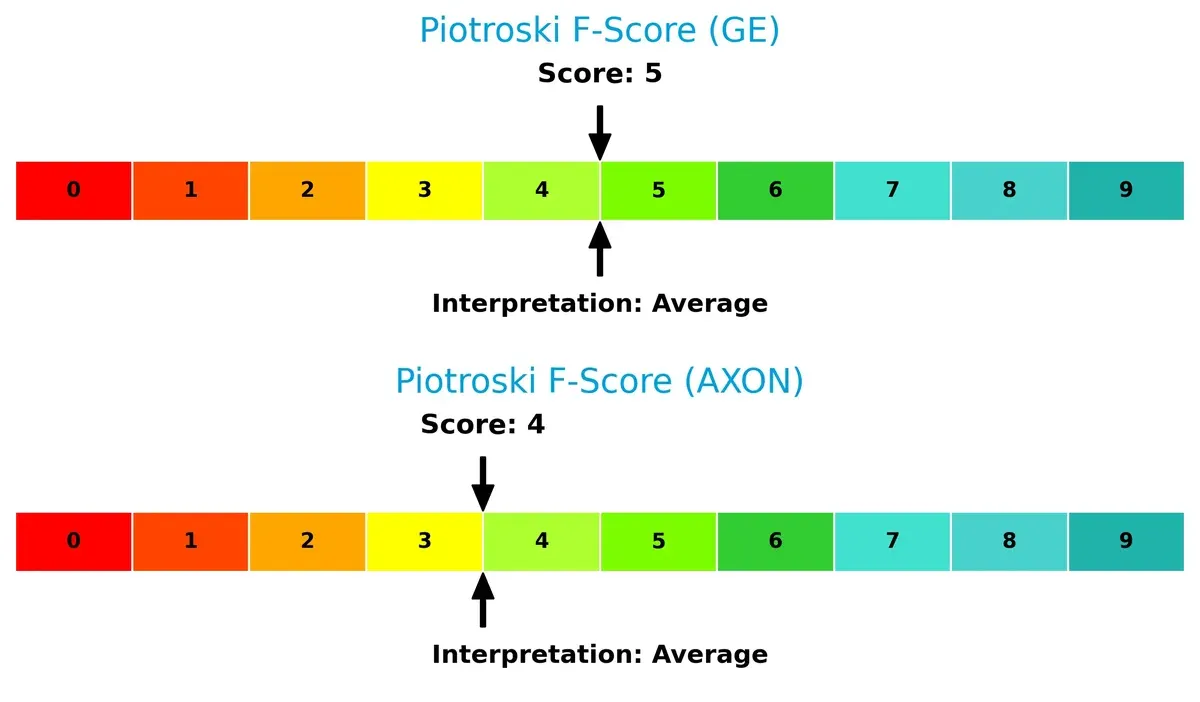
GE Aerospace scores 5, and Axon Enterprise scores 4, both in the average range. Neither firm demonstrates peak financial health. GE’s slightly higher score suggests marginally better profitability and efficiency metrics, but neither company escapes red flags in operational consistency. Investors should remain cautious on internal metrics when considering these stocks.
How are the two companies positioned?
This section dissects GE Aerospace and Axon Enterprise’s operational DNA by comparing revenue distribution and internal strengths and weaknesses. The goal is to confront their economic moats to determine which model delivers a more resilient, sustainable competitive advantage today.
Revenue Segmentation: The Strategic Mix
This visual comparison dissects how GE Aerospace and Axon Enterprise diversify income streams and where their primary sector bets lie:
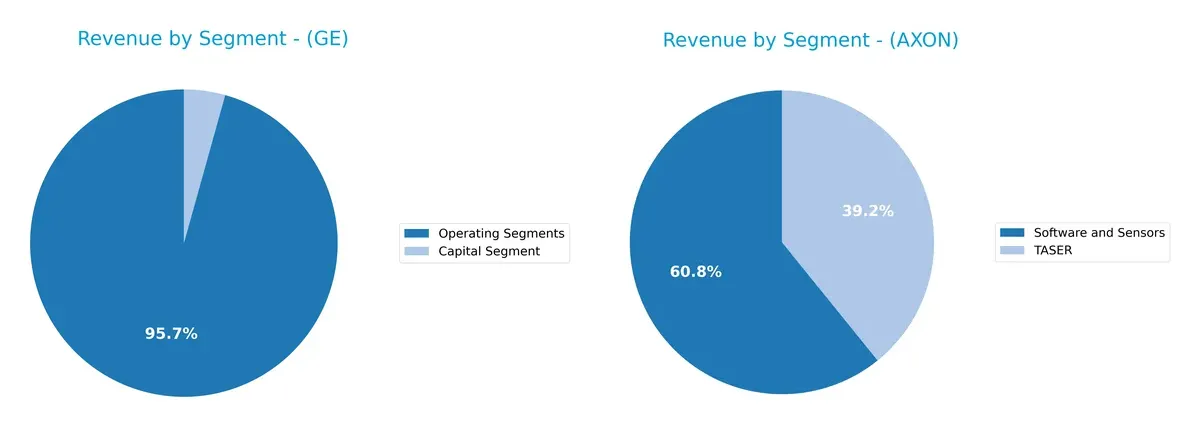
GE Aerospace anchors revenue in its Aerospace Segment at $31.8B with strong contributions from Power ($17.7B) and Renewable Energy ($15.1B). This mix shows a robust industrial ecosystem with infrastructure dominance but moderate concentration risk. Axon Enterprise pivots around Software and Sensors ($951M) and TASER ($613M), reflecting a focused tech and hardware model. GE’s diversified industrial base dwarfs Axon’s narrower, innovation-driven portfolio, highlighting different strategic moats.
Strengths and Weaknesses Comparison
This table compares the strengths and weaknesses of GE Aerospace and Axon Enterprise, Inc.:
GE Strengths
- Diverse revenue streams across aerospace, power, renewable energy
- Strong net margin at 18.98%
- High ROE of 46.6% indicates efficient equity use
- Favorable debt-to-assets ratio at 15.74%
- Solid interest coverage at 12.86x
- Significant global presence including US and Asia
Axon Strengths
- Positive net margin of 18.1%
- Favorable ROE at 16.2%
- Strong quick ratio of 1.21 indicates liquidity
- High interest coverage at 54.75x
- Growing software and sensors segment
- Focused US market presence with expanding international sales
GE Weaknesses
- Unfavorable PE and PB ratios imply high valuation
- Quick ratio below 1 at 0.74 signals liquidity risk
- Debt-to-equity ratio of 1.1 is elevated
- Low asset turnover at 0.35 reflects capital inefficiency
- Low dividend yield of 0.44%
- Neutral ROIC below WACC at 8.12% vs 9.99%
Axon Weaknesses
- Very high PE of 119.4 suggests overvaluation
- Unfavorable ROIC at 1.66% well below WACC of 10.18%
- No dividend yield
- Asset turnover at 0.47 remains weak
- Moderate debt-to-assets at 31.33%
- Relatively narrow product diversification
GE shows robust profitability and global diversification but faces valuation and liquidity concerns. Axon maintains liquidity and interest coverage strengths but struggles with high valuation and limited diversification. These factors shape each company’s strategic focus on financial health and growth opportunities.
The Moat Duel: Analyzing Competitive Defensibility
A structural moat shields long-term profits from relentless competition erosion. Without it, gains erode quickly. Let’s dissect the competitive moats of two aerospace and defense players:
GE Aerospace: Intangible Assets and Scale Powerhouse
GE Aerospace leverages decades of brand equity and technological expertise. Its stable margins and 19% net margin reflect strong intangible assets. Expansion into defense propulsion deepens this moat in 2026.
Axon Enterprise, Inc.: Network Effects in Public Safety Tech
Axon’s moat stems from its integrated hardware-software ecosystem, locking in law enforcement agencies. Its 60% gross margin signals pricing power. Continued innovation in real-time crime solutions could magnify its moat.
Verdict: Intangible Assets vs. Network Effect Lock-in
Both firms show growing profitability but shed value relative to cost of capital. GE’s broader scale and multi-segment reach offer a wider moat. Axon’s focused ecosystem is deep but narrower. GE is better positioned to defend market share amid competitive pressures.
Which stock offers better returns?
The stock price movements over the past year reveal strong gains for both companies, with GE Aerospace showing a higher overall increase but recent stability, while Axon Enterprise exhibits greater volatility and a recent decline.
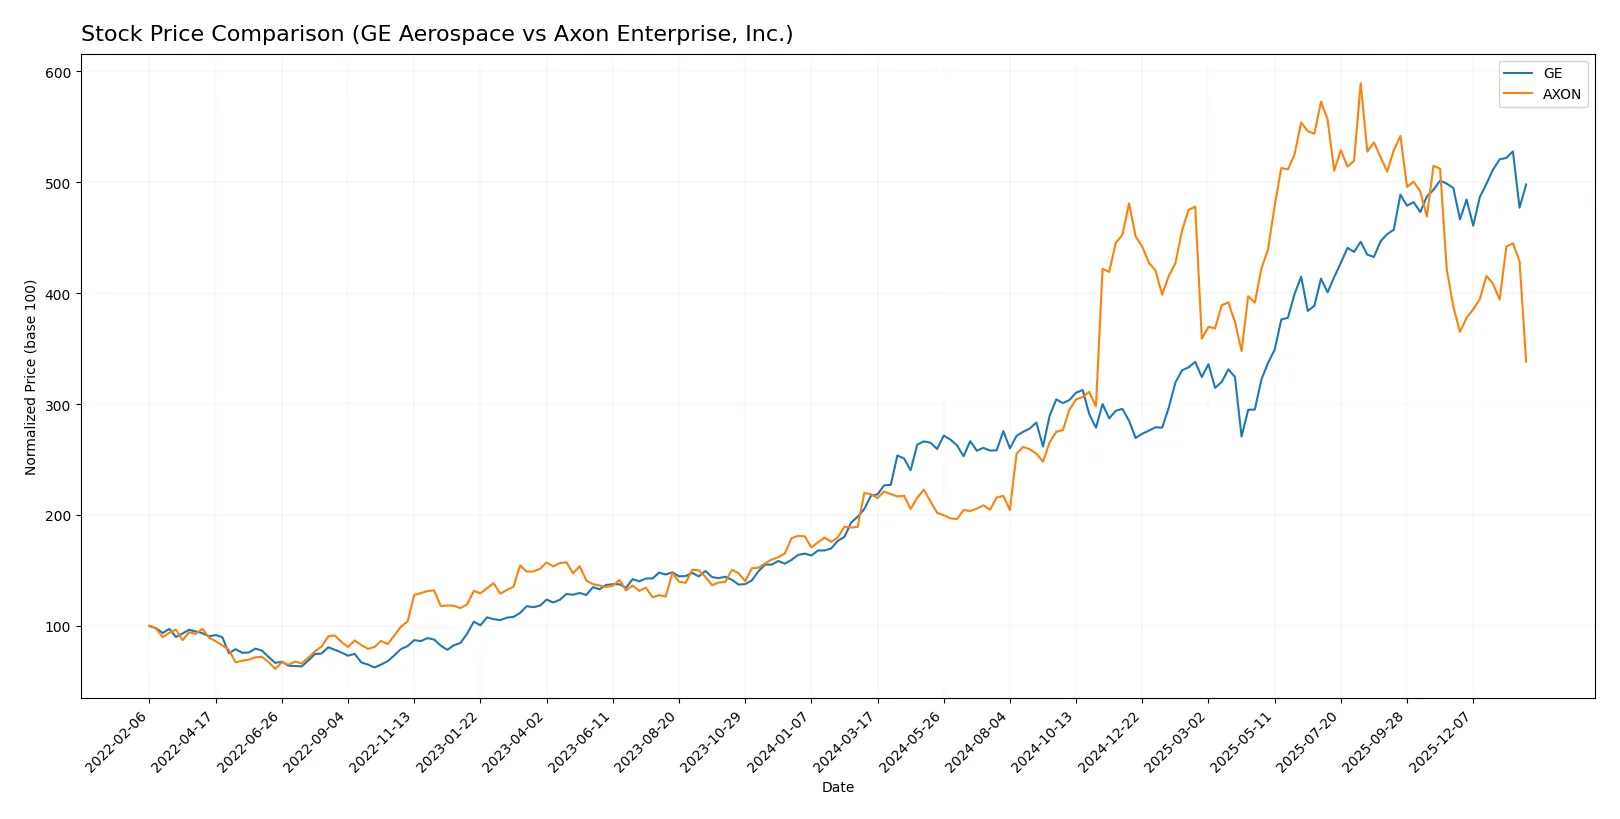
Trend Comparison
GE Aerospace’s stock rose 129.03% over the last 12 months, marking a bullish trend with decelerating momentum and a high volatility of 56.42%. The recent three-month period shows a neutral 0.65% gain.
Axon Enterprise’s stock increased 54.6% over the same 12 months, also bullish but with decelerating acceleration and much higher volatility at 170.39%. Recently, it declined 12.77%, signaling a bearish short-term trend.
Comparing both, GE Aerospace delivered the strongest market performance over the year, despite Axon’s higher recent volatility and short-term pullback.
Target Prices
Analysts present a bullish target consensus for both GE Aerospace and Axon Enterprise, Inc.
| Company | Target Low | Target High | Consensus |
|---|---|---|---|
| GE Aerospace | 374 | 387 | 380.33 |
| Axon Enterprise, Inc. | 713 | 900 | 814.78 |
The consensus targets imply upside potential of roughly 24% for GE Aerospace and 69% for Axon from current prices. Analysts expect strong growth relative to today’s valuations.

Don’t Let Luck Decide Your Entry Point
Optimize your entry points with our advanced ProRealTime indicators. You’ll get efficient buy signals with precise price targets for maximum performance. Start outperforming now!
How do institutions grade them?
Below is a comparison of institutional grades for GE Aerospace and Axon Enterprise, Inc.:
GE Aerospace Grades
This table summarizes recent grades from major financial institutions for GE Aerospace.
| Grading Company | Action | New Grade | Date |
|---|---|---|---|
| JP Morgan | maintain | Overweight | 2026-01-26 |
| Citigroup | maintain | Buy | 2026-01-23 |
| UBS | maintain | Buy | 2026-01-23 |
| UBS | maintain | Buy | 2026-01-15 |
| Citigroup | maintain | Buy | 2026-01-13 |
| JP Morgan | maintain | Overweight | 2025-10-27 |
| B of A Securities | maintain | Buy | 2025-10-27 |
| UBS | maintain | Buy | 2025-10-22 |
| RBC Capital | maintain | Outperform | 2025-10-22 |
| Barclays | maintain | Overweight | 2025-07-23 |
Axon Enterprise, Inc. Grades
This table presents recent institutional grades for Axon Enterprise, Inc.
| Grading Company | Action | New Grade | Date |
|---|---|---|---|
| Morgan Stanley | maintain | Overweight | 2025-12-17 |
| Barclays | maintain | Overweight | 2025-11-06 |
| Piper Sandler | maintain | Overweight | 2025-11-05 |
| UBS | maintain | Neutral | 2025-11-05 |
| Goldman Sachs | maintain | Buy | 2025-11-05 |
| JMP Securities | maintain | Market Outperform | 2025-09-29 |
| Needham | maintain | Buy | 2025-09-24 |
| B of A Securities | maintain | Buy | 2025-08-06 |
| Raymond James | maintain | Outperform | 2025-08-05 |
| Craig-Hallum | upgrade | Buy | 2025-08-05 |
Which company has the best grades?
GE Aerospace consistently receives Buy to Overweight ratings from top firms, showing broad institutional confidence. Axon Enterprise has mostly Overweight and Buy ratings but includes a Neutral, indicating mixed views. Investors may see GE’s steadier positive grades as reflecting greater market endorsement.
Risks specific to each company
The following categories identify the critical pressure points and systemic threats facing both firms in the 2026 market environment:
1. Market & Competition
GE Aerospace
- Faces intense competition in aerospace engines with pressure on innovation and pricing from global rivals.
Axon Enterprise, Inc.
- Competes in a niche but rapidly evolving market for law enforcement tech, challenged by regulatory shifts and tech adoption.
2. Capital Structure & Debt
GE Aerospace
- Has a high debt-to-equity ratio (1.1) signaling financial leverage risk despite favorable interest coverage.
Axon Enterprise, Inc.
- Maintains moderate debt levels (D/E 0.6) with strong interest coverage, presenting lower financial risk.
3. Stock Volatility
GE Aerospace
- Beta of 1.40 indicates above-market volatility, typical for cyclical industrials.
Axon Enterprise, Inc.
- Slightly higher beta at 1.41, reflecting sensitivity to tech sector swings and news flow.
4. Regulatory & Legal
GE Aerospace
- Subject to strict aerospace and defense regulations globally, with potential export controls and compliance costs.
Axon Enterprise, Inc.
- Faces increasing scrutiny on law enforcement tech, privacy laws, and product liability risks.
5. Supply Chain & Operations
GE Aerospace
- Complex global supply chains vulnerable to geopolitical disruptions and raw material price swings.
Axon Enterprise, Inc.
- Relies on specialized components and cloud infrastructure, exposing it to tech supply chain and cybersecurity risks.
6. ESG & Climate Transition
GE Aerospace
- Increasing pressure to reduce carbon footprint in manufacturing and product lifecycle amid aerospace decarbonization trends.
Axon Enterprise, Inc.
- ESG focus on privacy, data security, and sustainable tech deployment, but less carbon-intensive operations.
7. Geopolitical Exposure
GE Aerospace
- Significant exposure to U.S.-China tensions and defense spending variability worldwide.
Axon Enterprise, Inc.
- Lower direct geopolitical risk but dependent on U.S. law enforcement budgets and international adoption rates.
Which company shows a better risk-adjusted profile?
GE Aerospace’s largest risk lies in its elevated financial leverage and operational complexity in a cyclical industry. Axon’s key risk is valuation premium and regulatory/legal uncertainties in a fast-evolving tech niche. Both firms exhibit slightly unfavorable financial ratios, but Axon’s stronger balance sheet and safer Altman Z-Score (9.17 vs. 3.33) suggest a marginally better risk-adjusted profile despite high valuation. Recent market volatility impacting Axon’s price range and regulatory scrutiny justify investor caution.
Final Verdict: Which stock to choose?
GE Aerospace stands out as a cash-generating industrial powerhouse with a strong return on equity and improving profitability. Its main point of vigilance lies in its stretched valuation multiples and moderate liquidity ratios. This company suits investors seeking exposure in an aggressive growth portfolio with industrial innovation.
Axon Enterprise, Inc. benefits from a niche strategic moat in public safety technology and recurring revenue streams. It offers a relatively safer balance sheet and higher interest coverage than GE. Axon fits well within a GARP (Growth at a Reasonable Price) portfolio focused on steady innovation and moderate risk.
If you prioritize robust industrial cash flow and high equity returns, GE Aerospace is the compelling choice due to its improving profitability despite valuation concerns. However, if you seek steady growth with a more defensible niche and superior liquidity, Axon offers better stability and a clearer runway for innovation. Both present slightly unfavorable moat metrics, so cautious monitoring remains essential.
Disclaimer: Investment carries a risk of loss of initial capital. The past performance is not a reliable indicator of future results. Be sure to understand risks before making an investment decision.
Go Further
I encourage you to read the complete analyses of GE Aerospace and Axon Enterprise, Inc. to enhance your investment decisions: