Investors seeking opportunities in the aerospace and defense sector often encounter Axon Enterprise, Inc. and BWX Technologies, Inc., two prominent players with distinct yet overlapping market focuses. Axon leads in innovative public safety technologies, while BWX specializes in advanced nuclear components and services. This comparison explores their strategic positioning and innovation potential to help you decide which company best fits your investment portfolio in 2026. Let’s uncover which stock offers the most compelling value.
Table of contents
Companies Overview
I will begin the comparison between Axon Enterprise, Inc. and BWX Technologies, Inc. by providing an overview of these two companies and their main differences.
Axon Enterprise, Inc. Overview
Axon Enterprise, Inc. specializes in developing and selling conducted energy devices under the TASER brand, alongside hardware and cloud-based software solutions for law enforcement. The company operates primarily through TASER and Software and Sensors segments, providing products like body cameras and digital evidence management software. Headquartered in Scottsdale, Arizona, Axon serves both domestic and international markets in the aerospace and defense industry.
BWX Technologies, Inc. Overview
BWX Technologies, Inc. manufactures and sells nuclear components and services across three segments: Nuclear Operations, Nuclear Power, and Nuclear Services. Its product range includes naval nuclear propulsion components, commercial nuclear power equipment, and nuclear materials processing. Founded in 1867 and based in Lynchburg, Virginia, BWXT supports government, commercial, and research sectors in the aerospace and defense industry.
Key similarities and differences
Both companies operate within the aerospace and defense sector, serving government and specialized industrial markets. Axon focuses on law enforcement technologies and digital solutions, while BWXT concentrates on nuclear components and services. Axon’s business model combines hardware sales with cloud-based software, whereas BWXT provides a broad range of manufacturing and technical services related to nuclear power and defense applications.
Income Statement Comparison
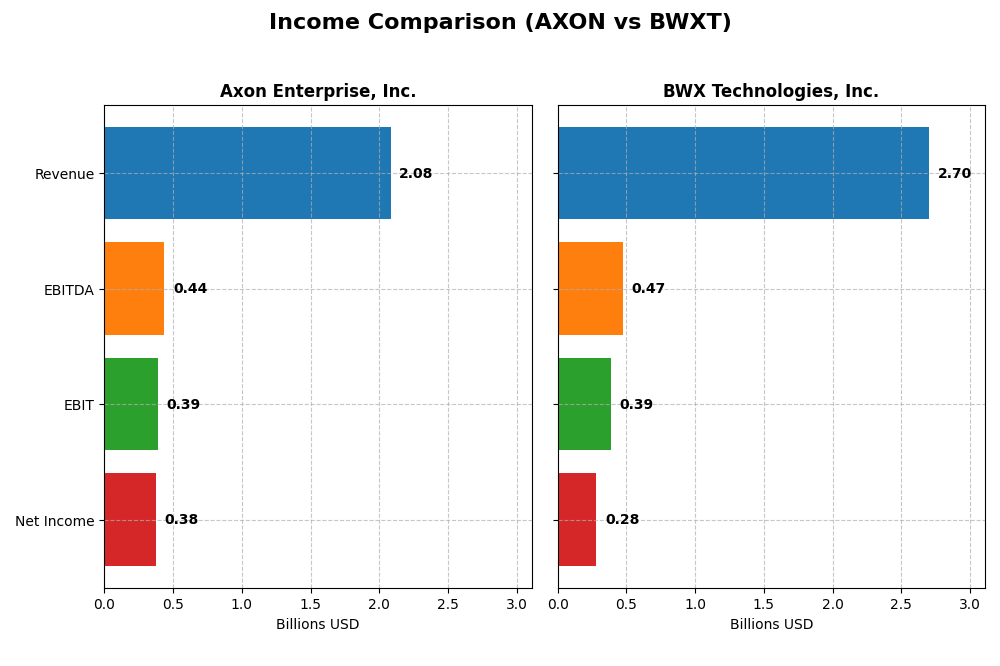
The table below presents a side-by-side comparison of key income statement metrics for Axon Enterprise, Inc. and BWX Technologies, Inc. for the fiscal year 2024.
| Metric | Axon Enterprise, Inc. | BWX Technologies, Inc. |
|---|---|---|
| Market Cap | 48.4B | 17.7B |
| Revenue | 2.08B | 2.70B |
| EBITDA | 437M | 474M |
| EBIT | 389M | 388M |
| Net Income | 377M | 282M |
| EPS | 4.98 | 3.08 |
| Fiscal Year | 2024 | 2024 |
Income Statement Interpretations
Axon Enterprise, Inc.
Axon showed robust revenue growth from 2020 to 2024, surging from $681M to $2.08B, with net income turning positive and reaching $377M in 2024. Margins improved significantly, evidenced by a gross margin of 59.61% and a net margin of 18.1% in 2024. The latest year marked strong earnings growth and margin expansion despite rising operating expenses.
BWX Technologies, Inc.
BWXT’s revenue increased steadily from $2.12B in 2020 to $2.7B in 2024, with net income rising modestly to $282M. Margins remained stable but comparatively lower than Axon, with a gross margin of 24.23% and a net margin of 10.43% in 2024. The company experienced moderate growth in earnings and margins in the most recent year, reflecting consistent but slower expansion.
Which one has the stronger fundamentals?
Axon exhibits stronger fundamentals with higher revenue and net income growth, superior margins, and more pronounced improvements in profitability metrics over the period. BWXT, while stable and profitable, shows slower growth and lower margin levels. Both companies maintain favorable income statement evaluations, but Axon’s momentum and margin expansion stand out more distinctly.
Financial Ratios Comparison
The table below presents a side-by-side comparison of key financial ratios for Axon Enterprise, Inc. and BWX Technologies, Inc. based on their most recent fiscal year data (2024).
| Ratios | Axon Enterprise, Inc. (AXON) | BWX Technologies, Inc. (BWXT) |
|---|---|---|
| ROE | 16.2% | 26.1% |
| ROIC | 1.7% | 12.8% |
| P/E | 119.4 | 36.2 |
| P/B | 19.3 | 9.4 |
| Current Ratio | 1.37 | 1.96 |
| Quick Ratio | 1.21 | 1.88 |
| D/E | 0.60 | 1.00 |
| Debt-to-Assets | 31.3% | 37.5% |
| Interest Coverage | 8.25 | 9.64 |
| Asset Turnover | 0.47 | 0.94 |
| Fixed Asset Turnover | 8.42 | 2.12 |
| Payout Ratio | 0 | 31.3% |
| Dividend Yield | 0% | 0.87% |
Interpretation of the Ratios
Axon Enterprise, Inc.
Axon shows a mixed ratio profile with strong net margin (18.1%) and ROE (16.2%), indicating profitability and shareholder returns. However, its ROIC (1.66%) and valuation multiples like P/E (119.4) and P/B (19.34) appear stretched, raising caution on capital efficiency and overvaluation. The company does not pay dividends, likely focusing on reinvestment and growth.
BWX Technologies, Inc.
BWX presents a stronger overall ratio set with favorable net margin (10.43%), ROE (26.1%), and ROIC (12.77%), reflecting efficient capital use and profitability. Its WACC (7.49%) is below Axon’s, suggesting lower risk. Despite a moderate dividend yield of 0.87%, it maintains a reasonable payout amid stable coverage. Some valuation metrics like P/E (36.18) remain high but less extreme than Axon.
Which one has the best ratios?
BWXT’s ratios are generally more favorable, showing better capital returns, risk profile, and liquidity. Axon’s higher profitability is offset by concerns over capital efficiency and valuation extremes. BWXT’s balance of profitability and risk metrics leads to a slightly favorable overall ratio assessment compared to Axon’s slightly unfavorable profile.
Strategic Positioning
This section compares the strategic positioning of Axon Enterprise, Inc. and BWX Technologies, Inc. based on market position, key segments, and exposure to technological disruption:
Axon Enterprise, Inc.
- Market leader in law enforcement devices with moderate beta
- Focuses on TASER devices and software for evidence management
- Invests in cloud-based crime center solutions and body cams
BWX Technologies, Inc.
- Established in nuclear components with lower beta and stable market cap
- Operates Government and Commercial segments in nuclear technology
- Exposed to nuclear tech but no explicit disruption information provided
Axon Enterprise, Inc. vs BWX Technologies, Inc. Positioning
Axon has a more concentrated focus on law enforcement technology and digital evidence, while BWXT offers diversified nuclear components and services. Axon’s innovation in software contrasts with BWXT’s stable government contracts, reflecting different risk and growth profiles.
Which has the best competitive advantage?
BWXT shows a slightly favorable moat, creating value despite declining profitability. Axon is slightly unfavorable, shedding value but with growing profitability, indicating BWXT currently has a stronger competitive advantage.
Stock Comparison
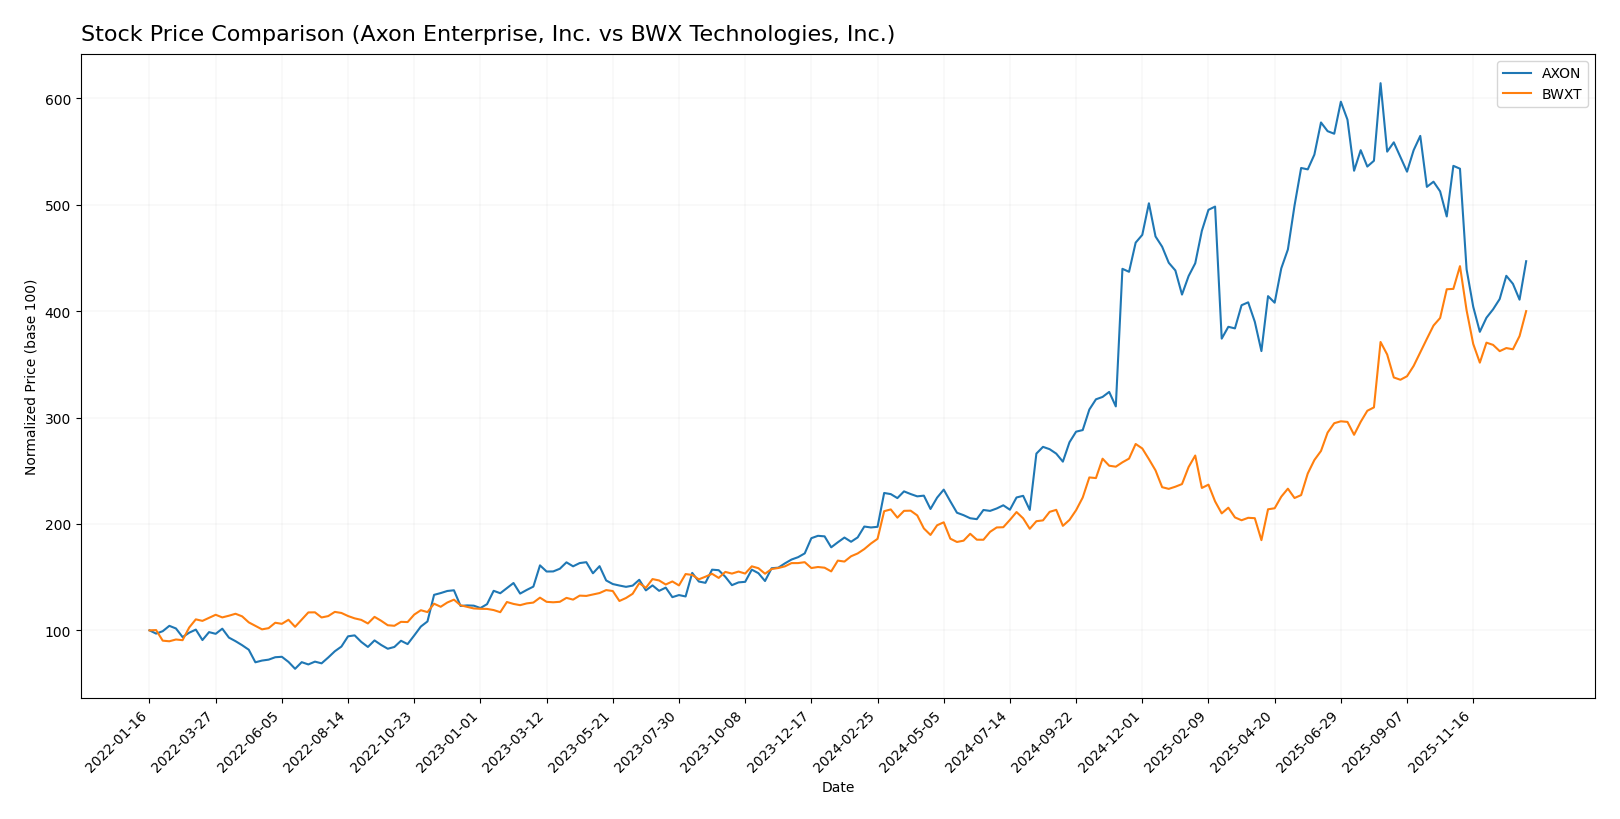
The stock price movements of Axon Enterprise, Inc. and BWX Technologies, Inc. over the past 12 months show strong bullish trends with significant gains, followed by recent decelerations in price momentum and shifts in buyer-seller dynamics.
Trend Analysis
Axon Enterprise, Inc. experienced a bullish trend over the past year with a 127.2% price increase, though recently it showed a 16.71% decline with decelerating momentum and higher volatility (std deviation 175.35).
BWX Technologies, Inc. also posted a bullish 120.27% rise over the year, with a recent 4.96% price drop and deceleration; volatility remains moderate with a std deviation of 33.8.
Comparing the two, Axon delivered the highest market performance over the 12-month period, despite both stocks facing recent downward pressure and slightly seller-dominant trading behavior.
Target Prices
The consensus target prices from verified analysts indicate optimistic upside potential for both Axon Enterprise, Inc. and BWX Technologies, Inc.
| Company | Target High | Target Low | Consensus |
|---|---|---|---|
| Axon Enterprise, Inc. | 900 | 713 | 814.78 |
| BWX Technologies, Inc. | 225 | 180 | 200 |
Axon’s consensus target price of 814.78 suggests a significant upside versus its current price of 612.98. BWX’s consensus target of 200 also indicates moderate growth potential above its current 193.20 price.
Analyst Opinions Comparison
This section compares the analysts’ ratings and grades for Axon Enterprise, Inc. and BWX Technologies, Inc.:
Rating Comparison
Axon Enterprise, Inc. Rating
- Rating: C+ with a “Very Favorable” status
- Discounted Cash Flow Score: 3, assessed as Moderate
- Return on Equity Score: 3, assessed as Moderate
- Return on Assets Score: 3, assessed as Moderate
- Debt To Equity Score: 2, assessed as Moderate
- Overall Score: 2, assessed as Moderate
BWX Technologies, Inc. Rating
- Rating: B- with a “Very Favorable” status
- Discounted Cash Flow Score: 3, assessed as Moderate
- Return on Equity Score: 5, assessed as Very Favorable
- Return on Assets Score: 4, assessed as Favorable
- Debt To Equity Score: 1, assessed as Very Unfavorable
- Overall Score: 3, assessed as Moderate
Which one is the best rated?
Based strictly on the data, BWX Technologies holds a higher overall rating (B-) and stronger scores in Return on Equity and Return on Assets. However, it has a weaker Debt to Equity score compared to Axon Enterprise, which has moderate scores but a lower overall rating (C+).
Scores Comparison
The comparison of Axon and BWXT scores provides insight into their financial health and bankruptcy risk:
Axon Scores
- Altman Z-Score: 8.68, indicating a safe zone from bankruptcy risk.
- Piotroski Score: 4, reflecting average financial strength.
BWXT Scores
- Altman Z-Score: 6.55, also indicating a safe zone from bankruptcy risk.
- Piotroski Score: 5, reflecting average financial strength.
Which company has the best scores?
Axon has a higher Altman Z-Score than BWXT, suggesting lower bankruptcy risk, while BWXT has a slightly better Piotroski Score. Both companies are in the safe zone with average financial strength.
Grades Comparison
Here is a comparison of the most recent and reliable grades for Axon Enterprise, Inc. and BWX Technologies, Inc.:
Axon Enterprise, Inc. Grades
The table below summarizes recent grades from recognized financial institutions for Axon Enterprise, Inc.
| Grading Company | Action | New Grade | Date |
|---|---|---|---|
| Morgan Stanley | maintain | Overweight | 2025-12-17 |
| Barclays | maintain | Overweight | 2025-11-06 |
| Piper Sandler | maintain | Overweight | 2025-11-05 |
| UBS | maintain | Neutral | 2025-11-05 |
| Goldman Sachs | maintain | Buy | 2025-11-05 |
| JMP Securities | maintain | Market Outperform | 2025-09-29 |
| Needham | maintain | Buy | 2025-09-24 |
| B of A Securities | maintain | Buy | 2025-08-06 |
| Northland Capital Markets | maintain | Outperform | 2025-08-05 |
| Raymond James | maintain | Outperform | 2025-08-05 |
The overall trend for Axon Enterprise, Inc. shows predominantly positive ratings, with multiple “Buy,” “Overweight,” and “Outperform” designations, reflecting generally optimistic analyst sentiment.
BWX Technologies, Inc. Grades
The table below shows recent grades for BWX Technologies, Inc. from established grading firms.
| Grading Company | Action | New Grade | Date |
|---|---|---|---|
| B of A Securities | maintain | Buy | 2025-11-13 |
| BTIG | maintain | Buy | 2025-11-07 |
| Truist Securities | maintain | Hold | 2025-11-04 |
| Truist Securities | maintain | Hold | 2025-10-15 |
| Deutsche Bank | maintain | Hold | 2025-10-08 |
| B of A Securities | maintain | Buy | 2025-08-13 |
| Deutsche Bank | maintain | Hold | 2025-08-06 |
| Maxim Group | downgrade | Hold | 2025-08-06 |
| Truist Securities | maintain | Hold | 2025-08-05 |
| Deutsche Bank | downgrade | Hold | 2025-07-08 |
BWX Technologies’ ratings indicate a mixed pattern, with a majority of “Hold” ratings and fewer “Buy” recommendations, alongside some recent downgrades, suggesting a more cautious analyst outlook.
Which company has the best grades?
Axon Enterprise, Inc. has received consistently stronger grades than BWX Technologies, Inc., with more “Buy,” “Overweight,” and “Outperform” ratings. This stronger consensus may signal greater analyst confidence in Axon’s growth potential, which could influence investor sentiment accordingly.
Strengths and Weaknesses
The following table summarizes the key strengths and weaknesses of Axon Enterprise, Inc. (AXON) and BWX Technologies, Inc. (BWXT) based on their diversification, profitability, innovation, global presence, and market share as of 2026.
| Criterion | Axon Enterprise, Inc. (AXON) | BWX Technologies, Inc. (BWXT) |
|---|---|---|
| Diversification | Moderate; focused mainly on law enforcement tech with Software & Sensors and TASER products | High; diversified between Government and Commercial nuclear operations segments |
| Profitability | Moderate net margin (18.1%) and ROE (16.2%), but ROIC below WACC indicating value destruction | Strong profitability with net margin 10.43%, ROE 26.09%, ROIC above WACC, creating value |
| Innovation | Strong growth in software and sensor technology revenues, driving innovation | Stable but less aggressive innovation given nuclear industry constraints |
| Global presence | Growing presence but primarily North American market focus | Established global footprint in nuclear energy and government contracts |
| Market Share | Leading in law enforcement tech niche but niche market size limits scale | Significant share in nuclear technology and services market |
Key takeaways: BWXT shows a more favorable financial profile with consistent value creation and diversification across nuclear sectors, despite a slight decline in ROIC trend. Axon has strong innovation and profitability metrics but struggles with capital efficiency, resulting in value destruction despite growing profitability. Investors should weigh Axon’s growth potential against BWXT’s stability and diversified revenue base.
Risk Analysis
The table below summarizes key risks for Axon Enterprise, Inc. (AXON) and BWX Technologies, Inc. (BWXT) based on their latest financial and operational profiles for 2024.
| Metric | Axon Enterprise, Inc. (AXON) | BWX Technologies, Inc. (BWXT) |
|---|---|---|
| Market Risk | High beta (1.414) indicates elevated volatility | Moderate beta (0.852) suggests lower volatility |
| Debt Level | Moderate debt-to-assets ratio (31.3%), debt/equity 0.6 (neutral) | Moderate debt-to-assets (37.5%), debt/equity 1.0 (neutral) |
| Regulatory Risk | Moderate, due to law enforcement and defense product regulations | High, given nuclear manufacturing and strict government oversight |
| Operational Risk | Moderate, reliance on technology and cloud solutions | Elevated, complexity of nuclear manufacturing and services |
| Environmental Risk | Moderate, related to manufacturing and electronic waste | High, due to nuclear materials handling and environmental compliance |
| Geopolitical Risk | Moderate, international sales and law enforcement markets | High, nuclear sector sensitivity to geopolitical tensions |
Axon’s main risks stem from market volatility and operational dependence on technology upgrades, while BWXT faces significant regulatory and environmental risks tied to its nuclear operations. BWXT’s geopolitical exposure is also higher, given its defense contracts involving sensitive nuclear components. Both companies maintain moderate debt levels but must navigate their sector-specific challenges carefully.
Which Stock to Choose?
Axon Enterprise, Inc. has shown a strong income evolution with a 33.44% revenue growth in 2024 and a favorable net margin of 18.1%. Its financial ratios reveal a slightly unfavorable global profile, with a high P/E of 119.4 and moderate debt levels. Profitability is improving despite a slightly unfavorable MOAT status due to ROIC below WACC, supported by a very favorable rating of C+ and a safe Altman Z-Score.
BWX Technologies, Inc. reports steady income growth of 8.31% in 2024 with a net margin of 10.43%. Its financial ratios are slightly favorable overall, showing solid ROE of 26.1% and efficient capital use indicated by ROIC above WACC. The company holds a very favorable B- rating and a safe Altman Z-Score, though debt levels are higher and valuation ratios remain stretched.
For investors, Axon might appear attractive for those prioritizing growth and improving profitability, despite some valuation concerns. BWXT could be seen as more suitable for those valuing stable returns and efficient capital use, given its favorable MOAT and financial profile. The choice may depend on an investor’s risk tolerance and focus on growth versus value metrics.
Disclaimer: Investment carries a risk of loss of initial capital. The past performance is not a reliable indicator of future results. Be sure to understand risks before making an investment decision.
Go Further
I encourage you to read the complete analyses of Axon Enterprise, Inc. and BWX Technologies, Inc. to enhance your investment decisions: