Home > Comparison > Real Estate > AVB vs UDR
The strategic rivalry between AvalonBay Communities, Inc. and UDR, Inc. shapes the evolution of the residential REIT sector. AvalonBay operates as a capital-intensive developer and manager of large-scale apartment communities across key U.S. metros. In contrast, UDR emphasizes diversified ownership with a strong focus on redevelopment and service quality. This analysis aims to identify which operational model offers the best risk-adjusted return for a diversified real estate portfolio in 2026.
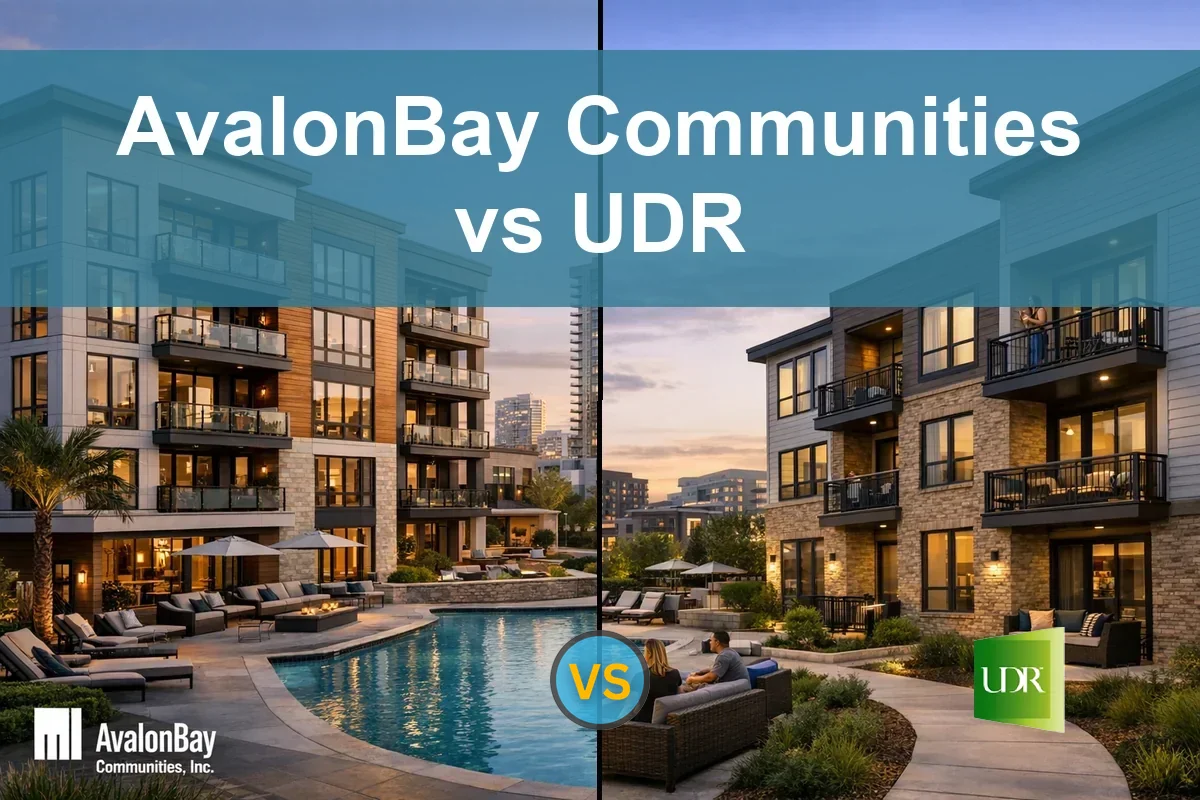
Table of contents
Companies Overview
AvalonBay Communities, Inc. and UDR, Inc. are pivotal players in the U.S. residential REIT sector, shaping multifamily housing dynamics.
AvalonBay Communities, Inc.: Premier Metropolitan Apartment REIT
AvalonBay stands as a leading equity REIT focused on residential properties, owning 291 communities with 86K homes. It generates revenue by developing, acquiring, and managing apartments in major metropolitan areas, including New England and California. In 2020, it prioritized expanding into Southeast Florida and Denver, reflecting a strategy of geographic diversification in high-demand markets.
UDR, Inc.: Multifamily REIT with a Value-Driven Legacy
UDR is a prominent S&P 500 multifamily REIT managing over 51K apartment homes, with income derived from managing, developing, and redeveloping properties. Its 2020 strategy emphasized delivering superior, dependable returns through targeted acquisitions and developments, reinforcing a reputation for long-term value creation and resident service excellence across select U.S. markets.
Strategic Collision: Similarities & Divergences
Both firms embrace multifamily residential real estate with a focus on development and management, yet AvalonBay pursues broad geographic expansion while UDR prioritizes value-driven portfolio optimization. The main battleground lies in capturing growth within key metro areas. Investors will note AvalonBay’s scale advantage contrasts with UDR’s emphasis on operational efficiency and service quality, defining distinct risk and return profiles.
Income Statement Comparison
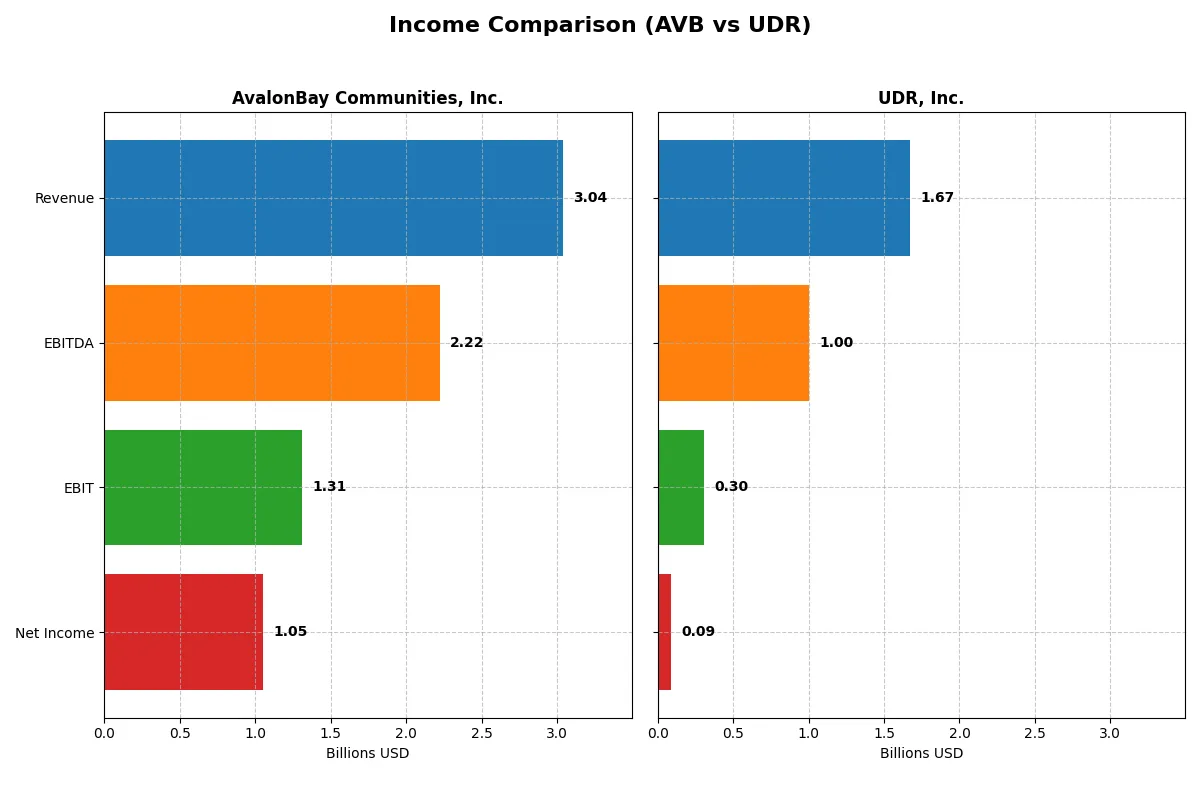
This data dissects the core profitability and scalability of both corporate engines to reveal who dominates the bottom line:
| Metric | AvalonBay Communities, Inc. (AVB) | UDR, Inc. (UDR) |
|---|---|---|
| Revenue | 3.04B | 1.67B |
| Cost of Revenue | 1.00B | 1.25B |
| Operating Expenses | 889M | 132M |
| Gross Profit | 2.04B | 417M |
| EBITDA | 2.22B | 1.00B |
| EBIT | 1.31B | 305M |
| Interest Expense | 259M | 208M |
| Net Income | 1.05B | 90M |
| EPS | 7.40 | 0.26 |
| Fiscal Year | 2025 | 2024 |
Income Statement Analysis: The Bottom-Line Duel
This income statement comparison uncovers which company runs a more efficient and profitable corporate engine in recent years.
AvalonBay Communities, Inc. Analysis
AvalonBay’s revenue climbed steadily from 2.29B in 2021 to 3.04B in 2025, driving net income growth to 1.05B. Its gross margin remains robust near 67%, reflecting strong cost control. Despite a slight dip in net margin and EPS in 2025, the company sustains a favorable 34.6% net margin, signaling efficient operations and resilient profitability momentum.
UDR, Inc. Analysis
UDR’s revenue increased from 1.29B in 2021 to 1.67B in 2024, with net income rising to 85M. However, gross margin stays modest at 25%, and net margin lags at just over 5%. The latest year shows a sharp decline in EBIT and net margin, highlighting pressure on profitability. While revenue and net income grew over five years, recent margin contraction signals operational challenges.
Margin Strength vs. Revenue Scale
AvalonBay clearly outperforms UDR in margin efficiency and absolute profitability, boasting a threefold higher net margin and significantly larger net income. UDR’s growth in revenue masks weaker profitability and margin volatility. For investors, AvalonBay’s profile offers a stronger, more stable earnings engine, while UDR presents higher risk due to margin pressures despite growth.
Financial Ratios Comparison
These vital ratios act as a diagnostic tool to expose the underlying fiscal health, valuation premiums, and capital efficiency of the companies analyzed:
| Ratios | AvalonBay Communities, Inc. (AVB) | UDR, Inc. (UDR) |
|---|---|---|
| ROE | 9.1% | 2.6% |
| ROIC | 4.5% | 2.7% |
| P/E | 28.9x | 159.6x |
| P/B | 2.6x | 4.2x |
| Current Ratio | 0.36 | 0.39 |
| Quick Ratio | 0.36 | 0.39 |
| D/E (Debt-to-Equity) | 0.69 | 1.75 |
| Debt-to-Assets | 39.3% | 55.1% |
| Interest Coverage | 4.0x | 1.4x |
| Asset Turnover | 0.14 | 0.15 |
| Fixed Asset Turnover | 18.8 | 8.9 |
| Payout Ratio | 89% | 629% |
| Dividend Yield | 3.1% | 3.9% |
| Fiscal Year | 2024 | 2024 |
Efficiency & Valuation Duel: The Vital Signs
Financial ratios serve as the company’s DNA, unveiling hidden risks and operational efficiency that raw figures alone cannot capture.
AvalonBay Communities, Inc.
AvalonBay shows solid profitability with a 37.13% net margin but a modest 9.06% ROE below its WACC of 6.39%. The stock trades at a stretched P/E of 28.87, reflecting valuation concerns. Shareholders benefit from a favorable 3.08% dividend yield, signaling steady returns amid reinvestment discipline.
UDR, Inc.
UDR struggles with weak profitability, posting a 5.36% net margin and a low 2.6% ROE, both below its 5.97% WACC. The valuation is highly stretched, with a P/E at 159.56 and a rich P/B of 4.15. Despite this, UDR offers a slightly higher 3.94% dividend yield but carries elevated financial risk.
Premium Valuation vs. Operational Safety
AvalonBay balances risk and reward better, combining operational efficiency with reasonable leverage and a sustainable dividend. UDR’s steep valuation and weak returns heighten risk. Investors seeking stability may favor AvalonBay’s profile, while UDR’s appeal suits those chasing growth despite risk.
Which one offers the Superior Shareholder Reward?
I observe AvalonBay Communities, Inc. (AVB) delivers a more sustainable and attractive shareholder reward than UDR, Inc. AVB’s dividend yield hovers around 3.1%-3.9% with payout ratios near 80%-100%, well-covered by free cash flow (FCF). Its robust buyback activity complements dividends, enhancing total shareholder return. UDR offers similar yields near 3.7%-4.3%, but payout ratios exceed 600%, signaling risky distribution sustainability. UDR’s buybacks are modest and less consistent. AVB’s disciplined capital allocation, lower leverage (debt/equity ~0.69 vs. 1.5+ for UDR), and stronger cash flow coverage underpin a superior long-term total return profile in 2026.
Comparative Score Analysis: The Strategic Profile
The radar chart reveals the fundamental DNA and trade-offs of AvalonBay Communities, Inc. and UDR, Inc., highlighting their distinct financial strengths and weaknesses:
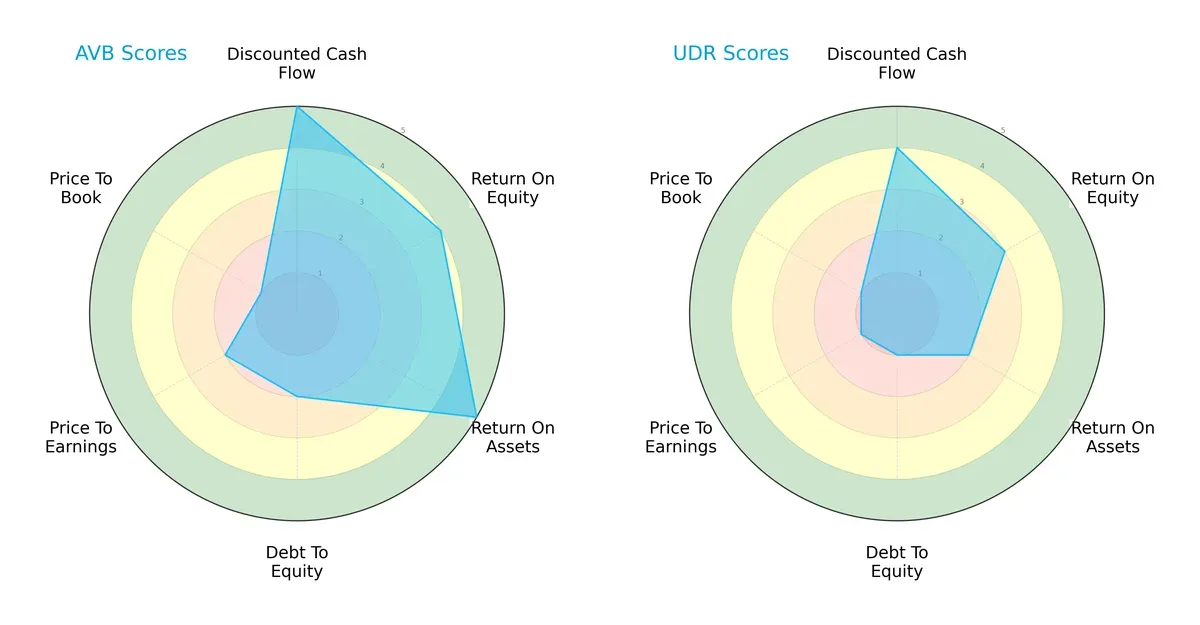
AvalonBay shows a well-rounded profile with strong DCF (5) and ROA (5) scores, signaling efficient asset use and undervaluation. UDR leans on a moderate DCF (4) but struggles with weaker ROA (2) and high financial risk, evidenced by a debt-to-equity score of 1. AvalonBay balances growth and risk better, while UDR depends heavily on specific valuation edges.
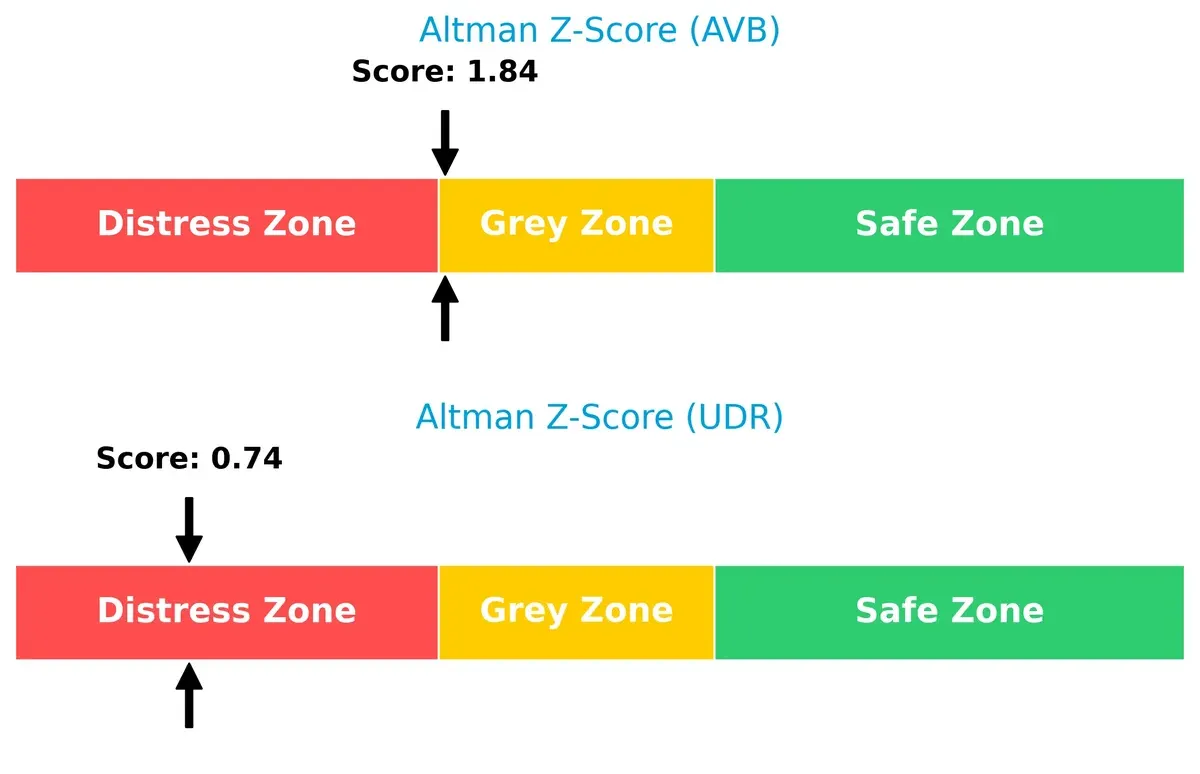
Bankruptcy Risk: Solvency Showdown
The Altman Z-Score gap signals a crucial solvency difference: AvalonBay is in the grey zone at 1.84, suggesting moderate bankruptcy risk, while UDR’s 0.74 places it in distress, highlighting a precarious financial footing:
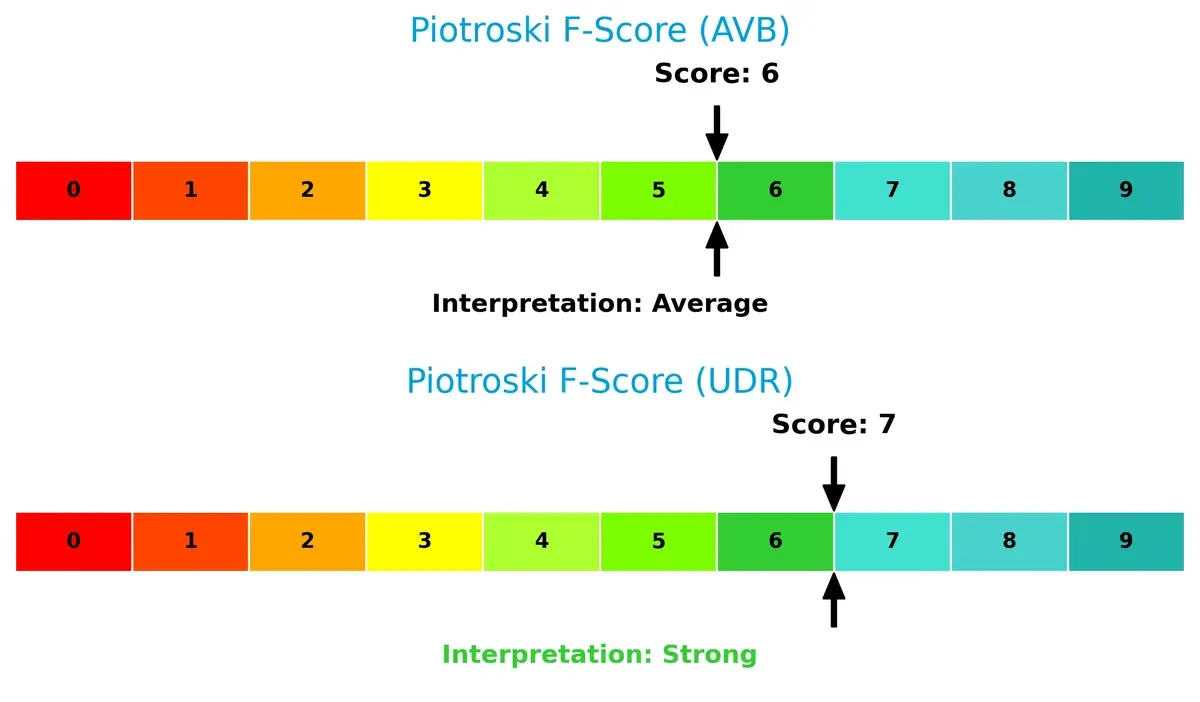
Financial Health: Quality of Operations
AvalonBay’s Piotroski F-Score of 6 indicates average financial health, while UDR’s stronger 7 signals more robust operational quality. UDR’s internal metrics suggest fewer red flags despite its solvency concerns:
How are the two companies positioned?
This section dissects AVB and UDR’s operational DNA by comparing revenue distribution and internal dynamics, including strengths and weaknesses. The goal is to confront their economic moats to reveal which model offers the most resilient competitive advantage today.
Revenue Segmentation: The Strategic Mix
This visual comparison dissects how AvalonBay Communities, Inc. and UDR, Inc. diversify their income streams and where their primary sector bets lie:
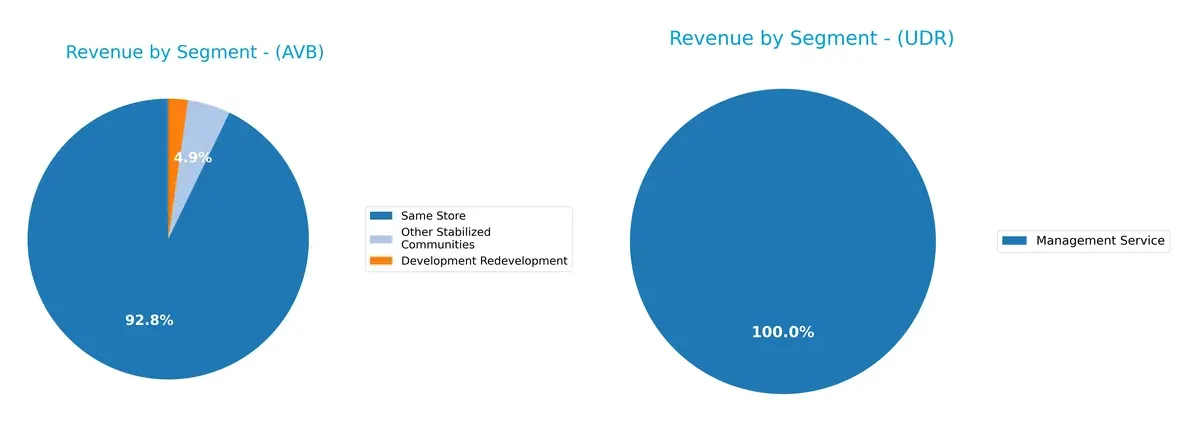
AvalonBay’s revenue anchors heavily in “Same Store” at $2.54B, with smaller contributions from “Development Redevelopment” ($62M) and “Other Stabilized Communities” ($135M). UDR’s data shows a narrow focus, primarily on “Management Service” at $6.8M recently, with little diversification visible. AvalonBay’s concentrated but stable rental income signals strong ecosystem lock-in. UDR’s limited segment exposure indicates higher concentration risk and less infrastructure dominance.
Strengths and Weaknesses Comparison
This table compares the Strengths and Weaknesses of AvalonBay Communities, Inc. (AVB) and UDR, Inc. (UDR):
AVB Strengths
- Strong net margin at 37.13%
- Favorable interest coverage of 5.05
- High fixed asset turnover at 18.84
- Dividend yield solid at 3.08%
- Diverse revenue streams across established and redevelopment communities
UDR Strengths
- Favorable fixed asset turnover at 8.94
- Dividend yield higher at 3.94%
- Geographic revenue diversification across multiple U.S. regions
- Stable management service revenue segment
AVB Weaknesses
- Low current and quick ratios at 0.36 indicating liquidity risk
- ROE and ROIC below WACC, signaling weak capital returns
- Elevated PE ratio at 28.87
- Asset turnover low at 0.14
- Slightly unfavorable overall financial ratio profile
UDR Weaknesses
- Low net margin at 5.36% and weak profitability metrics
- High debt-to-equity at 1.75 and debt-to-assets at 55.14%
- Poor interest coverage at 1.47, increasing financial risk
- Very high PE at 159.56 and unfavorable PB at 4.15
- Mostly unfavorable financial ratios, indicating stress
Both companies show strengths in dividend yield and fixed asset efficiency but differ in profitability and leverage. AVB maintains better profitability and liquidity metrics, while UDR exhibits higher leverage and profitability challenges. These contrasts affect their financial resilience and growth capacity.
The Moat Duel: Analyzing Competitive Defensibility
A structural moat uniquely shields long-term profits from relentless competition erosion. Let’s dissect how AvalonBay Communities and UDR defend their turf:
AvalonBay Communities, Inc.: Location and Scale Moat
AvalonBay’s primary advantage lies in its strategic metro-area apartment portfolio. This manifests in stable 34.6% net margins and a 66.99% gross margin. Its expanding developments in high-demand markets could strengthen this moat in 2026.
UDR, Inc.: Operational Efficiency Moat
UDR relies on superior operational management and targeted regional presence. Despite a lower 5.36% net margin, it delivers consistent revenue growth and improves profitability, contrasting AvalonBay’s higher margin but slower EBIT growth. Expansion into niche submarkets offers upside potential.
Verdict: Metro Footprint vs. Operational Precision
AvalonBay’s wide geographic footprint grants a deeper moat through location scarcity. UDR’s operational edge improves returns but lacks AvalonBay’s scale. AvalonBay stands better poised to defend market share amid rising competition.
Which stock offers better returns?
The past 12 months reveal contrasting dynamics: AvalonBay Communities, Inc. shows a clear downward trend with price deceleration, while UDR, Inc. exhibits minimal overall decline but recent bullish momentum and stronger buyer dominance.
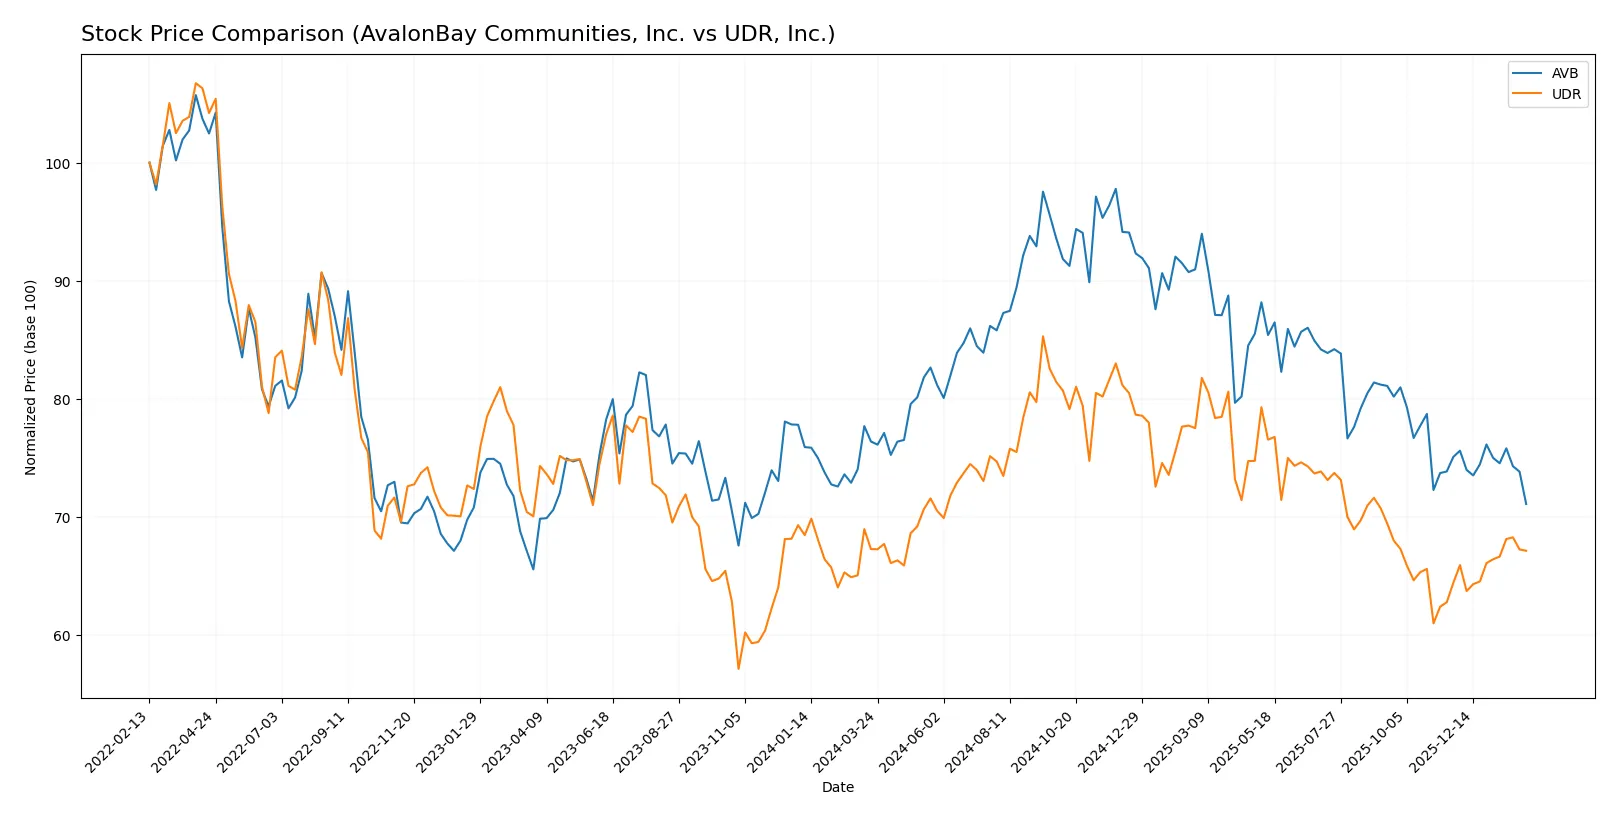
Trend Comparison
AvalonBay Communities, Inc. fell 6.94% over the last year, marking a bearish trend with decelerating price movement and high volatility, peaking at 235.35 and bottoming at 171.07.
UDR, Inc. declined marginally by 0.22%, also bearish overall but accelerating. Its recent 3-month trend turned bullish with a 4.21% gain and low volatility, reaching highs near 47.13.
UDR outperformed AvalonBay over the full year, delivering the highest market performance supported by growing buyer dominance and recent positive price momentum.
Target Prices
Analysts present a moderate upside for AvalonBay Communities, Inc. and UDR, Inc., reflecting confidence in their residential REIT business models.
| Company | Target Low | Target High | Consensus |
|---|---|---|---|
| AvalonBay Communities, Inc. | 172 | 217 | 193.9 |
| UDR, Inc. | 37 | 44.5 | 41.09 |
AvalonBay’s consensus target of 193.9 suggests a roughly 13.5% increase from its current 171 price. UDR’s 41.09 target implies about an 11% upside versus today’s 37.1 share price. Both show solid analyst optimism.

Don’t Let Luck Decide Your Entry Point
Optimize your entry points with our advanced ProRealTime indicators. You’ll get efficient buy signals with precise price targets for maximum performance. Start outperforming now!
How do institutions grade them?
This section compares recent institutional grades assigned to AvalonBay Communities, Inc. and UDR, Inc.:
AvalonBay Communities, Inc. Grades
The following table summarizes AvalonBay Communities’ latest institutional grades and actions:
| Grading Company | Action | New Grade | Date |
|---|---|---|---|
| Truist Securities | Maintain | Buy | 2026-01-20 |
| Barclays | Maintain | Overweight | 2026-01-13 |
| UBS | Maintain | Neutral | 2026-01-08 |
| Colliers Securities | Downgrade | Neutral | 2025-12-04 |
| Truist Securities | Maintain | Buy | 2025-12-02 |
| Barclays | Upgrade | Overweight | 2025-11-25 |
| Mizuho | Maintain | Neutral | 2025-11-24 |
| Morgan Stanley | Maintain | Overweight | 2025-11-13 |
| UBS | Maintain | Neutral | 2025-11-10 |
| Wells Fargo | Maintain | Overweight | 2025-11-10 |
UDR, Inc. Grades
Below is a summary of UDR’s recent institutional grades and rating changes:
| Grading Company | Action | New Grade | Date |
|---|---|---|---|
| Goldman Sachs | Maintain | Sell | 2026-01-20 |
| Truist Securities | Upgrade | Buy | 2026-01-20 |
| UBS | Maintain | Buy | 2026-01-08 |
| JP Morgan | Downgrade | Underweight | 2025-12-18 |
| Truist Securities | Maintain | Hold | 2025-12-01 |
| Barclays | Maintain | Overweight | 2025-11-25 |
| Mizuho | Maintain | Neutral | 2025-11-24 |
| Morgan Stanley | Maintain | Equal Weight | 2025-11-13 |
| UBS | Maintain | Buy | 2025-11-10 |
| Wells Fargo | Maintain | Overweight | 2025-11-10 |
Which company has the best grades?
AvalonBay Communities, Inc. consistently receives Buy and Overweight ratings from top firms, signaling strong institutional confidence. UDR, Inc. shows mixed grades, with some Sell and Underweight ratings despite recent upgrades. Investors may perceive AvalonBay as the stronger choice based on current institutional sentiment.
Risks specific to each company
The following categories identify the critical pressure points and systemic threats facing AvalonBay Communities, Inc. and UDR, Inc. in the 2026 market environment:
1. Market & Competition
AvalonBay Communities, Inc.
- Larger portfolio with 86K homes offers scale advantages in competitive metros.
UDR, Inc.
- Smaller portfolio with 51K homes limits market reach but focuses on targeted U.S. markets.
2. Capital Structure & Debt
AvalonBay Communities, Inc.
- Moderate leverage with debt-to-equity at 0.69, showing balanced financial risk.
UDR, Inc.
- High leverage with debt-to-equity of 1.75, increasing financial vulnerability.
3. Stock Volatility
AvalonBay Communities, Inc.
- Lower beta at 0.75 signals less sensitivity to market swings.
UDR, Inc.
- Slightly lower beta at 0.71, but higher P/E ratio indicates greater valuation risk.
4. Regulatory & Legal
AvalonBay Communities, Inc.
- Operates in multiple states with complex residential regulations, increasing compliance costs.
UDR, Inc.
- Also exposed to diverse regulatory environments, with potential heightened risk from debt covenants.
5. Supply Chain & Operations
AvalonBay Communities, Inc.
- Larger development pipeline (18 communities) may strain operational resources.
UDR, Inc.
- Smaller development scale (1,031 homes under development) eases operational complexity.
6. ESG & Climate Transition
AvalonBay Communities, Inc.
- Exposure in coastal and expansion markets may increase climate-related risks.
UDR, Inc.
- Focus on sustainable community management supports long-term ESG compliance.
7. Geopolitical Exposure
AvalonBay Communities, Inc.
- Concentration in U.S. metros with moderate geopolitical risk.
UDR, Inc.
- Similar U.S.-centric exposure but less diversified metro footprint.
Which company shows a better risk-adjusted profile?
AvalonBay faces moderate leverage and operational scale risks but benefits from a larger, diversified portfolio and stronger financial ratios. UDR carries higher debt and valuation risks, reflected in its distress-zone Altman Z-score. AvalonBay’s risk-adjusted profile appears superior, supported by its balanced capital structure and lower market volatility.
Final Verdict: Which stock to choose?
AvalonBay Communities, Inc. (AVB) demonstrates a superpower in its strong operational efficiency and consistent cash generation despite some margin compression. Its growing profitability amid value destruction signals a turnaround potential. AVB suits investors with an appetite for aggressive growth and a focus on improving fundamentals.
UDR, Inc. offers a strategic moat rooted in its recurring revenue stability and robust income quality. While it carries higher leverage and a weaker balance sheet, UDR presents a relatively safer profile than AVB’s more volatile metrics. It fits well within a GARP (Growth at a Reasonable Price) portfolio seeking steady income with moderate risk.
If you prioritize operational efficiency and turnaround potential, AVB is the compelling choice due to its improving returns and cash flow strength. However, if you seek stability and predictable income, UDR offers better risk management and a more consistent revenue base despite its higher debt load. Both require vigilance on leverage and valuation risks.
Disclaimer: Investment carries a risk of loss of initial capital. The past performance is not a reliable indicator of future results. Be sure to understand risks before making an investment decision.
Go Further
I encourage you to read the complete analyses of AvalonBay Communities, Inc. and UDR, Inc. to enhance your investment decisions: