Home > Comparison > Real Estate > AVB vs MAA
The strategic rivalry between AvalonBay Communities, Inc. and Mid-America Apartment Communities, Inc. shapes the real estate investment trust (REIT) residential sector. AvalonBay operates as a capital-intensive developer and manager in leading metropolitan areas, while Mid-America focuses on full-cycle ownership and redevelopment across broader regions in the U.S. This analysis explores which model offers superior risk-adjusted returns, critical for portfolio diversification and sector leadership evaluation.

Table of contents
Companies Overview
AvalonBay Communities and Mid-America Apartment Communities dominate the US residential REIT market with sizable portfolios and strategic regional focuses.
AvalonBay Communities, Inc.: Premier Metropolitan Apartment REIT
AvalonBay leads as a top-tier residential REIT focusing on upscale apartment communities in key metropolitan hubs like New England and California. Its core revenue derives from rental income and property development. In 2020, AvalonBay emphasized growth through acquiring, developing, and redeveloping apartments in high-demand urban markets, reinforcing its premium positioning.
Mid-America Apartment Communities, Inc.: Regional REIT with Broad Footprint
Mid-America Apartment Communities stands out as an S&P 500 REIT with a broad portfolio concentrated in the Southeast, Southwest, and Mid-Atlantic regions. It generates revenue via ownership, management, and development of apartment communities. In 2020, MAA’s strategy prioritized full-cycle investment performance by expanding its footprint across 16 states, focusing on market diversification and operational excellence.
Strategic Collision: Similarities & Divergences
Both REITs excel in managing large-scale residential portfolios, yet AvalonBay targets high-barrier urban markets, while Mid-America favors regional diversification across growing Sun Belt states. Their competitive battleground lies in capturing rental demand amid evolving migration patterns. AvalonBay’s concentrated metro approach contrasts with MAA’s wide geographic spread, reflecting distinct risk profiles and investment theses for portfolio construction.
Income Statement Comparison
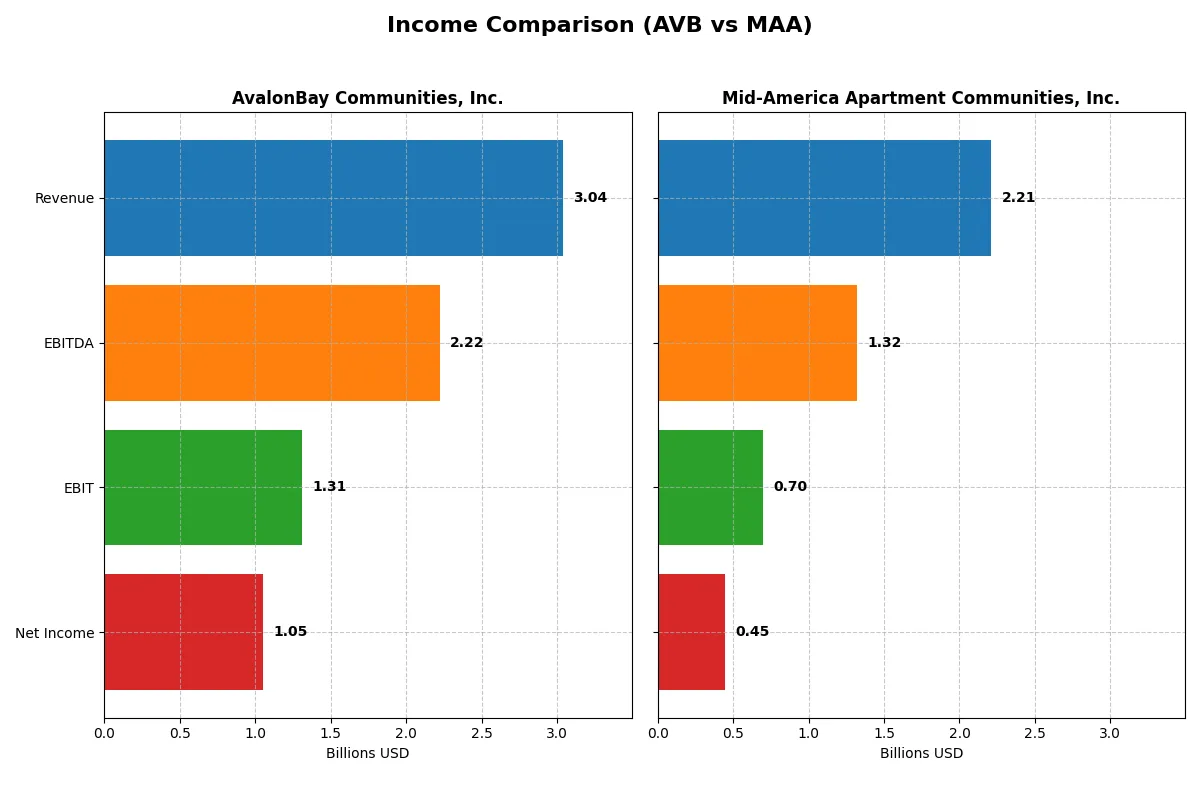
This data dissects the core profitability and scalability of both corporate engines to reveal who dominates the bottom line:
| Metric | AvalonBay Communities, Inc. (AVB) | Mid-America Apartment Communities, Inc. (MAA) |
|---|---|---|
| Revenue | 3.04B | 2.21B |
| Cost of Revenue | 1.00B | 1.51B |
| Operating Expenses | 1.12B | 84M |
| Gross Profit | 2.04B | 703M |
| EBITDA | 2.22B | 1.32B |
| EBIT | 1.31B | 696M |
| Interest Expense | 259M | 185M |
| Net Income | 1.05B | 447M |
| EPS | 7.4 | 3.79 |
| Fiscal Year | 2025 | 2025 |
Income Statement Analysis: The Bottom-Line Duel
This income statement comparison reveals which company operates with superior efficiency and profitability in 2025.
AvalonBay Communities, Inc. Analysis
AvalonBay’s revenue grew steadily to 3.04B in 2025, with net income reaching 1.05B. The company maintains strong gross (67%) and net (35%) margins, reflecting robust operational control. Despite a slight dip in EBIT and net margin growth last year, AvalonBay’s overall income statement remains favorable, showing resilience and effective capital allocation.
Mid-America Apartment Communities, Inc. Analysis
Mid-America’s revenue edged up slightly to 2.21B in 2025, while net income declined to 445M. Gross margin stands at 32%, and net margin at 20%, indicating thinner profitability compared to AvalonBay. The company faced headwinds in revenue and margin growth, with several one-year metrics turning unfavorable, signaling operational challenges and pressure on profitability.
Margin Strength vs. Growth Stability
AvalonBay clearly outperforms Mid-America with superior margins and a healthier net income base. While AvalonBay shows solid revenue growth and margin control, Mid-America struggles with declining profitability and margin compression. For investors prioritizing profitability and efficiency, AvalonBay presents a more attractive profile given its stronger bottom-line performance and margin resilience.
Financial Ratios Comparison
These vital ratios act as a diagnostic tool to expose the underlying fiscal health, valuation premiums, and capital efficiency of AvalonBay Communities, Inc. and Mid-America Apartment Communities, Inc.:
| Ratios | AvalonBay Communities, Inc. (AVB) | Mid-America Apartment Communities, Inc. (MAA) |
|---|---|---|
| ROE | 9.1% | 7.9% |
| ROIC | 4.5% | 10.2% |
| P/E | 28.9 | 36.4 |
| P/B | 2.62 | 2.87 |
| Current Ratio | 0.36 | 0.08 |
| Quick Ratio | 0.36 | 0.08 |
| D/E (Debt to Equity) | 0.69 | 0.95 |
| Debt-to-Assets | 39.3% | 45.1% |
| Interest Coverage | 4.0x | 3.3x |
| Asset Turnover | 0.14 | 0.18 |
| Fixed Asset Turnover | 18.8 | N/A |
| Payout Ratio | 89% | 159% |
| Dividend Yield | 3.1% | 4.4% |
| Fiscal Year | 2024 | 2025 |
Efficiency & Valuation Duel: The Vital Signs
Ratios serve as a company’s DNA, exposing hidden risks and operational strengths that raw financials alone cannot reveal.
AvalonBay Communities, Inc.
AvalonBay shows strong profitability with a 37.13% net margin but a modest 9.06% ROE, indicating moderate shareholder returns. Its P/E of 28.87 suggests the stock trades at a premium. The 3.08% dividend yield supports income-focused investors, balancing reinvestment with shareholder payouts. Current ratio at 0.36 flags liquidity concerns.
Mid-America Apartment Communities, Inc.
Mid-America posts a lower 20.23% net margin and 7.89% ROE, reflecting thinner profitability. The P/E of 36.36 marks the stock as expensive relative to earnings. A 4.36% dividend yield provides steady income, while a 0 current ratio signals potential short-term liquidity risks. ROIC’s outlier figure requires scrutiny.
Premium Valuation vs. Operational Safety
Both companies face slightly unfavorable ratio profiles with stretched valuations. AvalonBay offers a better dividend yield and liquidity caution. Mid-America’s high P/E and zero current ratio increase risk. Investors preferring income with moderate risk may lean toward AvalonBay, while those seeking growth despite liquidity challenges might consider Mid-America.
Which one offers the Superior Shareholder Reward?
AvalonBay Communities (AVB) yields 3.08% with a high payout ratio near 89%, supported by strong free cash flow coverage at 88%. Its buyback program is consistent, bolstering total returns sustainably. Mid-America Apartment Communities (MAA) offers a higher yield of 4.36%, but with a payout ratio exceeding 158%, risking dividend sustainability. MAA’s buybacks appear less aggressive, and its leverage is higher. I find AVB’s balanced dividend and buyback strategy more sustainable and appealing for total shareholder return in 2026.
Comparative Score Analysis: The Strategic Profile
The radar chart reveals the fundamental DNA and trade-offs of AvalonBay Communities, Inc. and Mid-America Apartment Communities, Inc., highlighting their core financial strengths and weaknesses:
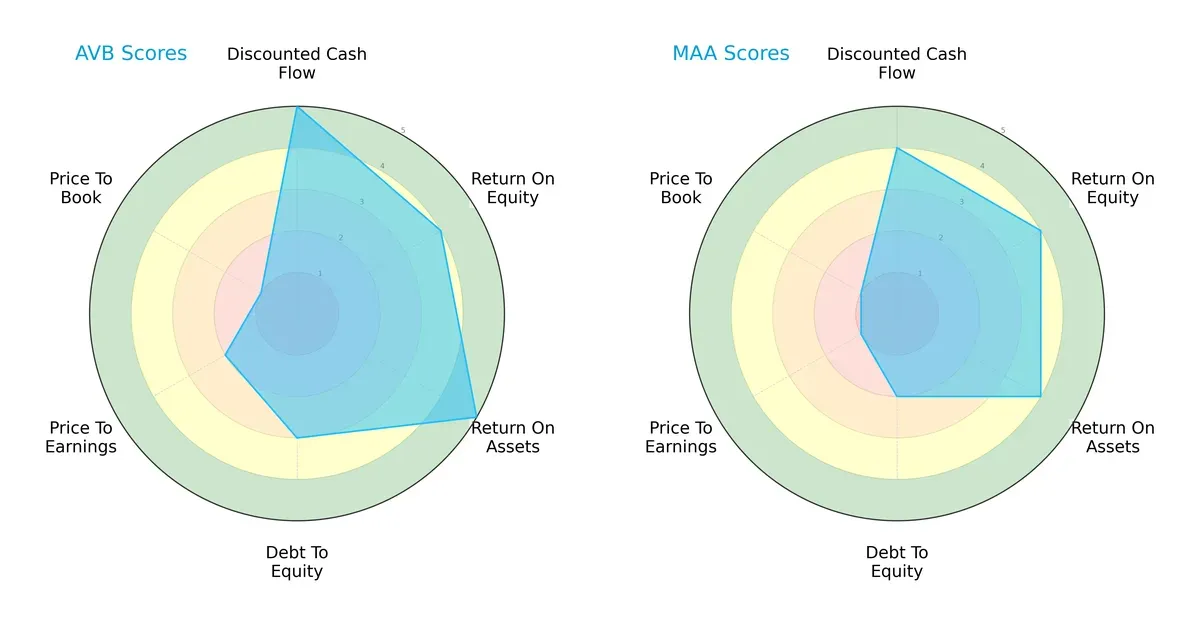
AvalonBay shows superior DCF (5 vs. 4) and ROA (5 vs. 4) scores, signaling better cash flow and asset efficiency. Both tie on ROE (4), but AvalonBay’s moderate debt-to-equity (3) beats Mid-America’s weaker position (2). AvalonBay’s valuation metrics lag with low P/E (2) and P/B (1) scores, indicating possible overvaluation compared to Mid-America’s even weaker valuation scores.
—
Bankruptcy Risk: Solvency Showdown
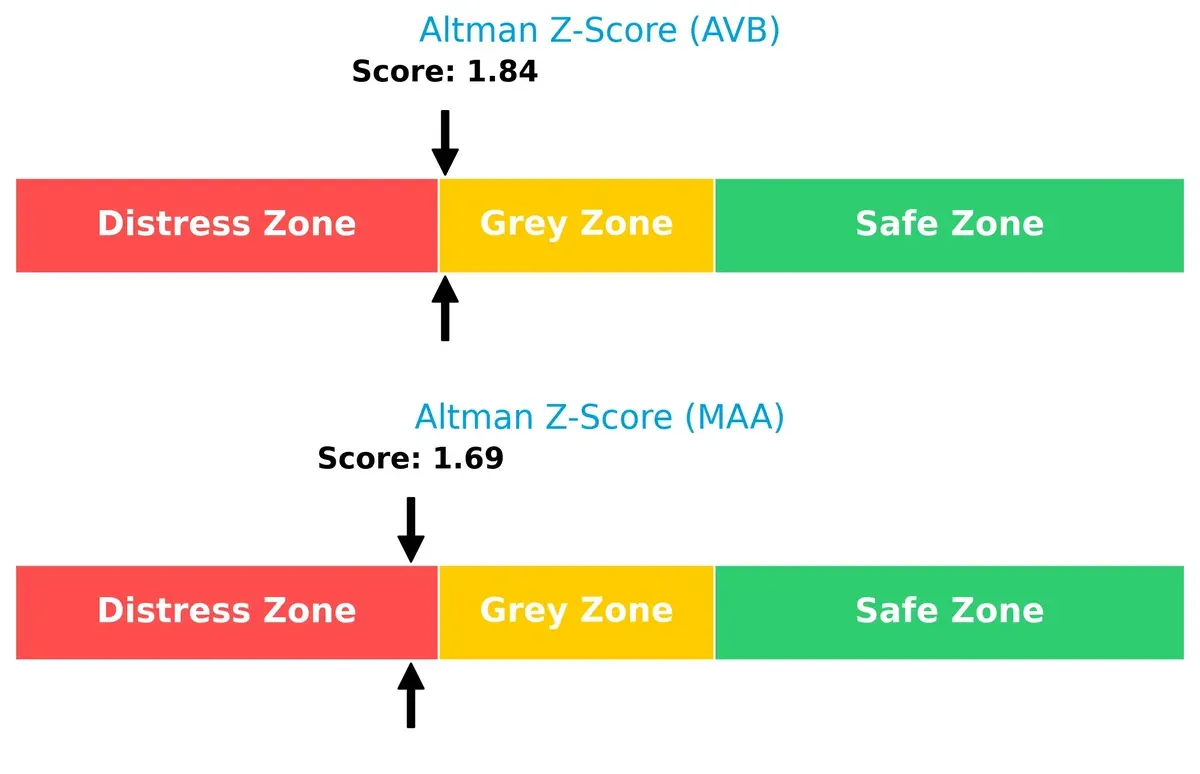
AvalonBay’s Altman Z-Score of 1.84 places it in the grey zone, slightly safer than Mid-America’s 1.69 distress zone score, implying better resilience against bankruptcy risk in this cycle:
—
Financial Health: Quality of Operations
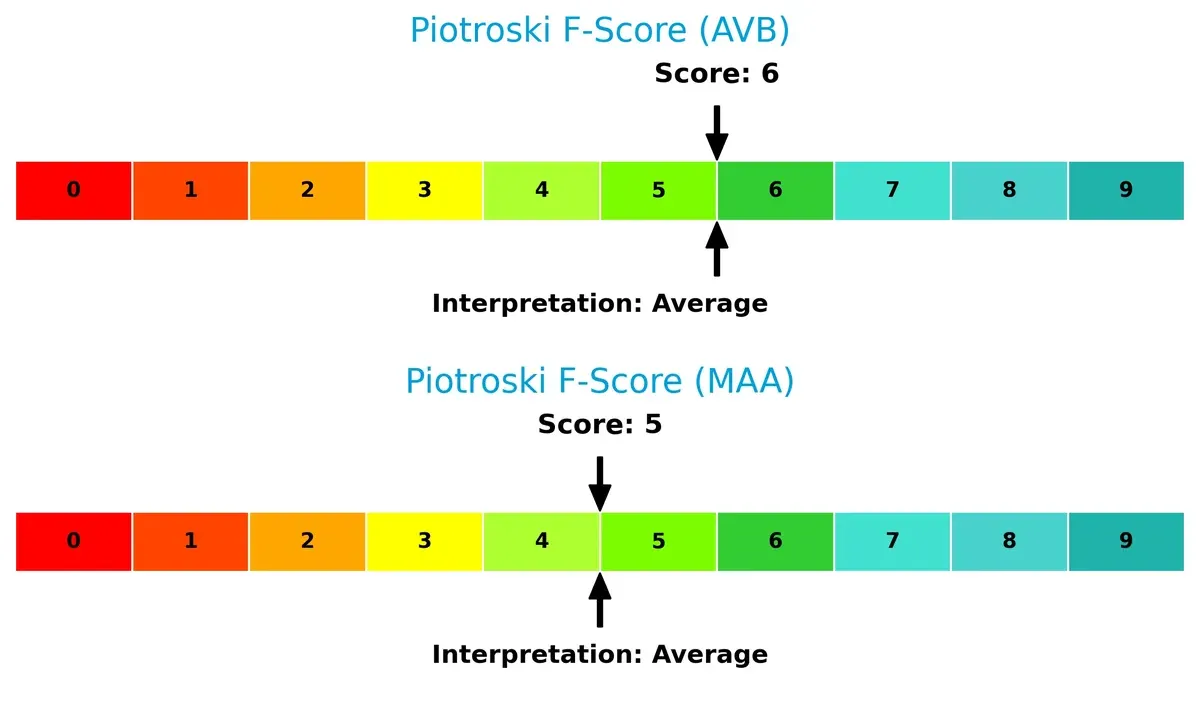
AvalonBay and Mid-America both score in the average range for Piotroski F-Score, at 6 and 5 respectively, showing moderate financial health with no glaring red flags, though AvalonBay holds a slight edge:
How are the two companies positioned?
This section dissects the operational DNA of AVB and MAA by comparing revenue distribution across segments and analyzing their internal strengths and weaknesses. The final goal is to confront their economic moats to reveal which model offers the most resilient and sustainable competitive advantage today.
Revenue Segmentation: The Strategic Mix
This visual comparison dissects how AvalonBay Communities and Mid-America Apartment Communities diversify their income streams and where their primary sector bets lie:
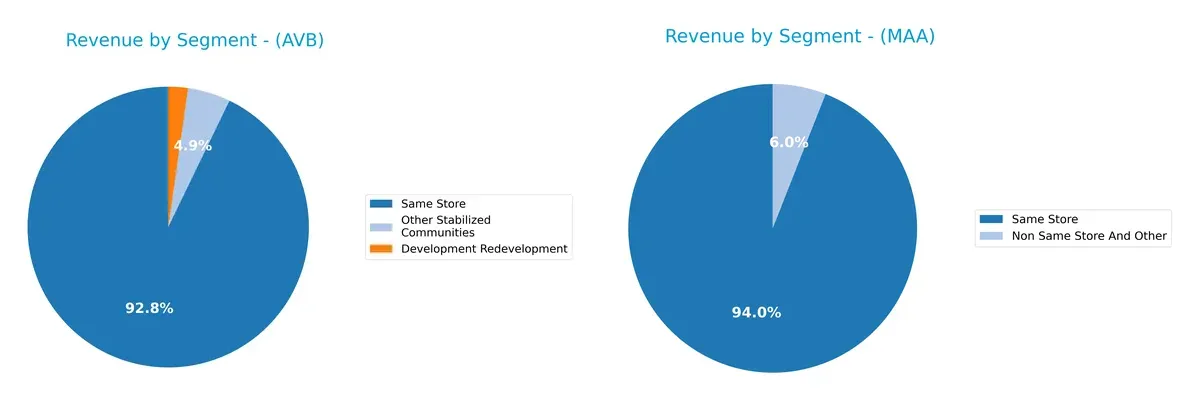
AvalonBay leans heavily on its Same Store segment, generating $2.54B in 2023, dwarfing its Development Redevelopment ($62M) and Other Stabilized Communities ($135M). Mid-America Apartment Communities also anchors revenue in Same Store at $2.02B but shows more balance with Non Same Store And Other at $124M, reflecting moderate diversification. AvalonBay’s concentration risks contrast with MAA’s more distributed approach, hinting at stronger ecosystem lock-in for AvalonBay versus flexible infrastructure exposure for MAA.
Strengths and Weaknesses Comparison
This table compares the strengths and weaknesses of AvalonBay Communities, Inc. (AVB) and Mid-America Apartment Communities, Inc. (MAA):
AVB Strengths
- Higher net margin at 37.13% indicating strong profitability
- Favorable WACC at 6.34% supports cost-efficient capital
- Strong interest coverage ratio at 5.05x reduces credit risk
- Stable dividend yield of 3.08% appeals to income investors
- Consistent revenue growth in Same Store segment
MAA Strengths
- Exceptionally high ROIC at 1017.71% signals efficient capital use
- Favorable net margin at 20.23% supports profitability
- Dividend yield at 4.36% offers attractive income
- WACC at 6.46% remains well-managed
- Growing Non Same Store and Same Store revenue segments
AVB Weaknesses
- Unfavorable ROE at 9.06% lags expected shareholder returns
- Low current and quick ratios at 0.36 indicate liquidity concerns
- Unfavorable PE ratio at 28.87 suggests potential overvaluation
- Weak asset turnover at 0.14 reflects low operational efficiency
- Slightly unfavorable global ratio profile
MAA Weaknesses
- Zero current and quick ratios raise significant liquidity red flags
- Unfavorable PE at 36.36 hints at stretched valuation
- Unfavorable fixed asset turnover at 0 limits asset utilization
- Moderate interest coverage at 3.76x is less robust
- Unfavorable asset turnover at 0.18 shows operational inefficiency
Overall, AVB demonstrates stronger profitability metrics and liquidity concerns, while MAA excels in capital efficiency but faces liquidity and asset utilization challenges. These distinctions shape each company’s strategic focus on balancing growth with financial stability.
The Moat Duel: Analyzing Competitive Defensibility
A structural moat is the only true shield protecting long-term profits from relentless competition erosion. Let’s dissect the sources behind these companies’ defenses:
AvalonBay Communities, Inc.: Geographic Focus and Operational Scale Moat
AvalonBay leverages prime metropolitan locations and scale to sustain premium rents. Its slightly unfavorable ROIC vs. WACC signals value erosion, but rising profitability hints at operational improvements. Expansion into Southeast Florida and Denver could deepen its foothold in 2026.
Mid-America Apartment Communities, Inc.: Capital Efficiency and Market Diversification Moat
MAA’s moat stems from efficient capital deployment and broad geographic exposure across 16 states. Unlike AvalonBay, MAA creates strong value with ROIC vastly exceeding WACC and accelerating returns. Its growth potential lies in intensifying regional dominance and portfolio optimization.
Capital Efficiency vs. Geographic Specialization: Who Holds the Moat Edge?
MAA’s moat is demonstrably wider and deeper, consistently generating economic profit and expanding returns. AvalonBay’s scale and location provide defense, but its value destruction warns of competitive pressure. MAA is better positioned to defend and grow market share in 2026.
Which stock offers better returns?
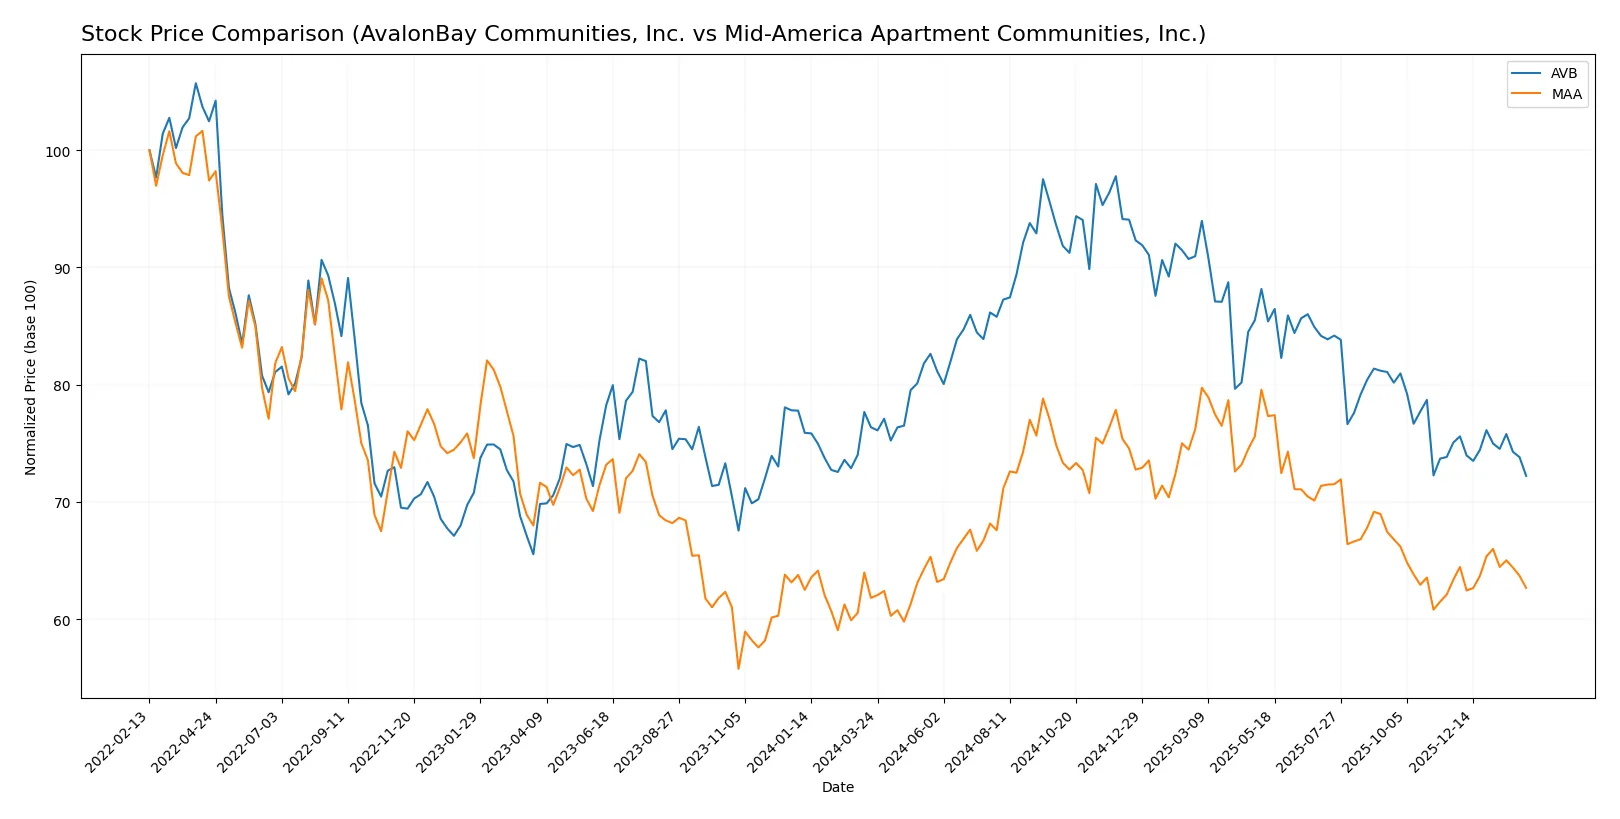
The past year shows contrasting dynamics: AvalonBay Communities, Inc. declined steadily, while Mid-America Apartment Communities, Inc. posted mild gains with accelerating momentum.
Trend Comparison
AvalonBay Communities, Inc. registered a 5.43% price decline over 12 months, marking a bearish trend with deceleration. The stock ranged from 235.35 at its peak to a low of 173.83, showing notable volatility.
Mid-America Apartment Communities, Inc. gained 1.37% over the same period, indicating a bullish trend with acceleration. Its price moved between a low of 126.08 and a high of 168.12, reflecting moderate volatility.
Comparing trends, Mid-America Apartment Communities, Inc. delivered the superior market performance, outperforming AvalonBay Communities, Inc. by nearly 7 percentage points.
Target Prices
Analysts set a moderate upside for AvalonBay Communities and Mid-America Apartment Communities, reflecting steady confidence in residential REITs.
| Company | Target Low | Target High | Consensus |
|---|---|---|---|
| AvalonBay Communities, Inc. | 172 | 217 | 192.9 |
| Mid-America Apartment Communities, Inc. | 134 | 158 | 143.38 |
AvalonBay’s consensus target of 192.9 implies a 11% upside from the current 174 price, signaling solid growth expectations. Mid-America’s 143.38 target suggests a 8.5% gain, indicating cautious optimism amid market volatility.

Don’t Let Luck Decide Your Entry Point
Optimize your entry points with our advanced ProRealTime indicators. You’ll get efficient buy signals with precise price targets for maximum performance. Start outperforming now!
How do institutions grade them?
This section compares recent institutional grades for AvalonBay Communities, Inc. and Mid-America Apartment Communities, Inc.:
AvalonBay Communities, Inc. Grades
Below is a summary of AvalonBay Communities’ latest institutional grades:
| Grading Company | Action | New Grade | Date |
|---|---|---|---|
| RBC Capital | maintain | Sector Perform | 2026-02-06 |
| Truist Securities | maintain | Buy | 2026-01-20 |
| Barclays | maintain | Overweight | 2026-01-13 |
| UBS | maintain | Neutral | 2026-01-08 |
| Colliers Securities | downgrade | Neutral | 2025-12-04 |
Mid-America Apartment Communities, Inc. Grades
Below is a summary of Mid-America Apartment Communities’ latest institutional grades:
| Grading Company | Action | New Grade | Date |
|---|---|---|---|
| RBC Capital | maintain | Sector Perform | 2026-02-06 |
| Mizuho | maintain | Outperform | 2026-01-12 |
| BMO Capital | upgrade | Outperform | 2026-01-09 |
| UBS | maintain | Neutral | 2026-01-08 |
| Evercore ISI Group | maintain | In Line | 2025-12-15 |
Which company has the best grades?
Mid-America Apartment Communities holds relatively stronger grades with multiple “Outperform” ratings. AvalonBay Communities mostly receives “Sector Perform” or neutral grades. This could influence investor perception of growth potential and risk.
Risks specific to each company
The following categories identify critical pressure points and systemic threats facing AvalonBay Communities, Inc. and Mid-America Apartment Communities, Inc. in the 2026 market environment:
1. Market & Competition
AvalonBay Communities, Inc.
- Operates in highly competitive coastal metro areas with premium pricing power but faces saturation risk.
Mid-America Apartment Communities, Inc.
- Focuses on broader Southeast and Mid-Atlantic regions with growth potential but more fragmented competition.
2. Capital Structure & Debt
AvalonBay Communities, Inc.
- Moderate debt-to-equity ratio (0.69) with strong interest coverage (5.05x) signals balanced leverage.
Mid-America Apartment Communities, Inc.
- Higher leverage (0.95 debt-to-equity) and weaker interest coverage (3.76x) elevate financial risk.
3. Stock Volatility
AvalonBay Communities, Inc.
- Beta of 0.75 indicates lower volatility than the market, providing stability.
Mid-America Apartment Communities, Inc.
- Slightly higher beta of 0.78 suggests marginally greater market sensitivity.
4. Regulatory & Legal
AvalonBay Communities, Inc.
- Exposure to rent control laws in Northeast and California creates regulatory uncertainty.
Mid-America Apartment Communities, Inc.
- Operating in states with fewer rent restrictions reduces regulatory pressure but requires local compliance vigilance.
5. Supply Chain & Operations
AvalonBay Communities, Inc.
- Large-scale developments in expensive markets face cost inflation and labor shortages.
Mid-America Apartment Communities, Inc.
- Development in diversified regions mitigates localized supply chain disruptions but faces complexity in management.
6. ESG & Climate Transition
AvalonBay Communities, Inc.
- Coastal presence increases vulnerability to climate risks and mandates costly sustainability investments.
Mid-America Apartment Communities, Inc.
- Inland footprint lowers direct climate exposure but requires adaptation to evolving ESG standards.
7. Geopolitical Exposure
AvalonBay Communities, Inc.
- Primarily domestic U.S. operations limit geopolitical risk but subject to national policy shifts.
Mid-America Apartment Communities, Inc.
- Similarly domestic-focused, risks stem mainly from regional economic policies and interest rate changes.
Which company shows a better risk-adjusted profile?
AvalonBay faces intense regulatory and climate risks but benefits from a stronger capital structure and lower stock volatility. Mid-America shows higher leverage and financial distress signals, despite geographic diversification. The most impactful risk for AvalonBay is regulatory pressure in rent-controlled markets. For Mid-America, elevated debt and low liquidity ratios raise solvency concerns. AvalonBay’s superior interest coverage and lower beta support a better risk-adjusted profile in 2026.
Final Verdict: Which stock to choose?
AvalonBay Communities, Inc. (AVB) shines with its operational efficiency and strong cash flow generation, making it a resilient cash machine in the apartment REIT sector. Its main point of vigilance remains a low current ratio, indicating liquidity constraints that could pressure short-term flexibility. AVB suits investors targeting aggressive growth with a focus on income stability.
Mid-America Apartment Communities, Inc. (MAA) boasts a robust strategic moat through its superior return on invested capital, signaling a sustainable competitive advantage. Compared to AVB, MAA offers a safer profile with a steadily growing ROIC and better overall financial health. It fits well within a GARP (Growth at a Reasonable Price) portfolio seeking balanced risk and growth.
If you prioritize operational efficiency and income generation under growth pressure, AVB is the compelling choice due to its cash flow strength and sector experience. However, if you seek superior capital efficiency and a more stable growth trajectory, MAA offers better stability and a durable moat that outshines its peer. Both present slightly unfavorable valuation metrics, so cautious timing and risk management remain essential.
Disclaimer: Investment carries a risk of loss of initial capital. The past performance is not a reliable indicator of future results. Be sure to understand risks before making an investment decision.
Go Further
I encourage you to read the complete analyses of AvalonBay Communities, Inc. and Mid-America Apartment Communities, Inc. to enhance your investment decisions: