Home > Comparison > Real Estate > AVB vs ESS
The strategic rivalry between AvalonBay Communities, Inc. and Essex Property Trust, Inc. defines the current trajectory of the residential REIT sector. AvalonBay operates as a broad-based residential REIT with a focus on multiple metropolitan areas across the U.S. East and West Coasts. Essex, by contrast, concentrates on high-barrier West Coast markets with a fully integrated operational model. This analysis evaluates which company presents the superior risk-adjusted profile for a diversified real estate portfolio.
Table of contents
Companies Overview
AvalonBay Communities and Essex Property Trust anchor the U.S. residential REIT sector with prominent market footprints.
AvalonBay Communities, Inc.: Leading Metropolitan Apartment REIT
AvalonBay Communities dominates the residential REIT space by owning and managing 291 apartment communities with 86K homes across 11 states and D.C. Its core revenue stems from leasing these residential properties. In 2020, AvalonBay focused strategically on expanding in key metro areas, including New England, the Mid-Atlantic, and the West Coast, plus emerging markets like Southeast Florida.
Essex Property Trust, Inc.: West Coast Multifamily Specialist
Essex Property Trust stands out as an S&P 500 integrated REIT with ownership of 246 apartment communities totaling 60K homes, primarily on the West Coast. Its revenue engine relies on acquiring, developing, and managing multifamily residential units. The company’s 2020 strategy emphasized development and redevelopment of properties to boost its portfolio in selective West Coast markets.
Strategic Collision: Similarities & Divergences
Both REITs pursue growth through property acquisition and development, focusing on urban multifamily housing. AvalonBay adopts a broad metro focus across multiple states, while Essex concentrates on West Coast markets, reflecting differing geographical philosophies. Their competitive battleground centers on tenant demand in high-barrier-to-entry urban areas. Investors face distinct risk profiles: AvalonBay offers diversified exposure; Essex presents concentrated regional expertise.
Income Statement Comparison
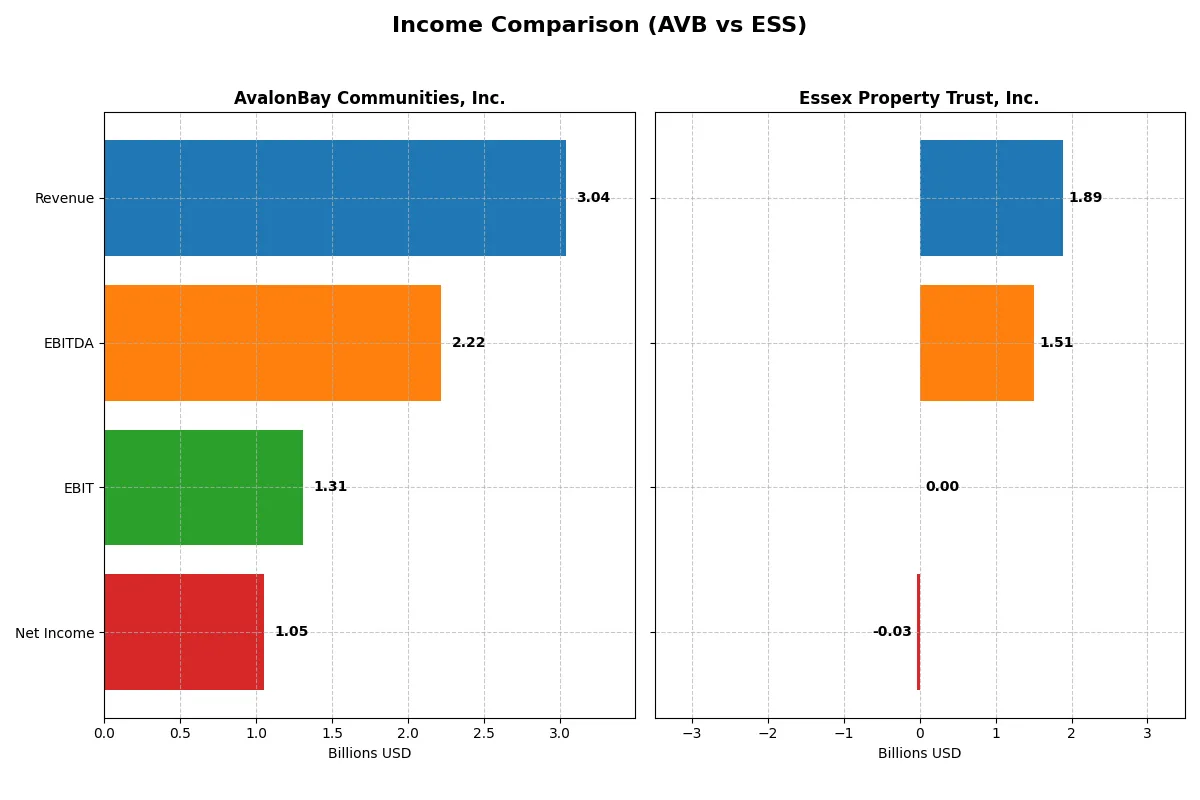
This data dissects the core profitability and scalability of both corporate engines to reveal who dominates the bottom line:
| Metric | AvalonBay Communities, Inc. (AVB) | Essex Property Trust, Inc. (ESS) |
|---|---|---|
| Revenue | 3.04B | 1.89B |
| Cost of Revenue | 1.00B | 559M |
| Operating Expenses | 889M | 72M |
| Gross Profit | 2.04B | 1.33B |
| EBITDA | 2.22B | 1.51B |
| EBIT | 1.31B | 0 |
| Interest Expense | 259M | (254M) |
| Net Income | 1.05B | (33M) |
| EPS | 7.40 | 10.40 |
| Fiscal Year | 2025 | 2025 |
Income Statement Analysis: The Bottom-Line Duel
This income statement comparison reveals the true operational efficiency and profitability of AvalonBay Communities and Essex Property Trust.
AvalonBay Communities, Inc. Analysis
AvalonBay’s revenue rose steadily from 2.29B in 2021 to 3.04B in 2025, reflecting robust growth. Its net income followed a more modest upward path, reaching 1.05B in 2025. Gross margins remain strong at nearly 67%, while net margins hold a favorable 34.6%, underscoring efficient cost control and solid profitability, despite slight net margin compression in the latest year.
Essex Property Trust, Inc. Analysis
Essex’s revenue climbed from 1.44B in 2021 to 1.89B in 2025, showing consistent expansion. However, net income turned negative in 2025, with a -33M loss, signaling operational challenges. Despite a higher gross margin near 70%, its net margin slipped to -1.75%, reflecting heavy expenses or non-operating losses that erased profitability despite favorable revenue growth.
Margin Strength vs. Profitability Sustainability
AvalonBay delivers superior profitability with sturdy net margins and steady income growth, while Essex struggles to convert revenue into profit, posting a net loss in the latest year. AvalonBay’s consistent margin management and positive earnings trend provide a clearer fundamental advantage. Investors seeking stable profitability may find AvalonBay’s profile more attractive.
Financial Ratios Comparison
These vital ratios act as a diagnostic tool to expose the underlying fiscal health, valuation premiums, and capital efficiency of the companies compared below:
| Ratios | AvalonBay Communities, Inc. (AVB) | Essex Property Trust, Inc. (ESS) |
|---|---|---|
| ROE | 9.1% | 13.4% |
| ROIC | 4.5% | 5.6% |
| P/E | 28.9 | 24.7 |
| P/B | 2.62 | 3.31 |
| Current Ratio | 0.36 | 0.66 |
| Quick Ratio | 0.36 | 0.66 |
| D/E | 0.69 | 1.20 |
| Debt-to-Assets | 39.3% | 51.5% |
| Interest Coverage | 4.0 | 3.0 |
| Asset Turnover | 0.14 | 0.14 |
| Fixed Asset Turnover | 18.8 | 34.4 |
| Payout ratio | 88.9% | 83.7% |
| Dividend yield | 3.08% | 3.38% |
| Fiscal Year | 2024 | 2024 |
Efficiency & Valuation Duel: The Vital Signs
Financial ratios act as a company’s DNA, unveiling hidden risks and operational strengths crucial for investment decisions.
AvalonBay Communities, Inc.
AvalonBay posts a solid net margin of 37.13%, but its 9.06% ROE and 4.52% ROIC lag behind industry standards, signaling operational challenges. The stock trades at a stretched P/E of 28.87, indicating premium valuation. Shareholders benefit from a 3.08% dividend yield, reflecting a steady income focus amid moderate reinvestment.
Essex Property Trust, Inc.
Essex shows an unfavorable net margin of -1.75% and zero returns on equity and invested capital, highlighting profitability struggles. Its valuation metrics, including P/E and P/B, are favorable due to zero or unavailable values, but this reflects data gaps rather than strength. The company offers no dividend, suggesting limited shareholder returns and possible reinvestment needs.
Premium Valuation vs. Profitability Concerns
AvalonBay balances a premium valuation with modest profitability and a reliable dividend, offering a more tangible return profile. Essex’s unfavorable profitability and lack of clear valuation metrics increase risk. Investors seeking income and operational steadiness may prefer AvalonBay’s profile over Essex’s uncertain outlook.
Which one offers the Superior Shareholder Reward?
I compare AvalonBay Communities, Inc. (AVB) and Essex Property Trust, Inc. (ESS) by their dividend policies, yields, payout ratios, and buyback intensity. AVB delivers a 3.48% dividend yield in 2024 with a high payout ratio near 99%, supported by strong free cash flow coverage (1.39x). Its buyback activity has been consistent but less aggressive. ESS, by contrast, yielded 3.38% in 2024 with a payout ratio above 83%, though its net margin turned negative in 2025, signaling stress. ESS’s buybacks are less clear due to data gaps, but its capital allocation prioritizes dividends despite rising leverage (debt-to-equity >1.2). I find AVB’s model more sustainable with lower leverage, robust cash flow, and disciplined payouts. For 2026, AVB offers the superior total return profile, balancing yield, safety, and capital return.
Comparative Score Analysis: The Strategic Profile
The radar chart reveals the fundamental DNA and trade-offs of AvalonBay Communities, Inc. and Essex Property Trust, Inc., highlighting their core financial strengths and vulnerabilities:
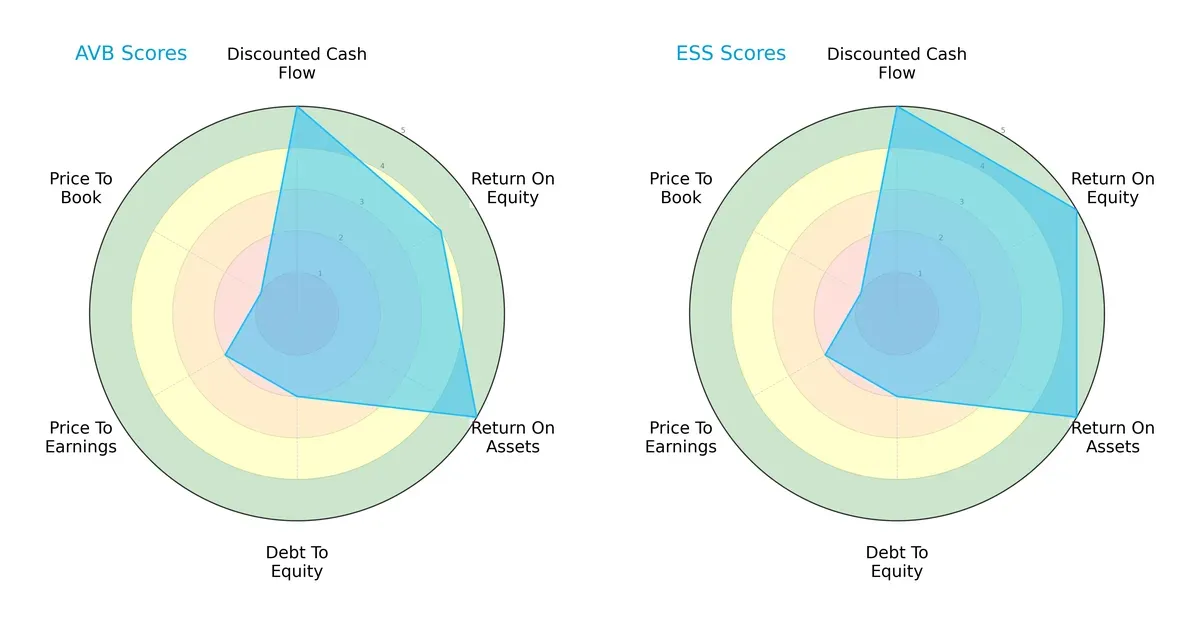
Essex Property Trust boasts a more balanced profile with top scores in ROE (5) and ROA (5), matching AvalonBay’s DCF score (5). AvalonBay leans on asset efficiency and cash flow but shows weakness in debt management and valuation metrics. Essex’s slightly higher overall score (4 vs. 3) signals stronger profitability and capital allocation discipline. Both firms struggle with valuation, reflected by low P/B scores (1), underscoring potential market skepticism.
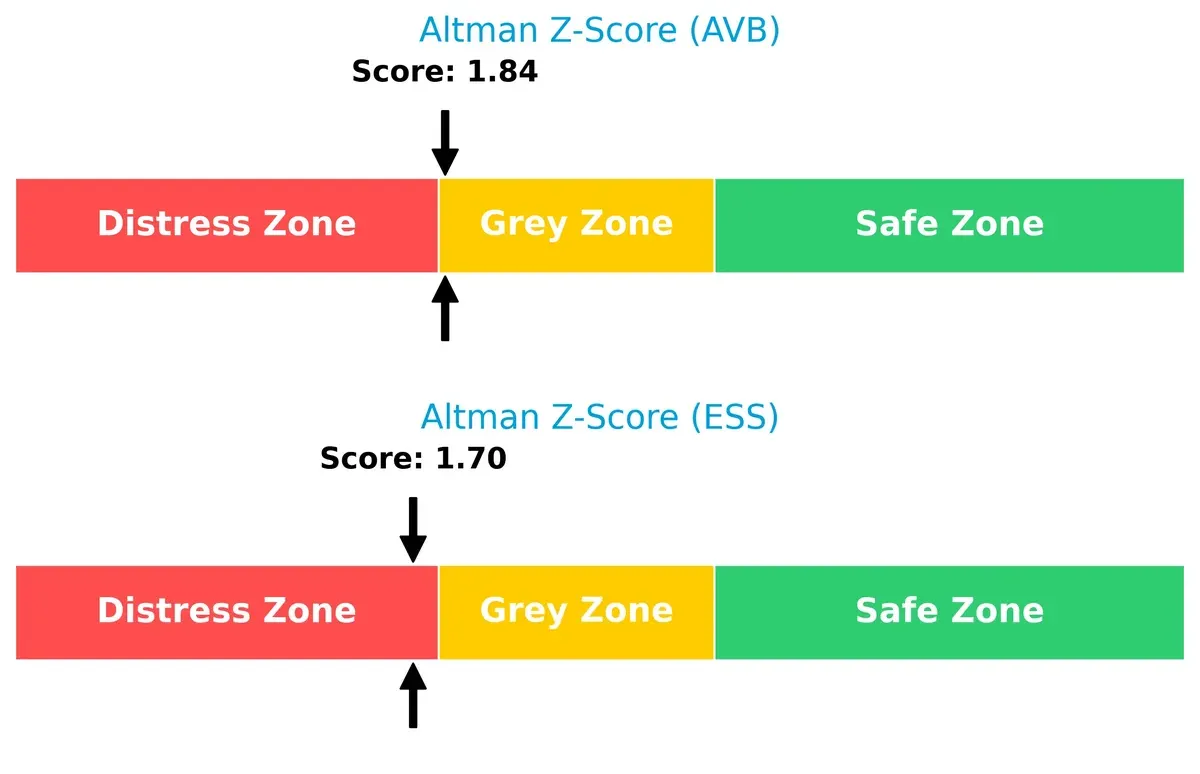
Bankruptcy Risk: Solvency Showdown
The Altman Z-Score difference signals AvalonBay in the grey zone (1.84), while Essex slips into the distress zone (1.70), implying a higher bankruptcy risk for Essex amid economic volatility:
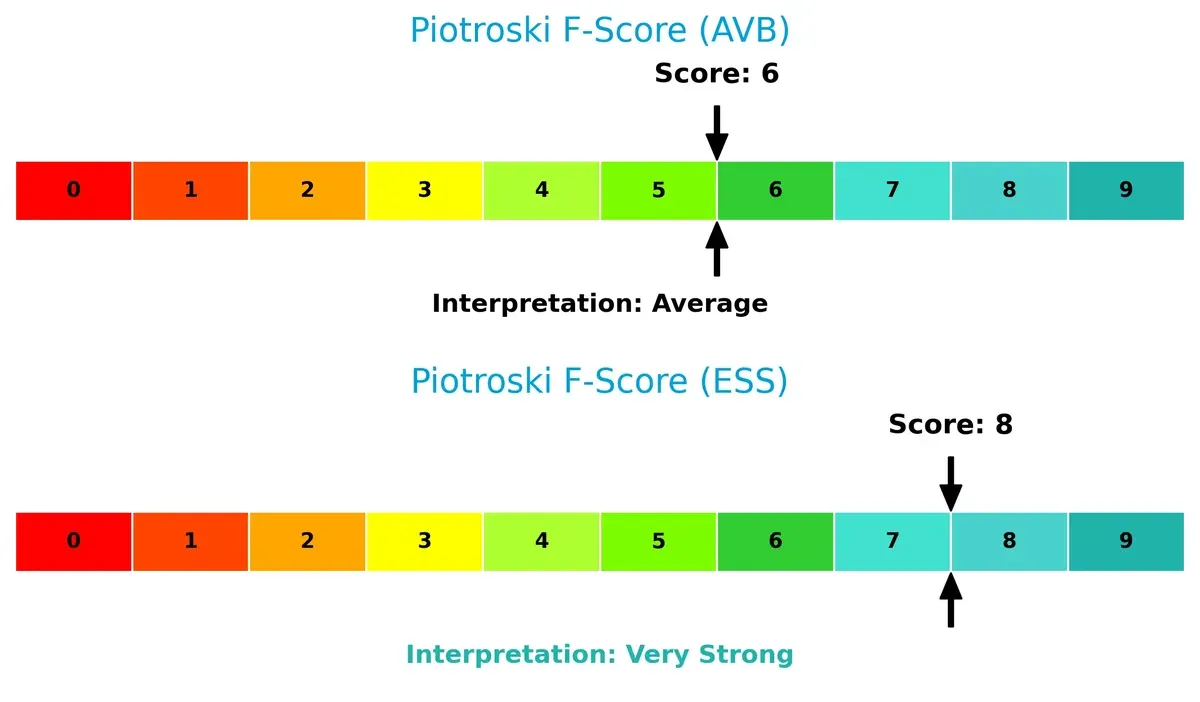
Financial Health: Quality of Operations
AvalonBay’s Piotroski F-Score of 6 indicates average financial health, whereas Essex’s strong 8 reflects robust internal metrics and operational quality, marking it as the more resilient operator:
How are the two companies positioned?
This section dissects AVB and ESS’s operational DNA by comparing revenue distribution and internal strengths and weaknesses. The goal is to confront their economic moats to identify the more resilient competitive advantage.
Revenue Segmentation: The Strategic Mix
This visual comparison dissects how AvalonBay Communities and Essex Property Trust diversify their income streams and where their primary sector bets lie:
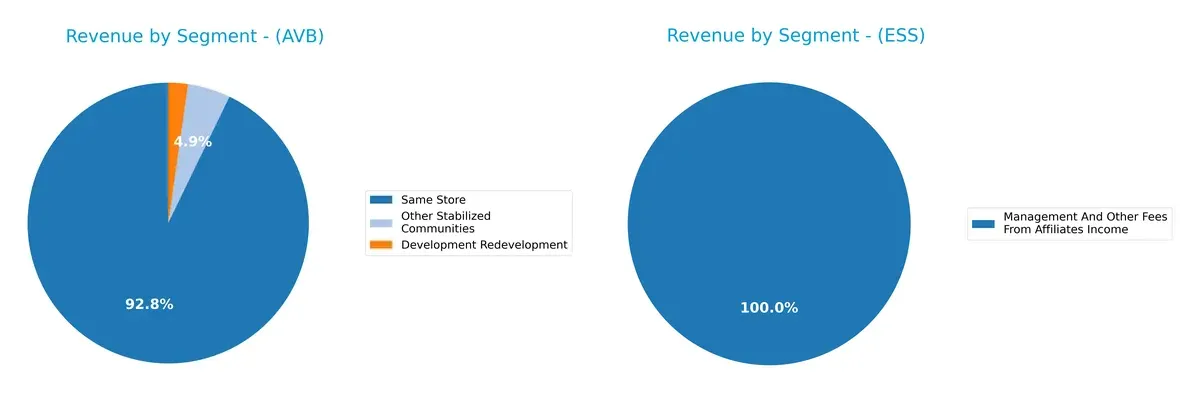
AvalonBay commands a concentrated mix, with Same Store revenue hitting $2.54B in 2023, dwarfing its smaller Development Redevelopment ($62M) and Other Stabilized Communities ($135M). Essex leans heavily on Rental and Other Property Revenues at $1.28B in 2018, with minimal fees from affiliates. AvalonBay’s focus anchors its ecosystem lock-in, while Essex’s narrower scope suggests higher concentration risk amid limited diversification.
Strengths and Weaknesses Comparison
This table compares the strengths and weaknesses of AvalonBay Communities, Inc. and Essex Property Trust, Inc.:
AvalonBay Strengths
- Strong net margin at 37.13%
- Favorable interest coverage at 5.05
- Solid fixed asset turnover at 18.84
- Consistent revenue from established communities
- Favorable dividend yield at 3.08%
Essex Strengths
- Favorable price-to-earnings and price-to-book ratios
- Favorable debt-to-equity and debt-to-assets metrics
- Focused revenue generation in Northern and Southern California
- Stable management fees from affiliates
AvalonBay Weaknesses
- Unfavorable return on equity at 9.06% and ROIC at 4.52% below WACC
- Low current and quick ratios at 0.36 indicating liquidity concerns
- High price-to-earnings ratio at 28.87
- Asset turnover at 0.14 is weak
Essex Weaknesses
- Negative net margin at -1.75%
- Zero return on equity and ROIC
- Negative interest coverage
- Unavailable WACC and zero asset turnover
- No dividend yield
AvalonBay demonstrates operational profitability and asset efficiency but faces liquidity and capital return challenges. Essex shows financial stress with weak profitability and coverage ratios but maintains favorable leverage metrics and regional market focus. Both companies’ strengths and weaknesses reveal different strategic priorities impacting their financial profiles.
The Moat Duel: Analyzing Competitive Defensibility
A structural moat is the only shield protecting long-term profits from relentless competitive erosion. Let’s dissect how AvalonBay and Essex defend their turf:
AvalonBay Communities, Inc.: Geographic Concentration & Scale Economies
AvalonBay’s moat stems from its scale across 11 states and high operational efficiency, reflected in a stable 34.6% net margin. Its ROIC lags WACC, signaling value erosion but improving profitability suggests potential deepening in expansion markets like Southeast Florida and Denver.
Essex Property Trust, Inc.: West Coast Market Focus & Premium Portfolio
Essex relies on a concentrated West Coast presence with premium assets, evidenced by a strong 70.4% gross margin but a troubling zero EBIT margin. Its declining ROIC trend warns of weakening capital efficiency despite top-line growth, challenging future moat sustainability.
Scale & Geographic Breadth vs. Market Premium and Concentration
AvalonBay’s broader geographic reach and improving ROIC trend offer a wider moat than Essex’s niche, which suffers from declining capital returns. I see AvalonBay better positioned to defend market share amid shifting regional dynamics.
Which stock offers better returns?
Stock prices for AvalonBay Communities, Inc. and Essex Property Trust, Inc. have shown diverging trends over the past 12 months, with distinct shifts in momentum and trading volumes.
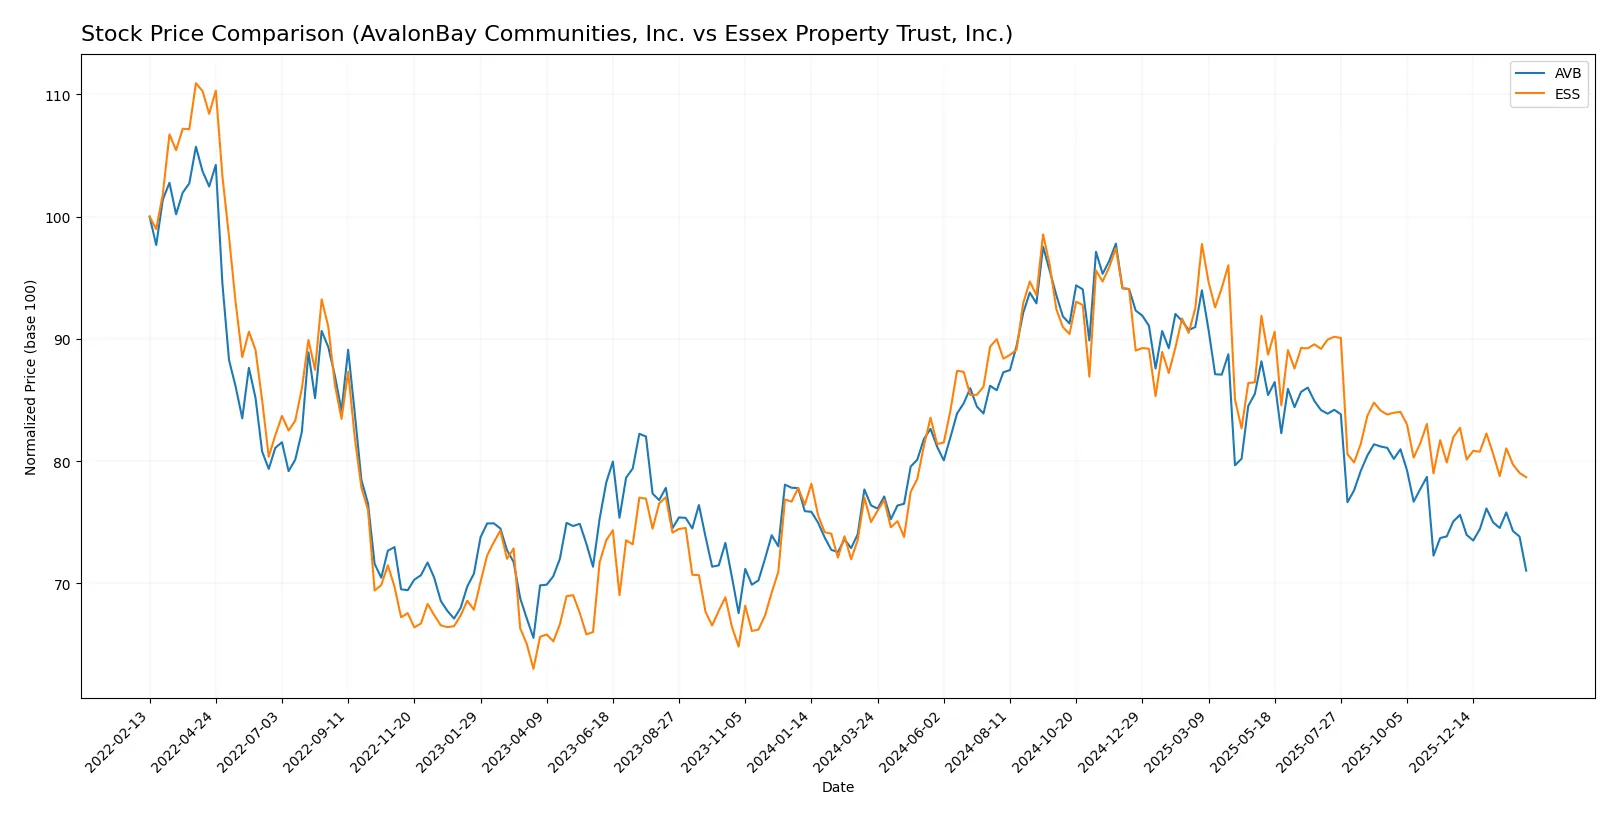
Trend Comparison
AvalonBay Communities, Inc. experienced a 7.0% price decline over the past year, reflecting a bearish trend with deceleration and a notable high of 235.35 and low of 170.97.
Essex Property Trust, Inc. recorded a 4.9% price gain over the same period, indicating a bullish trend despite deceleration and a wide trading range between 235.17 and 314.05.
Comparatively, Essex Property Trust outperformed AvalonBay with positive returns, whereas AvalonBay posted a significant negative price change.
Target Prices
Analysts show a strong bullish consensus for AvalonBay Communities and Essex Property Trust.
| Company | Target Low | Target High | Consensus |
|---|---|---|---|
| AvalonBay Communities, Inc. | 172 | 217 | 193.9 |
| Essex Property Trust, Inc. | 271 | 292 | 280.4 |
AvalonBay’s target consensus sits modestly above its current price of 171.26, implying upside potential. Essex’s consensus target of 280.4 suggests a significant premium over its current price of 251.02, reflecting robust growth expectations.

Don’t Let Luck Decide Your Entry Point
Optimize your entry points with our advanced ProRealTime indicators. You’ll get efficient buy signals with precise price targets for maximum performance. Start outperforming now!
How do institutions grade them?
AvalonBay Communities, Inc. Grades
The following table summarizes AvalonBay Communities’ recent institutional grades and actions:
| Grading Company | Action | New Grade | Date |
|---|---|---|---|
| Truist Securities | Maintain | Buy | 2026-01-20 |
| Barclays | Maintain | Overweight | 2026-01-13 |
| UBS | Maintain | Neutral | 2026-01-08 |
| Colliers Securities | Downgrade | Neutral | 2025-12-04 |
| Truist Securities | Maintain | Buy | 2025-12-02 |
| Barclays | Upgrade | Overweight | 2025-11-25 |
| Mizuho | Maintain | Neutral | 2025-11-24 |
| Morgan Stanley | Maintain | Overweight | 2025-11-13 |
| UBS | Maintain | Neutral | 2025-11-10 |
| Wells Fargo | Maintain | Overweight | 2025-11-10 |
Essex Property Trust, Inc. Grades
Below is a summary of Essex Property Trust’s institutional grades and recent changes:
| Grading Company | Action | New Grade | Date |
|---|---|---|---|
| BMO Capital | Downgrade | Market Perform | 2026-01-09 |
| UBS | Maintain | Neutral | 2026-01-08 |
| Truist Securities | Maintain | Hold | 2025-12-16 |
| Jefferies | Downgrade | Hold | 2025-12-16 |
| Barclays | Maintain | Equal Weight | 2025-11-25 |
| Mizuho | Maintain | Outperform | 2025-11-24 |
| UBS | Maintain | Neutral | 2025-11-10 |
| Wells Fargo | Maintain | Equal Weight | 2025-11-10 |
| Scotiabank | Maintain | Sector Outperform | 2025-11-04 |
| Evercore ISI Group | Maintain | In Line | 2025-11-03 |
Which company has the best grades?
AvalonBay Communities consistently receives stronger grades, including multiple Buy and Overweight ratings. Essex Property Trust mostly holds Neutral, Hold, and Equal Weight grades, with some downgrades. Investors might interpret AvalonBay as favored by analysts, potentially influencing portfolio positioning.
Risks specific to each company
The risk categories below identify the critical pressure points and systemic threats facing both AvalonBay Communities, Inc. and Essex Property Trust, Inc. in the 2026 market environment:
1. Market & Competition
AvalonBay Communities, Inc.
- Operates in multiple metro areas with moderate competitive pressures.
Essex Property Trust, Inc.
- Focuses on West Coast markets with intense competition from local and national REITs.
2. Capital Structure & Debt
AvalonBay Communities, Inc.
- Moderate leverage (D/E 0.69), manageable interest coverage (5.05x).
Essex Property Trust, Inc.
- Limited data on debt; interest coverage negative, signaling financial stress.
3. Stock Volatility
AvalonBay Communities, Inc.
- Beta around 0.75 implies moderate volatility below market average.
Essex Property Trust, Inc.
- Beta 0.74, similarly moderate volatility, slightly less trading volume.
4. Regulatory & Legal
AvalonBay Communities, Inc.
- Exposure to residential real estate regulations across 11 states and D.C.
Essex Property Trust, Inc.
- Concentrated in West Coast, facing stricter local housing regulations.
5. Supply Chain & Operations
AvalonBay Communities, Inc.
- Manages 291 communities, with ongoing developments; operational scale is a strength.
Essex Property Trust, Inc.
- Owns 246 communities with fewer developments; smaller scale may limit operational flexibility.
6. ESG & Climate Transition
AvalonBay Communities, Inc.
- Operating in diverse regions requires varied ESG compliance, increasing complexity.
Essex Property Trust, Inc.
- Concentrated geography heightens climate transition risks but allows focused ESG strategies.
7. Geopolitical Exposure
AvalonBay Communities, Inc.
- U.S.-centric with diversified metro exposure; geopolitical risks limited but present.
Essex Property Trust, Inc.
- Also U.S.-focused, concentrated in California; state-specific political risks may impact operations.
Which company shows a better risk-adjusted profile?
AvalonBay’s greatest risk lies in its slightly unfavorable liquidity ratios and moderate leverage amid a diverse portfolio. Essex faces critical financial distress signals, especially negative interest coverage and unfavorable profitability metrics. Despite Essex’s strong Piotroski score, AvalonBay’s balanced capital structure and better Altman Z-score place it ahead on a risk-adjusted basis, reflecting more prudent financial management in 2026.
Final Verdict: Which stock to choose?
AvalonBay Communities, Inc. (AVB) stands out with its operational efficiency and consistent cash flow generation, which I see as its superpower in a capital-intensive sector. However, its low liquidity ratios signal a point of vigilance. AVB fits well in an Aggressive Growth portfolio seeking rising profitability despite current challenges.
Essex Property Trust, Inc. (ESS) boasts a strategic moat rooted in its recurring revenue model and solid asset base. Its financial safety profile appears stronger relative to AVB, especially with higher liquidity and a robust Piotroski score. ESS aligns better with a GARP portfolio balancing growth prospects and relative stability.
If you prioritize operational efficiency and growth momentum, AVB is the compelling choice due to its improving profitability trajectory. However, if you seek better financial stability and a safer balance sheet, ESS offers superior defensive qualities despite recent profitability headwinds. Both present distinct analytical scenarios depending on your risk appetite and investment horizon.
Disclaimer: Investment carries a risk of loss of initial capital. The past performance is not a reliable indicator of future results. Be sure to understand risks before making an investment decision.
Go Further
I encourage you to read the complete analyses of AvalonBay Communities, Inc. and Essex Property Trust, Inc. to enhance your investment decisions: