Home > Comparison > Consumer Cyclical > ORLY vs AZO
The strategic rivalry between O’Reilly Automotive, Inc. and AutoZone, Inc. shapes the competitive landscape of the automotive aftermarket parts industry. O’Reilly operates as a capital-efficient retailer focusing on do-it-yourself and professional service providers, while AutoZone emphasizes scale and distribution with a broad product range across North America. This analysis pits O’Reilly’s operational precision against AutoZone’s expansive footprint to determine which offers the superior risk-adjusted return for a diversified portfolio.

Table of contents
Companies Overview
O’Reilly Automotive and AutoZone dominate the U.S. automotive aftermarket parts sector with complementary strengths.
O’Reilly Automotive, Inc.: Leading U.S. Auto Parts Retailer
O’Reilly Automotive commands a strong market position as a retailer and supplier of aftermarket automotive parts. It generates revenue by selling new and remanufactured hard parts alongside accessories and maintenance items through 5,784 stores in the U.S. and Mexico. In 2021, the company focused on expanding its service offerings, including diagnostic testing and professional paint shop materials.
AutoZone, Inc.: Premier Auto Parts Distributor
AutoZone holds a significant footprint with 6,785 stores across the U.S., Mexico, and Brazil. Its core revenue stems from retailing and distributing replacement parts, accessories, and maintenance products. In 2021, AutoZone emphasized commercial credit programs, delivery services, and enhancing its digital platforms, including automotive diagnostic software sales under the ALLDATA brand.
Strategic Collision: Similarities & Divergences
Both companies pursue a broad product mix for DIY and professional customers but diverge in their strategic approach. O’Reilly leans into enhanced in-store services and professional support, while AutoZone invests heavily in commercial credit and digital solutions. Their primary battleground is the North American aftermarket parts market, where O’Reilly offers a service-rich experience, and AutoZone focuses on scale and technological integration. This contrast underscores distinct investment profiles centered on customer engagement versus operational efficiency.
Income Statement Comparison
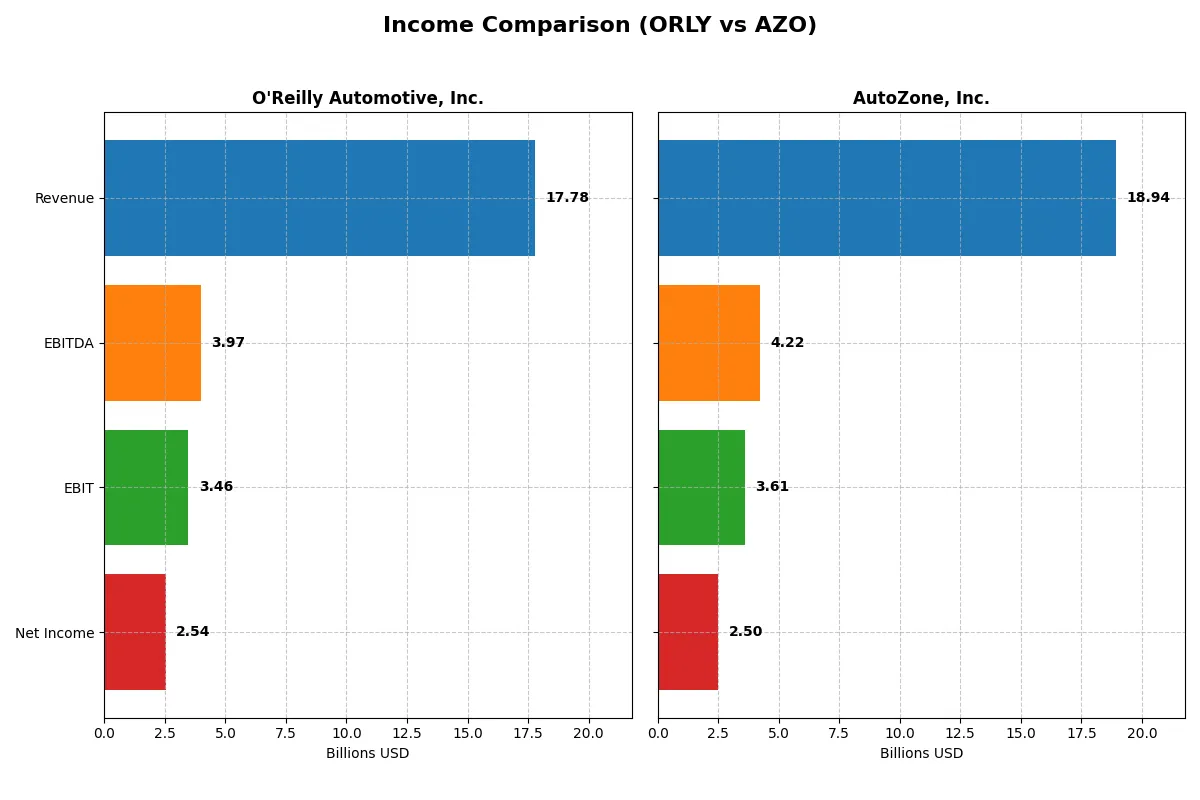
This data dissects the core profitability and scalability of both corporate engines to reveal who dominates the bottom line:
| Metric | O’Reilly Automotive, Inc. (ORLY) | AutoZone, Inc. (AZO) |
|---|---|---|
| Revenue | 17.8B | 18.9B |
| Cost of Revenue | 8.6B | 8.97B |
| Operating Expenses | 5.7B | 6.36B |
| Gross Profit | 9.2B | 10.0B |
| EBITDA | 4.0B | 4.2B |
| EBIT | 3.5B | 3.6B |
| Interest Expense | 235M | 487M |
| Net Income | 2.54B | 2.50B |
| EPS | 2.98 | 148.8 |
| Fiscal Year | 2025 | 2025 |
Income Statement Analysis: The Bottom-Line Duel
This income statement comparison exposes which company runs a more efficient and profitable business engine through recent financial performance.
O’Reilly Automotive, Inc. Analysis
O’Reilly’s revenue climbed steadily from $13.3B in 2021 to $17.8B in 2025, with net income rising from $2.16B to $2.54B. Its gross margin remains robust at 51.6%, and net margin holds at a healthy 14.3%. The 2025 figures show solid momentum, despite a slight net margin dip, signaling strong operational control and consistent profit growth.
AutoZone, Inc. Analysis
AutoZone’s revenue grew from $14.6B in 2021 to $18.9B in 2025, while net income increased from $2.17B to $2.50B. Gross margin stands slightly higher at 52.6%, but net margin trails at 13.2%. However, the latest year reveals weakening EBIT and net margin growth, indicating pressure on profitability despite revenue gains and impressive EPS growth over the longer term.
Steady Profit Growth vs. Margin Compression
O’Reilly outpaces AutoZone in net income growth and margin stability, delivering more consistent profitability gains. AutoZone offers higher gross margins but suffers from recent margin erosion and EBIT declines. Investors seeking a steadily improving bottom line may favor O’Reilly’s profile, while AutoZone’s scale and historical EPS growth appeal to those comfortable with margin volatility.
Financial Ratios Comparison
These vital ratios act as a diagnostic tool to expose underlying fiscal health, valuation premiums, and capital efficiency for the companies compared below:
| Ratios | O’Reilly Automotive, Inc. (ORLY) | AutoZone, Inc. (AZO) |
|---|---|---|
| ROE | 0% (2025) | -0.73% (2025) |
| ROIC | 36.3% (2024) | 28.1% (2025) |
| P/E | 30.6 (2025) | 28.2 (2025) |
| P/B | N/A (negative, 2024) | N/A (negative, 2025) |
| Current Ratio | 0.71 (2024) | 0.88 (2025) |
| Quick Ratio | 0.09 (2024) | 0.14 (2025) |
| D/E (Debt-to-Equity) | N/A (negative, 2024) | N/A (negative, 2025) |
| Debt-to-Assets | 53.2% (2024) | 63.5% (2025) |
| Interest Coverage | 14.6x (2024) | 7.4x (2025) |
| Asset Turnover | 1.12 (2024) | 0.98 (2025) |
| Fixed Asset Turnover | 2.11 (2024) | 1.85 (2025) |
| Payout Ratio | 0% (2025) | 0% (2025) |
| Dividend Yield | 0% (2025) | 0% (2025) |
| Fiscal Year | 2025 | 2025 |
Efficiency & Valuation Duel: The Vital Signs
Financial ratios serve as a company’s DNA, uncovering hidden risks and revealing operational strengths that drive investor confidence.
O’Reilly Automotive, Inc.
O’Reilly shows a strong net margin at 14.27%, signaling operational efficiency. However, its ROE and ROIC are zero, suggesting weak profitability on equity and invested capital. The P/E ratio at 30.6 appears stretched, indicating an expensive valuation. The company pays no dividend, presumably reinvesting in growth or operations.
AutoZone, Inc.
AutoZone posts a solid net margin of 13.19%, slightly below O’Reilly’s. ROIC impresses at 28.13%, reflecting efficient capital use, despite a negative ROE of -73.17%. Its P/E ratio at 28.22 is also elevated but less stretched than O’Reilly’s. No dividend payout suggests a focus on reinvesting for future expansion.
Premium Valuation vs. Operational Efficiency
O’Reilly carries a higher valuation multiple but lacks returns on equity and invested capital. AutoZone balances a better ROIC with a somewhat lower P/E, offering a more favorable risk-reward ratio. Investors seeking operational efficiency might prefer AutoZone’s profile, while those betting on growth could weigh O’Reilly’s premium valuation.
Which one offers the Superior Shareholder Reward?
I see O’Reilly Automotive (ORLY) and AutoZone (AZO) both avoid dividends, focusing on reinvestment and buybacks. ORLY’s free cash flow per share stands at $1.87 with no dividend yield, while AZO reports $106.6 per share, also without dividends. Both maintain strong buyback programs, but AZO’s free cash flow and operating cash flow per share vastly outpace ORLY’s, signaling greater capacity to return capital via buybacks. Historically, AZO’s capital allocation prioritizes high free cash flow reinvestment and buybacks, which I find more sustainable and rewarding for shareholders. In 2026, AZO offers a superior total return profile due to its stronger cash generation and balanced reinvestment strategy.
Comparative Score Analysis: The Strategic Profile
The radar chart reveals the fundamental DNA and trade-offs of O’Reilly Automotive and AutoZone, highlighting their financial strengths and valuation nuances:
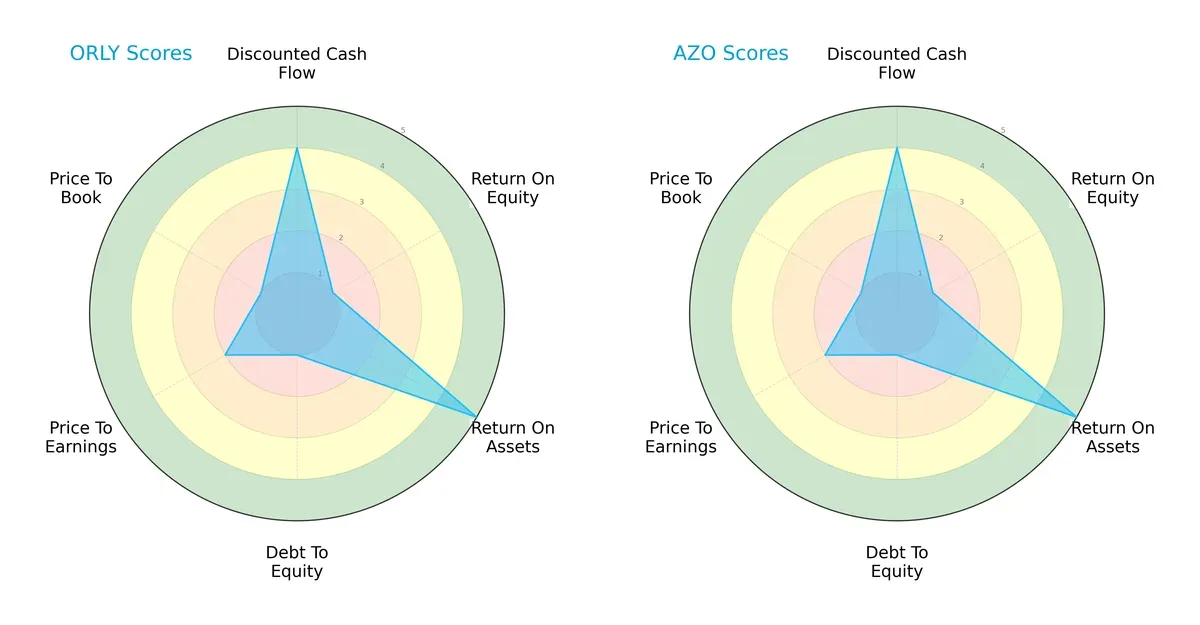
Both companies share identical profiles with strong discounted cash flow (4) and return on assets (5) scores. However, both suffer from weak return on equity (1) and debt-to-equity (1) scores, indicating high leverage and low equity efficiency. Valuation metrics (PE at 2, PB at 1) suggest both are currently viewed as expensive or overvalued by the market. Neither company holds a balanced advantage; instead, they rely on solid asset efficiency and future cash flows to offset leverage risks.
Bankruptcy Risk: Solvency Showdown
O’Reilly’s Altman Z-Score of 4.15 places it firmly in the safe zone, while AutoZone’s 2.85 sits in the grey zone, signaling moderate bankruptcy risk:
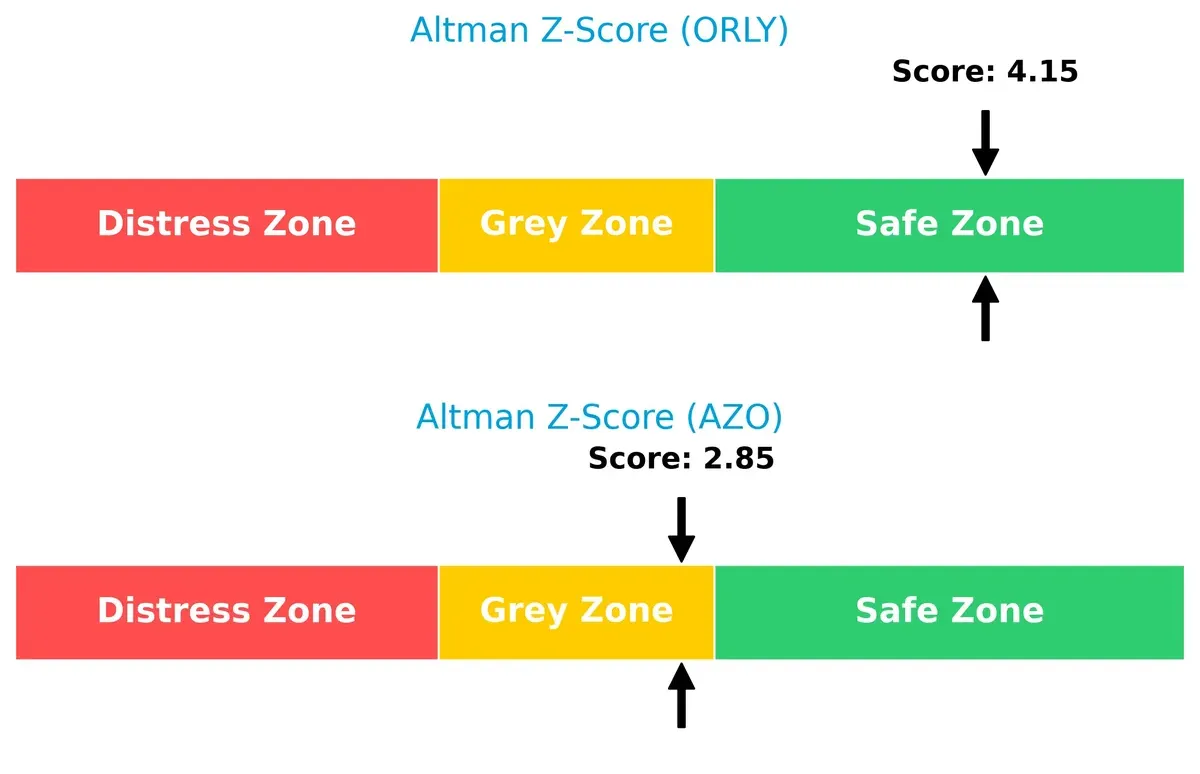
This delta implies O’Reilly commands stronger long-term financial stability amid economic cycles. AutoZone’s score suggests caution, as it may face solvency pressures if market conditions worsen.
Financial Health: Quality of Operations
Both firms score a solid 7 on the Piotroski F-Score, indicating strong financial health and operational quality without immediate red flags:
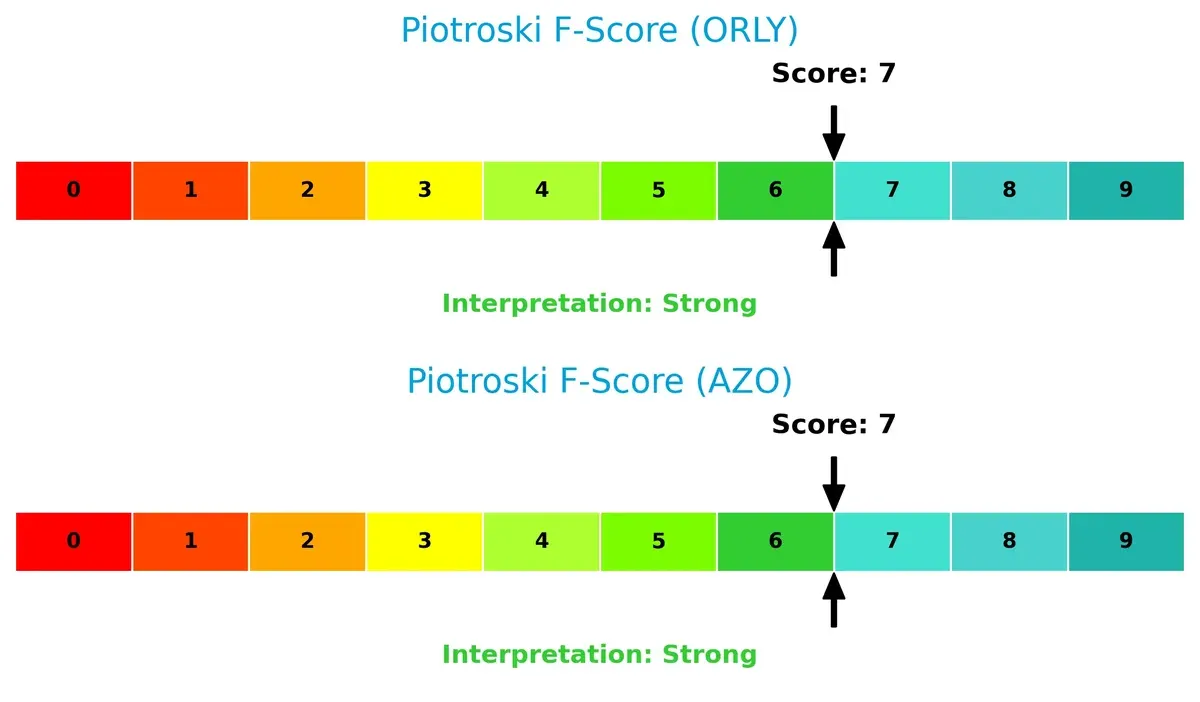
Their internal metrics reflect robust profitability, liquidity, and efficiency. This parity suggests neither company currently struggles with underlying financial weaknesses, supporting their investment cases despite leverage concerns.
How are the two companies positioned?
This section dissects the operational DNA of O’Reilly and AutoZone by comparing revenue distribution and internal strengths and weaknesses. The goal is to confront their economic moats to identify which model offers the most resilient competitive advantage today.
Revenue Segmentation: The Strategic Mix
This visual comparison dissects how O’Reilly Automotive and AutoZone diversify their income streams and where their primary sector bets lie:
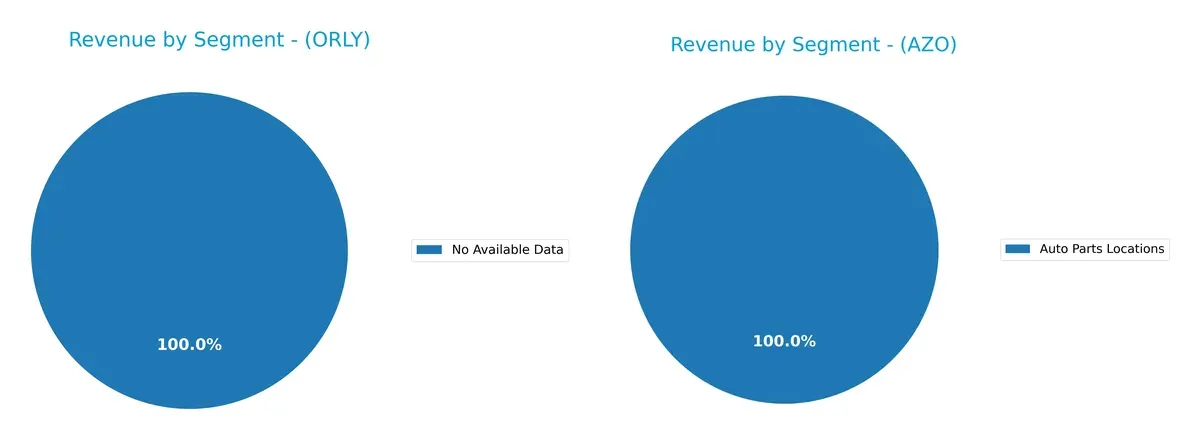
O’Reilly Automotive lacks available data, preventing segmentation analysis. AutoZone anchors its revenue in Auto Parts Locations, generating $18.9B in 2025. Its “Other” segments barely register at $340M. AutoZone’s reliance on a dominant auto parts segment signals infrastructure dominance but poses concentration risk without diversification buffers. This contrasts with a more balanced model that would reduce exposure to sector-specific shocks.
Strengths and Weaknesses Comparison
This table compares the Strengths and Weaknesses of O’Reilly Automotive, Inc. and AutoZone, Inc.:
O’Reilly Automotive, Inc. Strengths
- Favorable net margin at 14.27%
- Strong interest coverage at 14.72
- Low debt-to-assets ratio
- Favorable debt-to-equity profile
AutoZone, Inc. Strengths
- Favorable net margin at 13.19%
- High ROIC at 28.13% above WACC at 5.27%
- Solid interest coverage at 7.42
- Significant revenue of $18.9B with strong US and Non-US presence
O’Reilly Automotive, Inc. Weaknesses
- Zero ROE and ROIC indicate poor capital efficiency
- Unavailable WACC data
- Unfavorable PE of 30.6
- Weak liquidity ratios (current and quick ratio both zero)
- No dividend yield
- Unfavorable asset and fixed asset turnover
AutoZone, Inc. Weaknesses
- Negative ROE at -73.17% despite favorable ROIC
- High debt-to-assets ratio at 63.49%
- Unfavorable PE of 28.22
- Low liquidity ratios (current 0.88, quick 0.14)
- No dividend yield
Both companies exhibit strengths in profitability and interest coverage, yet each faces liquidity and capital efficiency challenges. AutoZone’s strong ROIC and sizable revenue highlight operational effectiveness, while O’Reilly’s conservative leverage lowers financial risk. These factors influence each firm’s strategic focus on capital allocation and growth.
The Moat Duel: Analyzing Competitive Defensibility
A structural moat shields long-term profits from relentless competition erosion. Its quality defines sustainable market advantage:
O’Reilly Automotive, Inc.: Intangible Assets Driving Customer Loyalty
O’Reilly’s moat stems from strong brand recognition and extensive service offerings. High gross margins near 52% reflect pricing power. New store expansions and enhanced services in 2026 could deepen customer lock-in.
AutoZone, Inc.: Cost Advantage Through Operational Efficiency
AutoZone leverages scale and supply chain efficiency for a cost moat. Despite a slightly lower EBIT margin, it sustains ROIC well above WACC, signaling value creation. Expansion into Latin America offers growth but intensifies execution risk.
Brand Loyalty vs. Cost Leadership: The Moat Face-Off
O’Reilly’s intangible asset moat delivers margin stability and customer stickiness. AutoZone’s cost advantage produces superior ROIC but shows signs of margin pressure. I see AutoZone holding a slightly wider moat, better equipped to defend market share amid tightening competition.
Which stock offers better returns?
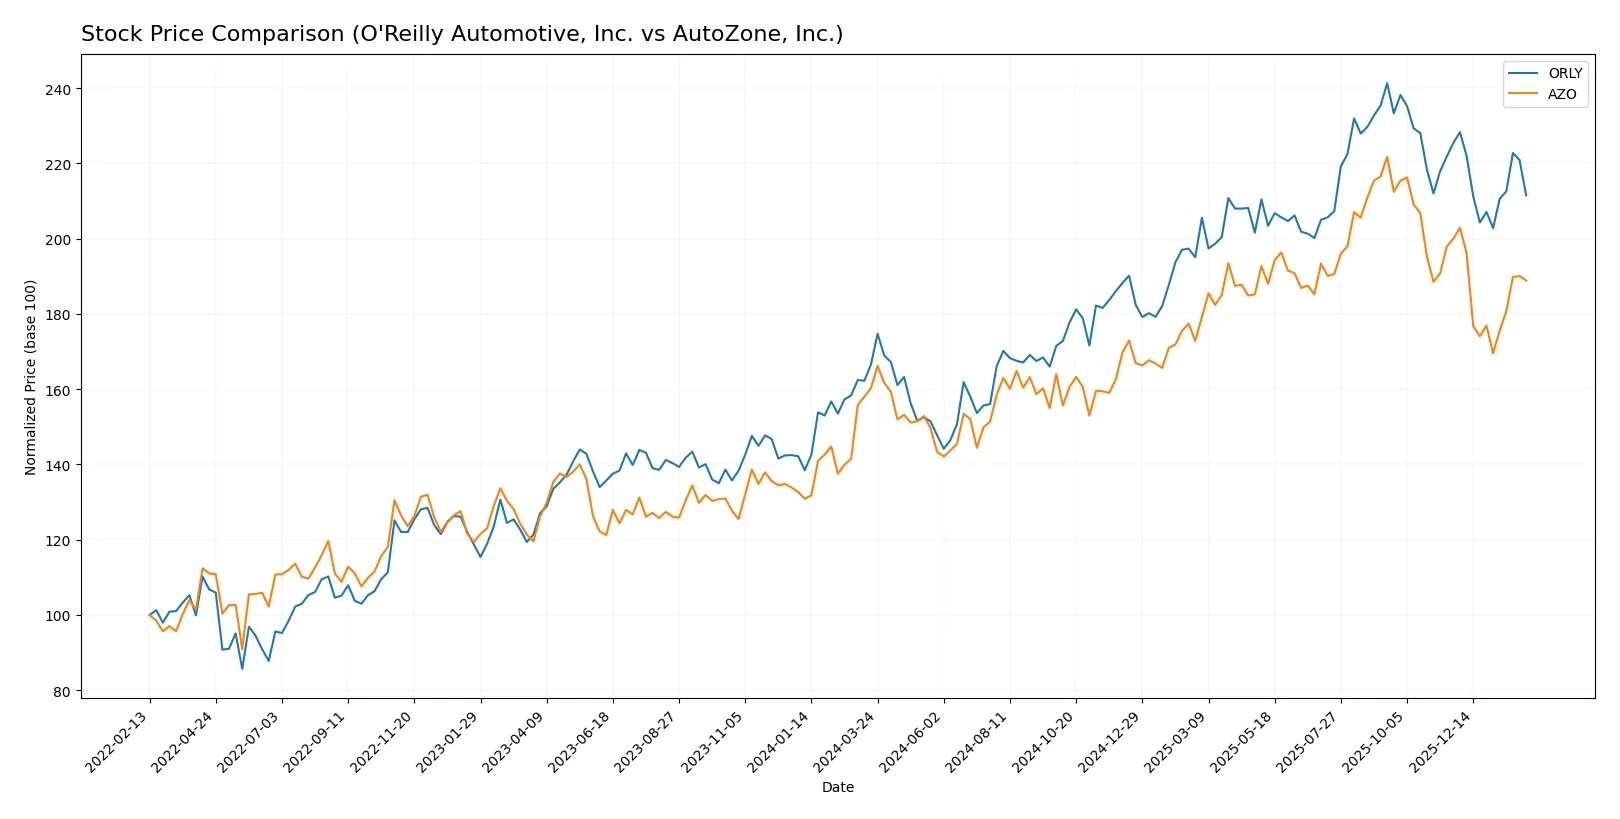
The past year shows strong bullish trends for both stocks, with O’Reilly Automotive gaining significant ground despite recent deceleration, while AutoZone also posts gains amid declining volume.
Trend Comparison
O’Reilly Automotive’s stock rose 27% over the past year, marking a bullish trend with decelerating momentum and a high of 107.5. Recent months show a mild bearish correction of -6.18%.
AutoZone’s stock increased 17.8% in the last 12 months, also bullish but with decelerating gains and substantial volatility. Its recent trend declined by 5.56%, reflecting short-term weakness.
O’Reilly Automotive outperformed AutoZone with a higher overall return despite both stocks facing recent downward pressure.
Target Prices
Analysts present a bullish consensus for both O’Reilly Automotive and AutoZone, reflecting confidence in their market positions.
| Company | Target Low | Target High | Consensus |
|---|---|---|---|
| O’Reilly Automotive, Inc. | 91 | 121 | 108.77 |
| AutoZone, Inc. | 3550 | 4800 | 4336.8 |
O’Reilly’s consensus target sits about 15% above its current 94.22 price, signaling moderate upside. AutoZone’s target suggests a roughly 18% gain from its 3681.26 price, indicating strong growth expectations.

Don’t Let Luck Decide Your Entry Point
Optimize your entry points with our advanced ProRealTime indicators. You’ll get efficient buy signals with precise price targets for maximum performance. Start outperforming now!
How do institutions grade them?
Here is a summary of the most recent institutional grades for O’Reilly Automotive, Inc. and AutoZone, Inc.:
O’Reilly Automotive, Inc. Grades
The following table details recent grades from major financial institutions for O’Reilly Automotive:
| Grading Company | Action | New Grade | Date |
|---|---|---|---|
| DA Davidson | Maintain | Buy | 2026-02-06 |
| JP Morgan | Maintain | Overweight | 2026-02-06 |
| Truist Securities | Maintain | Buy | 2026-02-06 |
| RBC Capital | Maintain | Outperform | 2026-02-06 |
| Mizuho | Maintain | Outperform | 2026-02-06 |
| DA Davidson | Maintain | Buy | 2026-02-05 |
| DA Davidson | Maintain | Buy | 2026-02-03 |
| RBC Capital | Maintain | Outperform | 2026-01-30 |
| Morgan Stanley | Maintain | Overweight | 2026-01-15 |
| Evercore ISI Group | Maintain | Outperform | 2025-12-16 |
AutoZone, Inc. Grades
The following table shows recent grades from notable financial institutions for AutoZone:
| Grading Company | Action | New Grade | Date |
|---|---|---|---|
| Morgan Stanley | Maintain | Overweight | 2026-01-15 |
| Barclays | Maintain | Overweight | 2026-01-08 |
| Mizuho | Downgrade | Neutral | 2026-01-05 |
| JP Morgan | Maintain | Overweight | 2025-12-18 |
| Wolfe Research | Downgrade | Peer Perform | 2025-12-16 |
| Citigroup | Maintain | Buy | 2025-12-11 |
| Guggenheim | Maintain | Buy | 2025-12-10 |
| BMO Capital | Maintain | Outperform | 2025-12-10 |
| UBS | Maintain | Buy | 2025-12-10 |
| Truist Securities | Maintain | Buy | 2025-12-10 |
Which company has the best grades?
O’Reilly Automotive consistently receives high marks such as Buy and Outperform without downgrades. AutoZone shows mixed signals, including recent downgrades to Neutral and Peer Perform. This divergence may influence investor confidence and perceived risk differently for each company.
Risks specific to each company
The following categories identify the critical pressure points and systemic threats facing both firms in the 2026 market environment:
1. Market & Competition
O’Reilly Automotive, Inc.
- Faces intense competition in the US aftermarket auto parts sector with slower expansion outside the US.
AutoZone, Inc.
- Competes broadly with a larger footprint including Mexico and Brazil, increasing exposure but also market reach.
2. Capital Structure & Debt
O’Reilly Automotive, Inc.
- Exhibits favorable debt-to-equity and interest coverage ratios, indicating strong financial stability.
AutoZone, Inc.
- Shows a high debt-to-assets ratio (63.5%) and weaker liquidity, raising financial risk concerns.
3. Stock Volatility
O’Reilly Automotive, Inc.
- Beta of 0.62 suggests moderate market volatility sensitivity, less risky than broader market.
AutoZone, Inc.
- Beta of 0.41 indicates lower volatility and more defensive stock behavior.
4. Regulatory & Legal
O’Reilly Automotive, Inc.
- Subject to standard US retail and automotive aftermarket regulations with moderate compliance risk.
AutoZone, Inc.
- Faces regulatory scrutiny across multiple markets (US, Mexico, Brazil), increasing legal complexity.
5. Supply Chain & Operations
O’Reilly Automotive, Inc.
- Relies heavily on US-based supply chains, vulnerable to domestic disruptions but benefits from operational focus.
AutoZone, Inc.
- More diversified supply chain due to international stores but exposed to cross-border risks and logistics challenges.
6. ESG & Climate Transition
O’Reilly Automotive, Inc.
- Limited public ESG disclosures; potential risk as market demands greener practices.
AutoZone, Inc.
- Similar ESG profile with growing pressure to adapt to climate regulations across different countries.
7. Geopolitical Exposure
O’Reilly Automotive, Inc.
- Primarily US-focused, shielding it from most geopolitical risks but limiting growth avenues.
AutoZone, Inc.
- Exposure to Mexico and Brazil markets adds geopolitical risk, including currency and trade policy volatility.
Which company shows a better risk-adjusted profile?
O’Reilly Automotive’s strongest advantage lies in its superior capital structure and safe-zone Altman Z-score (4.15), indicating robust financial health. AutoZone’s high debt and grey-zone Z-score (2.85) raise caution. Despite broader market reach, AutoZone’s elevated financial leverage and geopolitical exposure worsen its risk profile. O’Reilly’s moderate volatility and concentrated US operations enhance its risk-adjusted appeal in 2026.
Final Verdict: Which stock to choose?
O’Reilly Automotive’s superpower lies in its robust income quality and efficient capital deployment, driving solid gross margins and cash flow resilience. However, its stretched liquidity position is a point of vigilance. It suits investors hunting for aggressive growth with a tolerance for operational leverage risks.
AutoZone benefits from a strategic moat built on strong return on invested capital outperforming its cost of capital, underscoring efficient capital use and value creation. Its superior interest coverage ratio and comparatively better liquidity profile offer a safer harbor than O’Reilly. It fits well in a growth-at-a-reasonable-price (GARP) portfolio seeking stability alongside expansion.
If you prioritize aggressive growth and can accept liquidity constraints, O’Reilly outshines with its cash generation and margin strength. However, if you seek better stability and a proven value-creating moat, AutoZone offers a more balanced risk-return profile despite a modest slowdown in profitability. Both present compelling analytical scenarios tailored to distinct investor appetites.
Disclaimer: Investment carries a risk of loss of initial capital. The past performance is not a reliable indicator of future results. Be sure to understand risks before making an investment decision.
Go Further
I encourage you to read the complete analyses of O’Reilly Automotive, Inc. and AutoZone, Inc. to enhance your investment decisions: