Home > Comparison > Industrials > ADP vs PAYX
The strategic rivalry between Automatic Data Processing, Inc. (ADP) and Paychex, Inc. (PAYX) defines the current trajectory of the staffing and employment services sector. ADP operates as a capital-intensive industrial giant with comprehensive cloud-based human capital management solutions. PAYX focuses on integrated HR and payroll services tailored to small and medium-sized businesses. This analysis will determine which business model offers the superior risk-adjusted return for a diversified portfolio.
Table of contents
Companies Overview
Two giants shape the staffing and employment services landscape with distinct scale and strategic focus.
Automatic Data Processing, Inc.: Leader in Cloud-Based Human Capital Management
Automatic Data Processing, Inc. dominates the market with cloud-based HCM solutions. Its core revenue comes from Employer Services and Professional Employer Organization segments offering payroll, benefits, talent management, and compliance. In 2026, ADP sharpens its competitive edge by expanding integrated platforms and co-employment solutions for small to mid-sized businesses worldwide.
Paychex, Inc.: Specialist in Integrated HR Services for SMEs
Paychex, Inc. excels in delivering integrated HR and payroll services primarily to small and medium enterprises across the US, Europe, and India. Its revenue engine is built on payroll processing, benefits administration, insurance, and cloud-based HR software. For 2026, Paychex emphasizes direct sales growth and enhanced insurance offerings to deepen its footprint in the SME market.
Strategic Collision: Similarities & Divergences
Both companies target staffing services but differ in scale and approach. ADP pursues a broad, integrated platform model with global reach. Paychex focuses on specialized, direct-to-client SME solutions. The primary battleground is payroll and HR management software for mid-sized businesses. Their distinct investment profiles reflect ADP’s scale-driven innovation versus Paychex’s niche specialization.
Income Statement Comparison
This data dissects the core profitability and scalability of both corporate engines to reveal who dominates the bottom line:

| Metric | Automatic Data Processing, Inc. (ADP) | Paychex, Inc. (PAYX) |
|---|---|---|
| Revenue | 20.56B | 5.57B |
| Cost of Revenue | 10.11B | 1.54B |
| Operating Expenses | 5.04B | 1.82B |
| Gross Profit | 10.45B | 4.03B |
| EBITDA | 6.24B | 2.49B |
| EBIT | 5.76B | 2.28B |
| Interest Expense | 456M | 105M |
| Net Income | 4.08B | 1.66B |
| EPS | 10.02 | 4.60 |
| Fiscal Year | 2025 | 2025 |
Income Statement Analysis: The Bottom-Line Duel
This income statement comparison reveals which company drives superior efficiency and profitability through its core business operations.
Automatic Data Processing, Inc. Analysis
ADP’s revenue climbed steadily from 15B in 2021 to 20.6B in 2025, with net income rising from 2.6B to 4.1B. Gross and net margins remain strong, above 50% and near 20%, respectively. The 2025 year shows solid momentum, with nearly 10% EBIT growth reflecting effective cost control despite rising operating expenses.
Paychex, Inc. Analysis
PAYX’s revenue increased from 4.1B in 2021 to 5.6B in 2025, with net income growing from 1.1B to 1.7B. Margins impress at 72% gross and nearly 30% net, indicating excellent cost efficiency. However, recent net margin and EPS contractions suggest challenges in sustaining profit momentum despite healthy top-line gains.
Margin Power vs. Revenue Scale
ADP outpaces PAYX in absolute revenue and net income growth, with robust margin expansions supporting its scale. PAYX boasts superior margin percentages but shows signs of margin pressure recently. For investors, ADP’s consistent growth and improving margins offer a more compelling profile for long-term earnings strength.
Financial Ratios Comparison
These vital ratios act as a diagnostic tool to expose the underlying fiscal health, valuation premiums, and capital efficiency of the companies compared below:
| Ratios | Automatic Data Processing, Inc. (ADP) | Paychex, Inc. (PAYX) |
|---|---|---|
| ROE | 65.9% | 40.1% |
| ROIC | 24.7% | 16.8% |
| P/E | 30.8 | 34.3 |
| P/B | 20.3 | 13.8 |
| Current Ratio | 1.05 | 1.28 |
| Quick Ratio | 1.05 | 1.28 |
| D/E (Debt-to-Equity) | 1.46 | 1.22 |
| Debt-to-Assets | 17.0% | 30.3% |
| Interest Coverage | 11.9 | 20.9 |
| Asset Turnover | 0.39 | 0.34 |
| Fixed Asset Turnover | 20.0 | 9.7 |
| Payout Ratio | 58.8% | 87.4% |
| Dividend Yield | 1.91% | 2.55% |
| Fiscal Year | 2025 | 2025 |
Efficiency & Valuation Duel: The Vital Signs
Financial ratios act as a company’s DNA, exposing hidden risks and operational strengths critical to investors’ understanding.
Automatic Data Processing, Inc.
ADP posts a robust 65.9% ROE and solid 19.8% net margin, signaling exceptional profitability. However, its P/E of 30.8 and P/B of 20.3 suggest a stretched valuation. The company balances this with a 1.9% dividend yield, returning cash while maintaining a favorable capital allocation profile.
Paychex, Inc.
Paychex delivers a healthy 40.2% ROE and superior 29.7% net margin, underlining efficiency. Yet its P/E at 34.3 and P/B of 13.8 mark it as expensive. The 2.55% dividend yield enhances shareholder returns, supported by strong interest coverage and prudent leverage.
Valuation Stretch vs. Profitability Strength
Both firms show favorable financial health with similar ratios’ favorability. ADP offers higher profitability but trades at a stretched multiple. Paychex combines solid margins with higher dividend yield and interest coverage. Investors prioritizing yield and efficiency may prefer Paychex; those focused on exceptional returns might lean toward ADP.
Which one offers the Superior Shareholder Reward?
I compare ADP and Paychex’s distribution strategies to find the superior shareholder reward. ADP yields about 1.9%, with a payout ratio near 58%, supported by robust FCF coverage (1.92x). Paychex offers a higher yield, around 2.5–3.0%, but with a stretched payout ratio near 78–87%, signaling less free cash flow cushion. Both run buybacks, but ADP’s free cash flow per share ($11.7) dwarfs Paychex’s ($4.9), allowing more sustainable capital returns. Paychex’s higher dividend yield appeals short-term, yet ADP’s balanced payout and strong cash flow generate a more durable total return profile in 2026. I conclude ADP offers superior long-term shareholder reward.
Comparative Score Analysis: The Strategic Profile
The radar chart reveals the fundamental DNA and trade-offs of Automatic Data Processing, Inc. and Paychex, Inc., highlighting their core financial strengths and weaknesses:
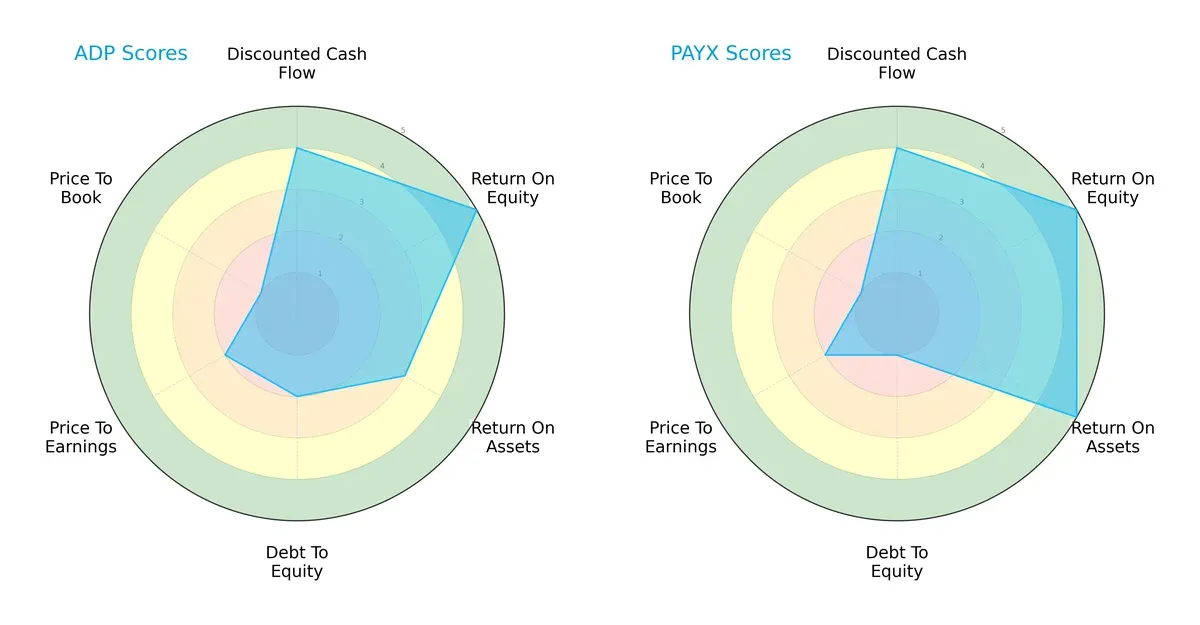
Both firms share strong discounted cash flow and return on equity scores, reflecting solid profitability and cash generation. Paychex outperforms on return on assets, indicating superior asset efficiency. However, Paychex carries higher financial risk with a weaker debt-to-equity score. ADP shows a more balanced risk profile but lags on asset utilization. Valuation metrics remain modest for both, signaling neither is deeply undervalued.
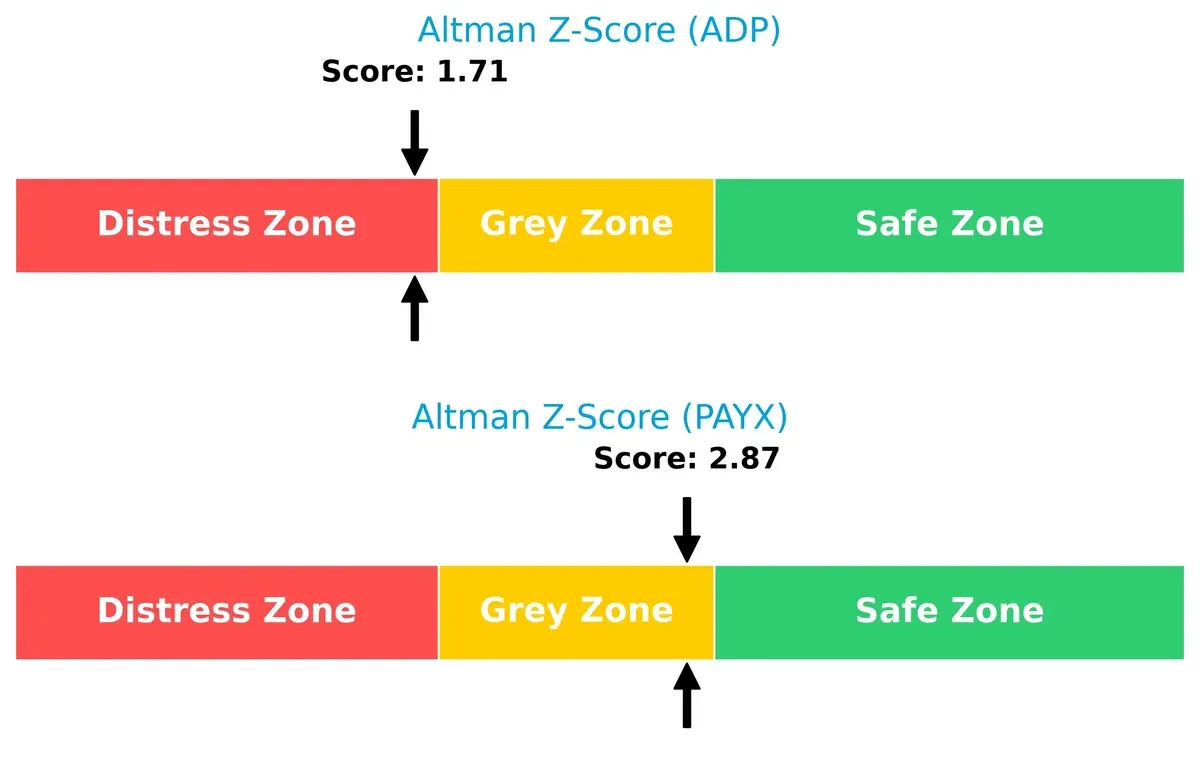
Bankruptcy Risk: Solvency Showdown
The Altman Z-Score difference signals Paychex is in a safer zone, while ADP resides in distress, implying higher bankruptcy risk for ADP under current market pressures:
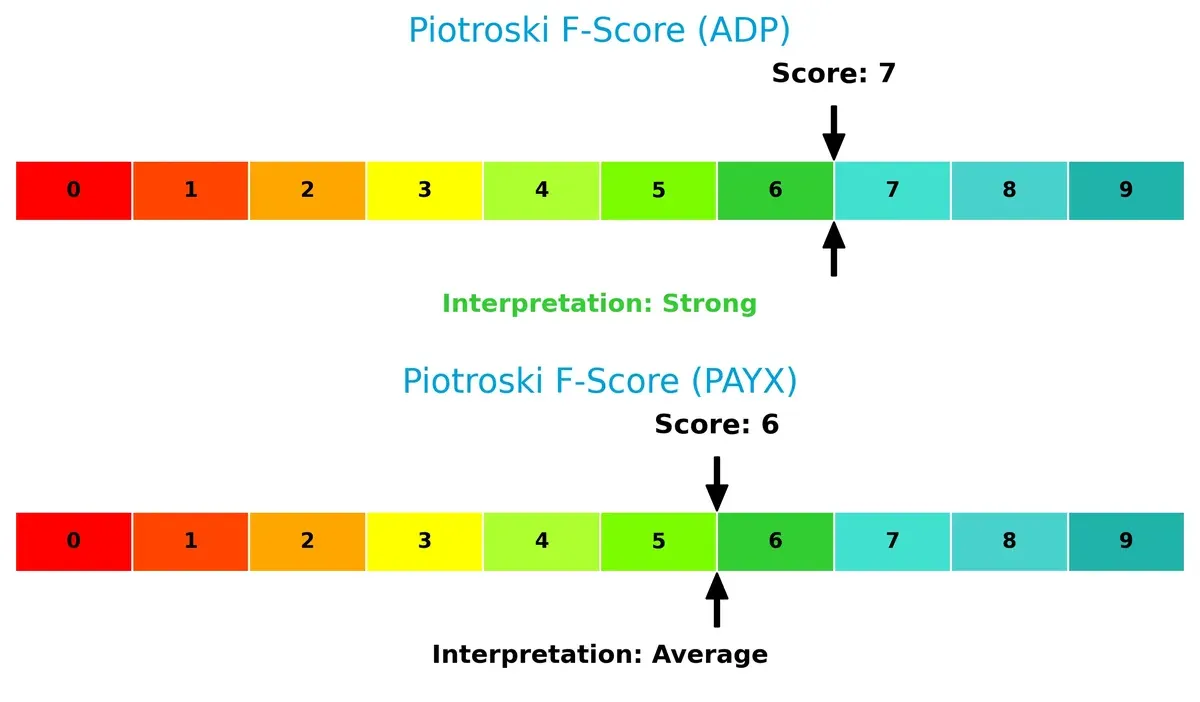
Financial Health: Quality of Operations
ADP’s Piotroski F-Score of 7 indicates strong financial health, surpassing Paychex’s average score of 6. This suggests ADP maintains more robust internal operations and fewer red flags:
How are the two companies positioned?
This section dissects the operational DNA of ADP and PAYX by comparing their revenue distribution and internal dynamics. The goal is to confront their economic moats and identify which model offers the most resilient competitive advantage today.
Revenue Segmentation: The Strategic Mix
The following comparison dissects how Automatic Data Processing, Inc. and Paychex, Inc. diversify their income streams and reveals where their primary sector bets lie:
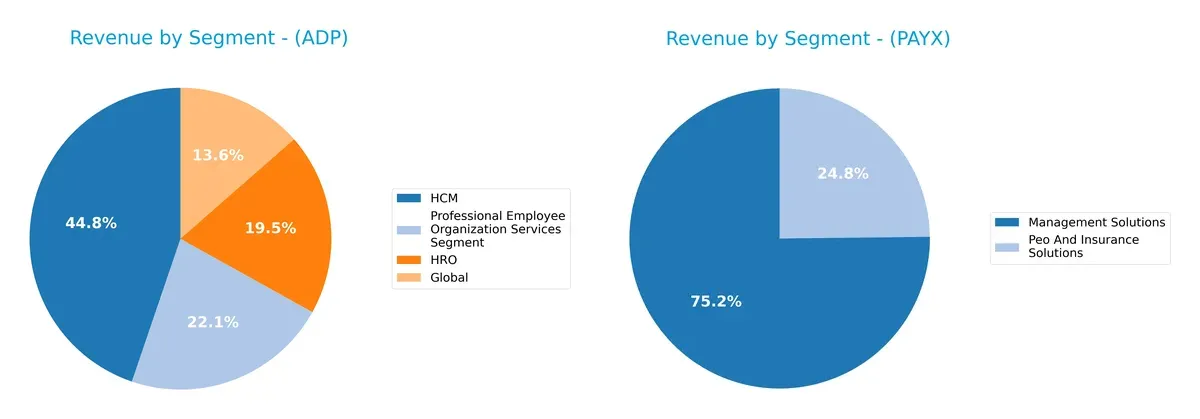
ADP anchors its revenue with a dominant HCM segment at $8.7B, followed by substantial contributions from Professional Employee Organization ($4.3B) and HRO ($3.8B). In contrast, Paychex pivots mainly on Management Solutions at $4.1B, with a smaller Peo and Insurance segment at $1.3B. ADP’s broader segment spread reduces concentration risk and suggests ecosystem lock-in, while Paychex’s leaner mix concentrates exposure but may allow sharper operational focus.
Strengths and Weaknesses Comparison
This table compares the Strengths and Weaknesses of ADP and PAYX based on diversification, profitability, financials, innovation, global presence, and market share:
ADP Strengths
- Broad product segmentation with strong HCM and global services
- Favorable net margin and ROIC exceeding WACC
- Robust interest coverage
- Diversified geographic presence including US, Europe, Canada
PAYX Strengths
- Higher net margin and dividend yield
- Favorable interest coverage and quick ratio
- Strong management solutions segment
- Lower debt-to-assets ratio compared to ADP
ADP Weaknesses
- Unfavorable P/E and P/B ratios indicating possible overvaluation
- Elevated debt-to-equity ratio
- Lower asset turnover compared to industry norms
- Moderate current ratio
PAYX Weaknesses
- Unfavorable P/E and P/B ratios
- Unfavorable debt-to-equity ratio
- No reported geographic diversification beyond US
- Lower ROIC compared to ADP
Both companies exhibit strong profitability and favorable cost of capital metrics but face valuation concerns. ADP’s global footprint contrasts with PAYX’s domestic focus, highlighting strategic differences in market diversification.
The Moat Duel: Analyzing Competitive Defensibility
A structural moat is the only reliable defense protecting long-term profits from relentless competitive erosion:
Automatic Data Processing, Inc. (ADP): Cloud-Enabled Switching Costs
ADP’s moat stems from high switching costs embedded in its integrated cloud-based HR solutions. Its ROIC outpaces WACC by 17%, signaling durable value creation. Expansion into global markets in 2026 should deepen this advantage.
Paychex, Inc. (PAYX): Niche Cost Efficiency
Paychex leverages cost advantages and tailored payroll services for SMBs, but its ROIC, although above WACC, is declining. PAYX faces margin pressure despite a solid footprint, with 2026 hinging on innovation to arrest profitability erosion.
Moat Resilience: Switching Costs vs. Cost Efficiency
ADP’s wide and growing moat outmatches Paychex’s narrower, eroding advantage. ADP is better positioned to defend market share through sticky client relationships and scalable platforms. Paychex must innovate aggressively to sustain its competitive edge.
Which stock offers better returns?
The past 12 months show contrasting dynamics: Automatic Data Processing, Inc. edges a modest gain with decelerating momentum, while Paychex, Inc. faces a pronounced decline amid slowing downside pressure.
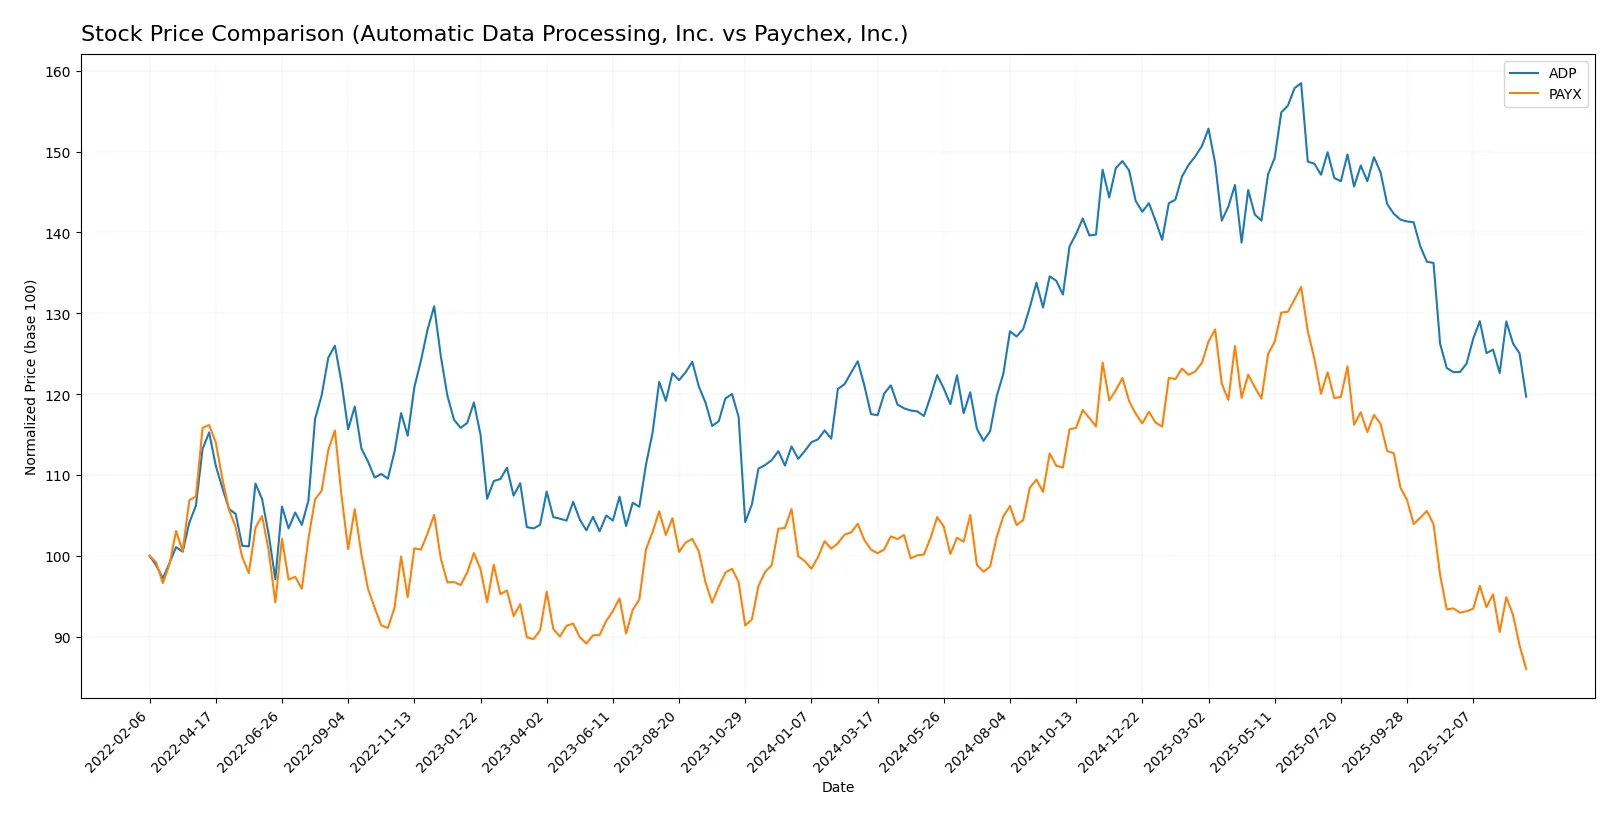
Trend Comparison
ADP’s 12-month price rose 1.82%, signaling a bullish trend with deceleration. The stock peaked at 326.81 and troughed at 235.56, showing relatively high volatility (std dev 25.11).
PAYX’s 12-month price dropped 14.64%, indicating a bearish trend with deceleration. Its highest point was 159.78, lowest 103.13, and volatility was moderate (std dev 13.75).
Comparing both, ADP delivered the highest market performance with a slight gain, while PAYX declined significantly over the same period.
Target Prices
The current analyst consensus reflects moderate upside potential for both ADP and Paychex.
| Company | Target Low | Target High | Consensus |
|---|---|---|---|
| Automatic Data Processing, Inc. (ADP) | 230 | 306 | 274.71 |
| Paychex, Inc. (PAYX) | 98 | 140 | 121.56 |
Analysts expect ADP’s share price to rise approximately 11% from its current 247 USD, signaling confidence in its steady cash flow. Paychex shows potential for a roughly 18% increase from 103 USD, reflecting solid fundamentals but also some valuation caution.

Don’t Let Luck Decide Your Entry Point
Optimize your entry points with our advanced ProRealTime indicators. You’ll get efficient buy signals with precise price targets for maximum performance. Start outperforming now!
How do institutions grade them?
Automatic Data Processing, Inc. Grades
Here are the latest grades from major financial institutions for ADP:
| Grading Company | Action | New Grade | Date |
|---|---|---|---|
| Citigroup | Maintain | Neutral | 2026-01-29 |
| Morgan Stanley | Maintain | Equal Weight | 2026-01-29 |
| Stifel | Maintain | Hold | 2026-01-29 |
| Wells Fargo | Maintain | Underweight | 2026-01-29 |
| JP Morgan | Maintain | Underweight | 2026-01-29 |
| Jefferies | Downgrade | Underperform | 2025-12-16 |
| JP Morgan | Maintain | Underweight | 2025-10-30 |
| Wells Fargo | Maintain | Underweight | 2025-10-30 |
| UBS | Maintain | Neutral | 2025-09-17 |
| Morgan Stanley | Maintain | Equal Weight | 2025-07-31 |
Paychex, Inc. Grades
The current institutional grades for Paychex, Inc. are detailed below:
| Grading Company | Action | New Grade | Date |
|---|---|---|---|
| Citigroup | Maintain | Neutral | 2025-12-22 |
| Morgan Stanley | Maintain | Equal Weight | 2025-12-22 |
| JP Morgan | Maintain | Underweight | 2025-12-22 |
| Stifel | Maintain | Hold | 2025-12-17 |
| BMO Capital | Maintain | Market Perform | 2025-12-09 |
| Wells Fargo | Maintain | Underweight | 2025-12-09 |
| Jefferies | Maintain | Hold | 2025-12-08 |
| TD Cowen | Maintain | Hold | 2025-12-01 |
| Morgan Stanley | Maintain | Equal Weight | 2025-10-20 |
| JP Morgan | Maintain | Underweight | 2025-10-01 |
Which company has the best grades?
ADP and Paychex both receive predominantly neutral to underweight ratings from institutions. ADP has a recent downgrade to underperform, which may raise caution. Paychex’s grades remain stable around hold and equal weight, suggesting slightly less negative sentiment. Investors might weigh these grades as signals of cautious market outlooks for both.
Risks specific to each company
The following categories identify the critical pressure points and systemic threats facing both firms in the 2026 market environment:
1. Market & Competition
Automatic Data Processing, Inc.
- Faces intense competition from both legacy HR providers and agile cloud-based startups.
Paychex, Inc.
- Also competes heavily in small to medium business HR solutions with pressure from digital disruptors.
2. Capital Structure & Debt
Automatic Data Processing, Inc.
- Debt-to-equity ratio at 1.46 signals moderate leverage, slightly riskier balance sheet.
Paychex, Inc.
- Lower debt-to-equity of 1.22, but higher debt-to-assets at 30.3%, signaling heavier debt reliance.
3. Stock Volatility
Automatic Data Processing, Inc.
- Beta of 0.86 indicates lower volatility than broader market, offering relative stability.
Paychex, Inc.
- Beta of 0.90 suggests slightly higher price swings, reflecting moderate market sensitivity.
4. Regulatory & Legal
Automatic Data Processing, Inc.
- Exposed to US labor and data privacy regulations; well-established compliance systems reduce risk.
Paychex, Inc.
- Similar regulatory exposure across US and expanding European/Indian markets adds complexity and legal risk.
5. Supply Chain & Operations
Automatic Data Processing, Inc.
- Cloud-based platforms reduce physical supply chain risks but depend on IT infrastructure resilience.
Paychex, Inc.
- Relies on integrated software and service delivery; operational complexity increases with geographic expansion.
6. ESG & Climate Transition
Automatic Data Processing, Inc.
- Moderate ESG risk with focus on data security and employee welfare under increasing investor scrutiny.
Paychex, Inc.
- Faces growing ESG demands in global markets, particularly on data privacy and sustainable business practices.
7. Geopolitical Exposure
Automatic Data Processing, Inc.
- Primarily US-focused, limiting geopolitical risk but vulnerable to domestic policy shifts.
Paychex, Inc.
- Broader international footprint exposes Paychex to geopolitical tensions, especially in Europe and India.
Which company shows a better risk-adjusted profile?
Paychex’s moderate leverage and diversified geographic presence create layered risks but offer growth potential. ADP’s stronger operational scale and lower market volatility anchor it with a steadier risk profile. However, ADP’s higher leverage and distress-zone Altman Z-score raise caution. Paychex’s grey-zone Z-score and average Piotroski score reflect healthier financial stability despite higher debt-to-assets. I see ADP’s debt load as the most impactful risk, while Paychex’s geopolitical exposure stands out. Overall, Paychex shows a better risk-adjusted profile, supported by a more favorable Altman Z-score and balanced operational risks.
Final Verdict: Which stock to choose?
Automatic Data Processing, Inc. (ADP) showcases a superpower in delivering exceptional capital efficiency, reflected in its robust and growing ROIC well above its cost of capital. This signals durable competitive advantage and consistent value creation. A point of vigilance is its moderate leverage and stretched valuation multiples. ADP fits well in aggressive growth portfolios seeking long-term value creators.
Paychex, Inc. (PAYX) stands out for its strategic moat built on strong recurring revenue and superior operating margins, offering a safety cushion compared to ADP. Despite a declining ROIC trend, PAYX maintains solid profitability and a more conservative balance sheet profile. It suits investors looking for GARP (Growth at a Reasonable Price) opportunities with a focus on income stability.
If you prioritize durable economic moats and capital efficiency, ADP is the compelling choice due to its expanding profitability and superior value creation. However, if you seek income stability and a strong recurring revenue base with a more conservative risk profile, PAYX offers better stability despite its ROIC headwinds. Both names warrant close monitoring of valuation and leverage metrics given current market conditions.
Disclaimer: Investment carries a risk of loss of initial capital. The past performance is not a reliable indicator of future results. Be sure to understand risks before making an investment decision.
Go Further
I encourage you to read the complete analyses of Automatic Data Processing, Inc. and Paychex, Inc. to enhance your investment decisions: