In the dynamic world of software applications, Autodesk, Inc. (ADSK) and Workday, Inc. (WDAY) stand out as prominent innovators shaping different yet overlapping segments of the industry. Autodesk excels in 3D design and engineering software, while Workday leads in enterprise cloud applications for finance and human capital management. This article explores both companies’ strategies and market positions to help you decide which could be the more compelling investment opportunity in 2026.

Table of contents
Companies Overview
I will begin the comparison between Autodesk and Workday by providing an overview of these two companies and their main differences.
Autodesk Overview
Autodesk, Inc. is a US-based technology company specializing in 3D design, engineering, and entertainment software and services. It offers products like AutoCAD, BIM 360, and Fusion 360 targeting professionals in architecture, engineering, construction, and manufacturing. With a market cap of 56.6B USD and about 15,300 employees, Autodesk focuses on delivering innovative tools for design, simulation, and collaboration worldwide.
Workday Overview
Workday, Inc. provides enterprise cloud applications aimed at financial and human capital management. Its software suite supports CFOs and HR teams in managing financial processes, employee lifecycle, and analytics across diverse industries. Headquartered in Pleasanton, California, Workday employs around 20,482 people and has a market cap near 49.9B USD, positioning itself as a key player in enterprise cloud software solutions.
Key similarities and differences
Both Autodesk and Workday operate in the software application industry with a focus on cloud-based solutions, serving professional and business clients globally. While Autodesk concentrates on 3D design and engineering software, Workday specializes in enterprise financial and human capital management applications. Their business models emphasize software innovation and customer-centric services but cater to distinct markets and use cases within the technology sector.
Income Statement Comparison
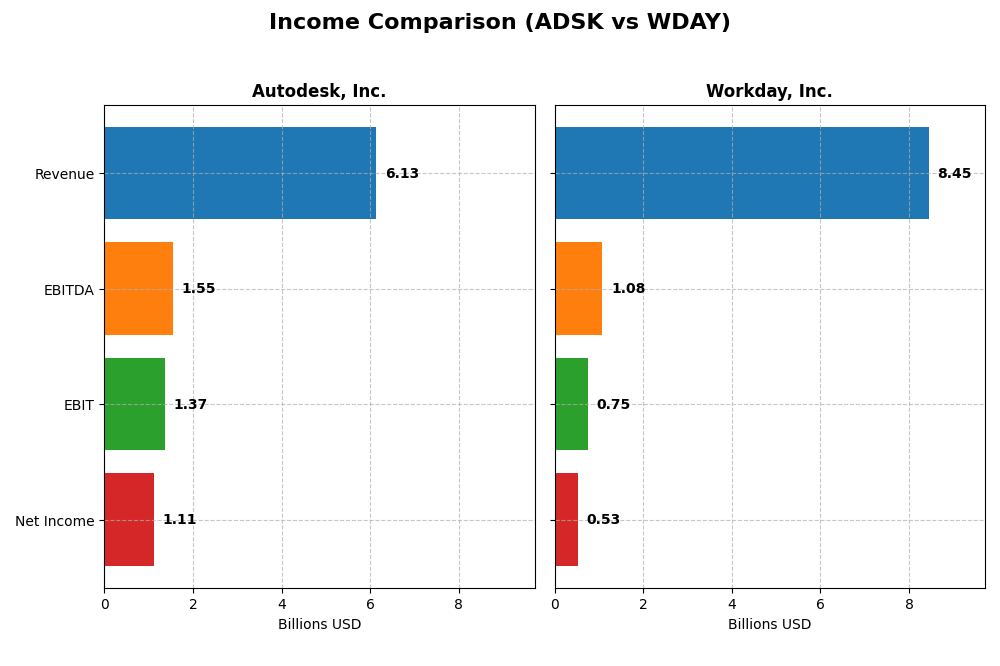
The table below compares the most recent fiscal year income statement figures for Autodesk, Inc. and Workday, Inc., highlighting key financial metrics to aid in analysis.
| Metric | Autodesk, Inc. (ADSK) | Workday, Inc. (WDAY) |
|---|---|---|
| Market Cap | 56.6B | 49.9B |
| Revenue | 6.13B | 8.45B |
| EBITDA | 1.55B | 1.08B |
| EBIT | 1.37B | 752M |
| Net Income | 1.11B | 526M |
| EPS | 5.17 | 1.98 |
| Fiscal Year | 2025 | 2025 |
Income Statement Interpretations
Autodesk, Inc.
Autodesk’s revenue rose steadily from $3.79B in 2021 to $6.13B in 2025, with net income fluctuating, peaking at $1.21B in 2021 and settling at $1.11B in 2025. Gross and EBIT margins remained strong and favorable, above 90% and 22%, respectively. The latest year saw a 12.7% revenue growth and 8.9% net margin improvement, signaling robust operational efficiency.
Workday, Inc.
Workday exhibited strong revenue growth, from $4.32B in 2021 to $8.45B in 2025, with net income turning positive after losses in 2021 and 2023, reaching $526M in 2025. Gross margin was favorable at 75.5%, but EBIT margin was only neutral at 8.9%. Despite a 16.35% revenue rise in 2025, net margin and EPS fell sharply, reflecting margin pressures.
Which one has the stronger fundamentals?
Both companies show favorable income statements overall, with Autodesk demonstrating higher and more stable margins, while Workday boasts stronger revenue and net income growth over the five-year period. Autodesk’s consistent profitability contrasts with Workday’s recent volatility in net margin and EPS, suggesting Autodesk has steadier earnings fundamentals, whereas Workday’s growth is more aggressive but less stable.
Financial Ratios Comparison
This table presents a side-by-side comparison of key financial ratios for Autodesk, Inc. and Workday, Inc. based on their most recent fiscal year data from 2025.
| Ratios | Autodesk, Inc. (ADSK) | Workday, Inc. (WDAY) |
|---|---|---|
| ROE | 42.4% | 5.8% |
| ROIC | 18.0% | 2.7% |
| P/E | 60.2 | 132.2 |
| P/B | 25.5 | 7.7 |
| Current Ratio | 0.68 | 1.85 |
| Quick Ratio | 0.68 | 1.85 |
| D/E (Debt-to-Equity) | 0.98 | 0.37 |
| Debt-to-Assets | 23.6% | 18.7% |
| Interest Coverage | 0 | 3.64 |
| Asset Turnover | 0.57 | 0.47 |
| Fixed Asset Turnover | 21.4 | 5.36 |
| Payout Ratio | 0 | 0 |
| Dividend Yield | 0% | 0% |
Interpretation of the Ratios
Autodesk, Inc.
Autodesk shows a mixed ratio profile with strong profitability indicators such as a 42.43% ROE and 18.14% net margin, yet faces challenges with liquidity, evidenced by a low current ratio of 0.68. Valuation ratios like P/E and P/B are high, posing potential concerns. Autodesk does not pay dividends, likely reinvesting earnings to support growth and innovation.
Workday, Inc.
Workday exhibits a neutral to weak financial ratio picture, with a modest net margin of 6.23% and a low 5.82% ROE, signaling limited profitability. Its liquidity is solid, with a current ratio of 1.85, and debt levels remain favorable. Workday also does not distribute dividends, reflecting a focus on reinvestment and expansion rather than shareholder payouts.
Which one has the best ratios?
Both Autodesk and Workday present a balanced number of favorable and unfavorable ratios, resulting in a neutral overall assessment. Autodesk excels in profitability but shows liquidity weaknesses, whereas Workday maintains stronger liquidity but struggles with profitability metrics. Neither company pays dividends, emphasizing growth and reinvestment strategies.
Strategic Positioning
This section compares the strategic positioning of Autodesk, Inc. and Workday, Inc., focusing on Market position, Key segments, and Exposure to technological disruption:
Autodesk, Inc.
- Market position and competitive pressure
- Key segments and business drivers
- Exposure to technological disruption
Workday, Inc.
- Market leader in 3D design software facing tech sector competition
- Diverse portfolio: Architecture, AutoCAD, Manufacturing, Media
- Moderate exposure via cloud-based construction and design tools
Autodesk, Inc. vs Workday, Inc. Positioning
Autodesk has a diversified business model across multiple design and engineering segments, providing varied revenue streams. Workday concentrates on cloud-based enterprise applications, driving growth through subscription and professional services with a narrower segment focus.
Which has the best competitive advantage?
Autodesk demonstrates a very favorable moat with strong ROIC exceeding WACC and growing profitability, indicating durable competitive advantages. Workday shows a slightly unfavorable moat as it currently destroys value despite improving profitability.
Stock Comparison
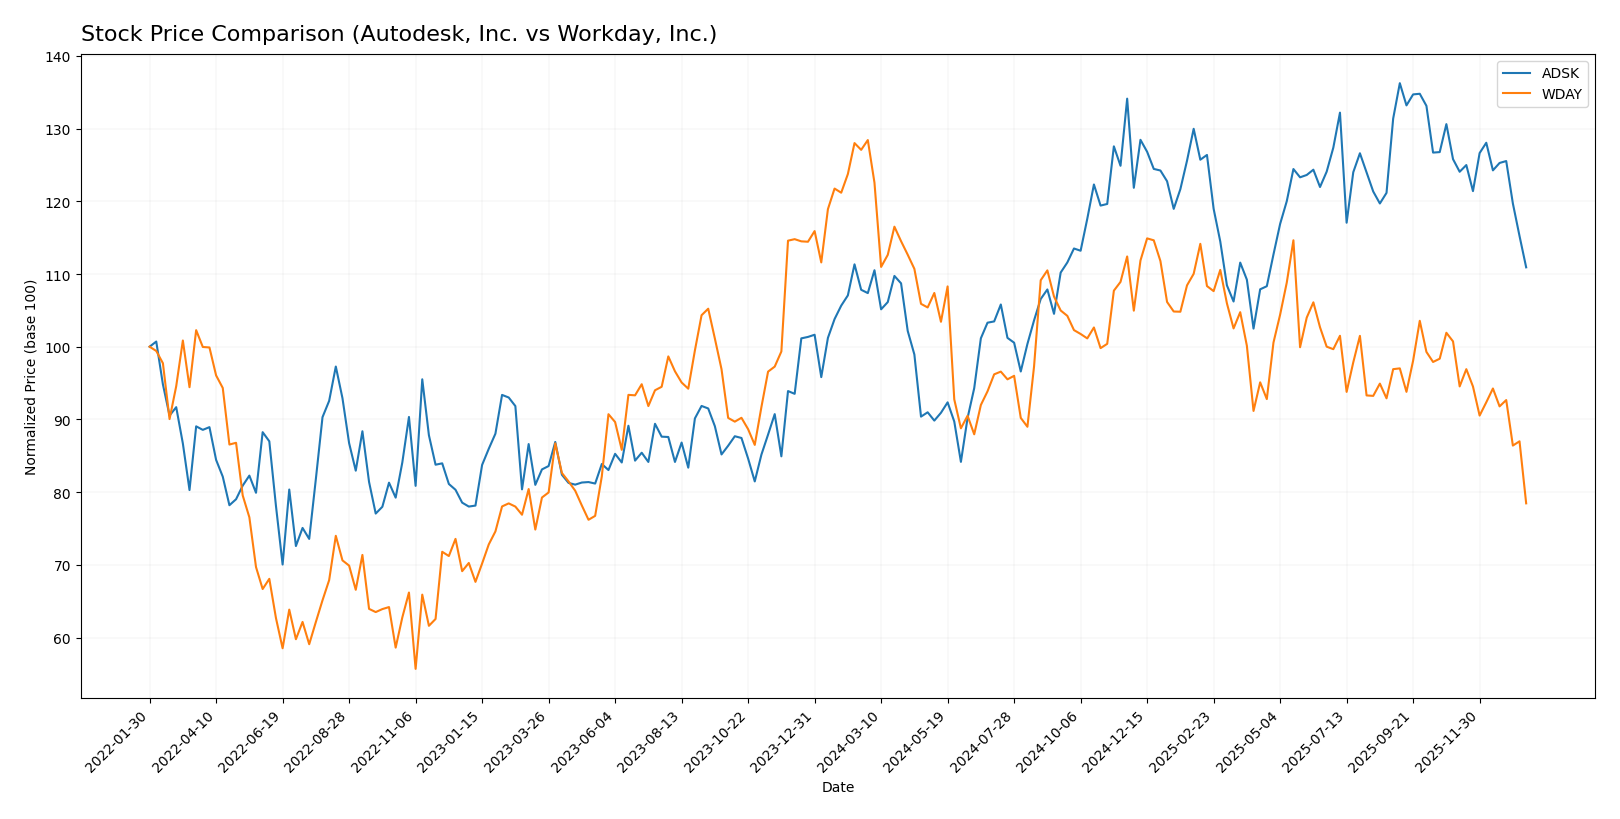
The stock prices of Autodesk, Inc. and Workday, Inc. over the past year reveal contrasting trajectories, with Autodesk showing modest gains amid decelerating momentum and Workday experiencing a sharp decline with persistent selling pressure.
Trend Analysis
Autodesk, Inc. (ADSK) exhibited a bullish trend over the past 12 months with a 3.3% price increase, despite deceleration in momentum. The stock price ranged from 201.6 to 326.37, showing moderate volatility with a 29.87 standard deviation.
Workday, Inc. (WDAY) followed a bearish trend with a 38.91% decline over the same period, also decelerating. The stock fluctuated between 186.86 and 305.88, with a 20.22 standard deviation reflecting substantial volatility.
Comparing both stocks, Autodesk delivered the highest market performance with a positive 3.3% gain, whereas Workday experienced a significant loss, indicating a clear divergence in their yearly stock trajectories.
Target Prices
The consensus target prices from verified analysts indicate promising upside potential for both Autodesk, Inc. and Workday, Inc.
| Company | Target High | Target Low | Consensus |
|---|---|---|---|
| Autodesk, Inc. | 400 | 343 | 373 |
| Workday, Inc. | 320 | 235 | 274.47 |
Analysts expect Autodesk’s shares to rise significantly from the current 265.69 USD, while Workday’s consensus target of 274.47 USD also suggests notable growth potential above its current price of 186.86 USD.
Analyst Opinions Comparison
This section compares analysts’ ratings and financial scores for Autodesk, Inc. and Workday, Inc.:
Rating Comparison
Autodesk, Inc. Rating
- Rating: Both companies have a B- rating, considered very favorable.
- Discounted Cash Flow Score: Moderate score of 3, indicating average valuation.
- ROE Score: Very favorable score of 5, showing strong profit generation from equity.
- ROA Score: Favorable score of 4, reflecting effective asset utilization.
- Debt To Equity Score: Very unfavorable score of 1, indicating high financial risk.
- Overall Score: Moderate score of 3, reflecting balanced financial standing.
Workday, Inc. Rating
- Rating: Both companies have a B- rating, considered very favorable.
- Discounted Cash Flow Score: Favorable score of 4, suggesting better valuation.
- ROE Score: Moderate score of 3, indicating average efficiency in using equity.
- ROA Score: Moderate score of 3, showing average asset use efficiency.
- Debt To Equity Score: Moderate score of 2, suggesting lower financial risk.
- Overall Score: Moderate score of 2, indicating slightly lower overall financial strength.
Which one is the best rated?
Autodesk and Workday share the same B- rating, but Autodesk scores higher on ROE and ROA, while Workday has better discounted cash flow and debt-to-equity scores. Overall, Autodesk holds a slightly higher overall score.
Scores Comparison
Here is a comparison of the Altman Z-Score and Piotroski Score for Autodesk, Inc. and Workday, Inc.:
Autodesk, Inc. Scores
- Altman Z-Score: 5.05, indicating a safe zone and low bankruptcy risk.
- Piotroski Score: 8, classified as very strong financial strength.
Workday, Inc. Scores
- Altman Z-Score: 4.41, indicating a safe zone and low bankruptcy risk.
- Piotroski Score: 6, classified as average financial strength.
Which company has the best scores?
Autodesk shows a higher Altman Z-Score and a stronger Piotroski Score than Workday. Both are in the safe zone, but Autodesk’s scores suggest better financial health based strictly on these metrics.
Grades Comparison
Here is a detailed comparison of the latest grades for Autodesk, Inc. and Workday, Inc.:
Autodesk, Inc. Grades
The table below shows recent grades assigned by major financial institutions for Autodesk, Inc.:
| Grading Company | Action | New Grade | Date |
|---|---|---|---|
| Barclays | Maintain | Overweight | 2025-11-26 |
| Wells Fargo | Maintain | Overweight | 2025-11-26 |
| Deutsche Bank | Upgrade | Buy | 2025-11-26 |
| B of A Securities | Maintain | Neutral | 2025-11-26 |
| Rosenblatt | Maintain | Buy | 2025-11-26 |
| Macquarie | Maintain | Outperform | 2025-11-26 |
| BMO Capital | Maintain | Market Perform | 2025-11-26 |
| Baird | Maintain | Outperform | 2025-11-26 |
Autodesk shows a generally positive trend in grades with multiple “Buy,” “Outperform,” and “Overweight” ratings maintained or upgraded on the latest dates.
Workday, Inc. Grades
The following table presents recent grades assigned to Workday, Inc. by reputable grading firms:
| Grading Company | Action | New Grade | Date |
|---|---|---|---|
| Barclays | Maintain | Overweight | 2026-01-12 |
| RBC Capital | Maintain | Outperform | 2026-01-05 |
| TD Cowen | Maintain | Buy | 2025-11-26 |
| DA Davidson | Maintain | Neutral | 2025-11-26 |
| Wells Fargo | Maintain | Overweight | 2025-11-26 |
| Barclays | Maintain | Overweight | 2025-11-26 |
| Keybanc | Maintain | Overweight | 2025-11-26 |
| Citigroup | Maintain | Neutral | 2025-11-26 |
| JP Morgan | Maintain | Overweight | 2025-11-26 |
| UBS | Maintain | Neutral | 2025-11-26 |
Workday maintains a strong consensus with several “Overweight,” “Outperform,” and “Buy” ratings consistently held across multiple firms.
Which company has the best grades?
Both Autodesk and Workday have predominantly positive grades, with consensus ratings classified as “Buy.” Workday, however, displays a higher number of “Overweight” and “Outperform” ratings, indicating stronger analyst confidence. This could translate to perceived better growth prospects or stability for investors compared to Autodesk.
Strengths and Weaknesses
Below is a comparison of key strengths and weaknesses for Autodesk, Inc. (ADSK) and Workday, Inc. (WDAY) based on their recent financial and operational data.
| Criterion | Autodesk, Inc. (ADSK) | Workday, Inc. (WDAY) |
|---|---|---|
| Diversification | Highly diversified across Architecture, Manufacturing, AutoCAD, Media & Entertainment; multiple revenue streams totaling over 6B USD in 2025 | Primarily focused on Subscription Services (~7.7B USD) with smaller Professional Services segment; less diversified |
| Profitability | Strong profitability with 18.14% net margin and 42.43% ROE; ROIC at 18.01% well above WACC indicating value creation | Modest profitability: 6.23% net margin, 5.82% ROE; ROIC at 2.73% below WACC, indicating value destruction despite growth |
| Innovation | Sustained innovation with growing ROIC (+15.4% trend) and very favorable economic moat; strong product portfolio | Innovation reflected in rapidly improving ROIC (+161.9% trend) but still slightly unfavorable moat; profitability challenges remain |
| Global presence | Strong global presence supported by diversified markets and product lines | Global SaaS provider with subscription-based model, expanding market but concentrated in fewer segments |
| Market Share | Leading market positions in CAD, AEC, and manufacturing software segments | Leading in cloud-based HR and finance software with growing subscription base but higher competition and valuation risks |
Key takeaways: Autodesk demonstrates a solid competitive moat with diversified revenue and strong profitability, making it a more stable investment option. Workday shows promising growth and innovation but struggles with profitability and value creation, suggesting higher risk for investors.
Risk Analysis
Below is a summary table highlighting key risks for Autodesk, Inc. (ADSK) and Workday, Inc. (WDAY) as of the most recent fiscal year 2025.
| Metric | Autodesk, Inc. (ADSK) | Workday, Inc. (WDAY) |
|---|---|---|
| Market Risk | High beta (1.47), high P/E (60.2) and P/B (25.5) indicating valuation sensitivity | Moderate beta (1.14), very high P/E (132.1) and elevated P/B (7.7) show valuation risk |
| Debt level | Moderate debt-to-assets at 23.6%, debt/equity neutral at 0.98 | Low debt-to-assets at 18.7%, debt/equity favorable at 0.37 |
| Regulatory Risk | Moderate, typical for technology/software industry | Moderate, with global cloud compliance challenges |
| Operational Risk | Dependence on innovation in CAD and 3D software markets | Reliance on cloud infrastructure and enterprise adoption |
| Environmental Risk | Low, primarily software business with limited physical footprint | Low, software company with limited direct environmental impact |
| Geopolitical Risk | Moderate, exposure to global markets and supply chain | Moderate, global client base with potential geopolitical disruptions |
In synthesis, Autodesk’s higher market risk from valuation and beta, combined with moderate debt levels, poses a notable risk if market conditions worsen. Workday faces significant valuation risk due to very high P/E but benefits from stronger balance sheet metrics and operational resilience in cloud services. Both companies operate in regulated environments with moderate geopolitical exposure, but their software-centric models limit environmental risks. Investors should weigh valuation concerns heavily while monitoring operational execution and market volatility.
Which Stock to Choose?
Autodesk, Inc. (ADSK) shows a favorable income evolution with a 12.7% revenue growth in 2025 and strong profitability metrics, including an 18.14% net margin and a 42.43% ROE. Its debt level is moderate, supported by a net debt to EBITDA of 0.62, and the company is rated very favorably with a B- score, reflecting solid financial health despite some unfavorable valuation ratios.
Workday, Inc. (WDAY) records a higher 16.35% revenue growth in 2025 but lower profitability, with a 6.23% net margin and a 5.82% ROE. The company carries higher leverage with a net debt to EBITDA of 1.69, yet it maintains a very favorable B- rating. Its income statement is positive overall, although some financial ratios indicate challenges in efficiency and valuation.
For investors prioritizing durable competitive advantages and profitability, Autodesk’s very favorable moat status and superior returns might appear more attractive. Conversely, those focusing on revenue growth and improving profitability trends could find Workday’s profile suggestive of potential, albeit with higher risk due to leverage and lower margins.
Disclaimer: Investment carries a risk of loss of initial capital. The past performance is not a reliable indicator of future results. Be sure to understand risks before making an investment decision.
Go Further
I encourage you to read the complete analyses of Autodesk, Inc. and Workday, Inc. to enhance your investment decisions: