Autodesk, Inc. and Unity Software Inc. are two leading players in the software application industry, each driving innovation in 3D design and real-time content creation. Autodesk excels in professional 3D design and engineering software, while Unity focuses on interactive, real-time 3D content platforms for diverse devices. This comparison explores their market overlap, innovation strategies, and growth potential to help you identify the most compelling investment opportunity.
Table of contents
Companies Overview
I will begin the comparison between Autodesk, Inc. and Unity Software Inc. by providing an overview of these two companies and their main differences.
Autodesk Overview
Autodesk, Inc. develops 3D design, engineering, and entertainment software and services globally. Its products include AutoCAD Civil 3D for civil engineering, BIM 360 cloud-based construction management, and Fusion 360 for 3D CAD and computer-aided engineering. Serving architecture, engineering, construction, manufacturing, and media industries, Autodesk supports professionals with a broad software portfolio. Founded in 1982, it is headquartered in San Rafael, California, with a market cap of $56.6B.
Unity Overview
Unity Software Inc. provides an interactive real-time 3D content platform for creating, running, and monetizing 2D and 3D content across devices such as mobiles, PCs, consoles, and AR/VR. Established in 2004 and based in San Francisco, it targets content creators including developers, artists, and architects. Unity distributes its products through online stores and resellers globally. The company has a market cap of $17.5B and offers solutions primarily for real-time interactive experiences.
Key similarities and differences
Both Autodesk and Unity operate in the software application industry, focusing on 3D content creation tools for professionals and creatives. However, Autodesk emphasizes engineering, construction, and manufacturing sectors with comprehensive design and management software, while Unity specializes in real-time 3D content for gaming and interactive media across multiple platforms. Autodesk is significantly larger by market cap and employee count, reflecting its broader industrial applications compared to Unity’s focus on entertainment and interactive experiences.
Income Statement Comparison
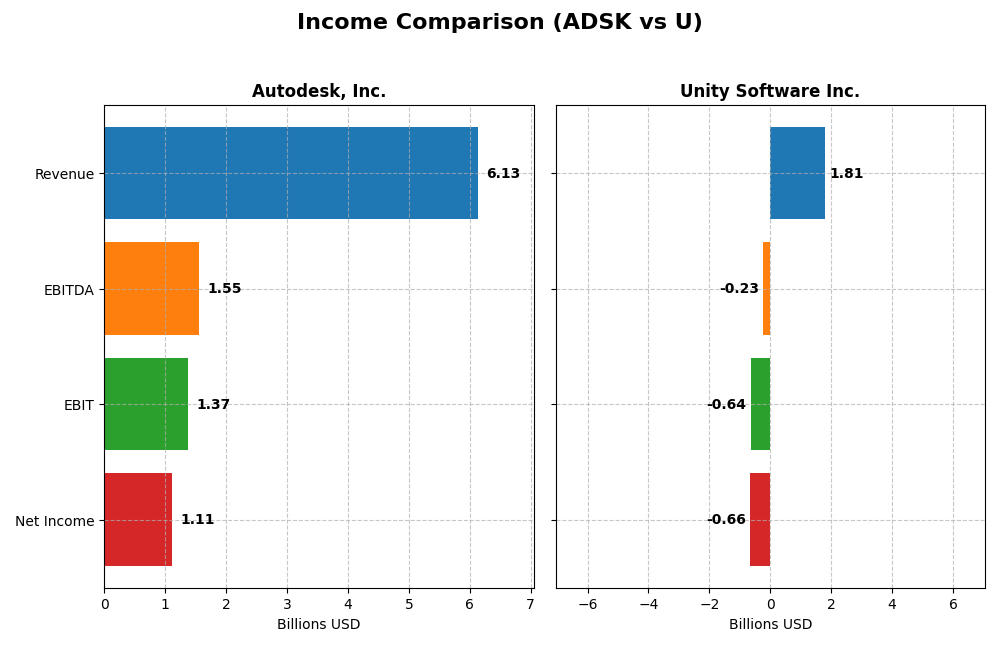
The table below compares key income statement metrics for Autodesk, Inc. and Unity Software Inc. for their most recent fiscal years, highlighting their financial performance side by side.
| Metric | Autodesk, Inc. (ADSK) | Unity Software Inc. (U) |
|---|---|---|
| Market Cap | 56.6B | 17.5B |
| Revenue | 6.13B | 1.81B |
| EBITDA | 1.55B | -235M |
| EBIT | 1.37B | -644M |
| Net Income | 1.11B | -664M |
| EPS | 5.17 | -1.68 |
| Fiscal Year | 2025 | 2024 |
Income Statement Interpretations
Autodesk, Inc.
From 2021 to 2025, Autodesk, Inc. demonstrated steady revenue growth, reaching $6.13B in 2025, with gross margins consistently strong at around 90.57%. Despite a slight decline in net income growth over the entire period, net income for 2025 rose favorably to $1.11B. Margins improved, with the net margin at 18.14%, indicating solid profitability and operational efficiency in the most recent year.
Unity Software Inc.
Unity Software’s revenue grew significantly over the 2020-2024 period, peaking at $1.81B in 2024, but declined 17.1% from 2023 to 2024. Gross margin remained favorable at 73.48%, yet the company continued to report negative EBIT and net margins, reflecting ongoing losses. The 2024 net loss narrowed to $664M, showing some improvement, yet profitability remains elusive.
Which one has the stronger fundamentals?
Autodesk shows stronger fundamentals with favorable revenue growth, high gross and net margins, and positive net income despite some long-term margin pressure. Unity, while growing revenue overall, struggles with persistent losses and negative margins, though recent improvements in EPS and EBIT growth suggest potential. Autodesk’s consistent profitability and margin strength clearly outweigh Unity’s ongoing challenges.
Financial Ratios Comparison
The table below presents a side-by-side comparison of key financial ratios for Autodesk, Inc. and Unity Software Inc. based on the most recent fiscal year data available.
| Ratios | Autodesk, Inc. (ADSK) | Unity Software Inc. (U) |
|---|---|---|
| ROE | 42.4% | -20.8% |
| ROIC | 18.0% | -12.8% |
| P/E | 60.2 | -13.4 |
| P/B | 25.5 | 2.79 |
| Current Ratio | 0.68 | 2.50 |
| Quick Ratio | 0.68 | 2.50 |
| D/E | 0.98 | 0.74 |
| Debt-to-Assets | 23.6% | 34.9% |
| Interest Coverage | 0 | -32.1 |
| Asset Turnover | 0.57 | 0.27 |
| Fixed Asset Turnover | 21.4 | 18.3 |
| Payout ratio | 0 | 0 |
| Dividend yield | 0 | 0 |
Interpretation of the Ratios
Autodesk, Inc.
Autodesk shows strong profitability with a net margin of 18.14%, ROE at 42.43%, and ROIC of 18.01%, though valuation ratios like PE at 60.2 and PB at 25.54 appear stretched. Liquidity ratios are weak, with a current ratio of 0.68, signaling potential short-term risk. The company does not pay dividends, likely prioritizing reinvestment and growth.
Unity Software Inc.
Unity displays weak profitability, with a net margin of -36.63%, negative ROE at -20.81%, and negative ROIC at -12.78%. Liquidity is strong, supported by a current ratio of 2.5, but asset turnover is low at 0.27. It does not pay dividends, reflecting ongoing investment in R&D and growth during its unprofitable phase without share buybacks.
Which one has the best ratios?
Autodesk holds a neutral overall ratio profile with strong profitability and some valuation concerns, while Unity’s ratios are more unfavorable due to losses and negative returns despite better liquidity. Based on these evaluations, Autodesk presents a more balanced financial position compared to Unity’s challenges in profitability and cash flow.
Strategic Positioning
This section compares the strategic positioning of Autodesk, Inc. and Unity Software Inc., focusing on Market position, Key segments, and Exposure to technological disruption:
Autodesk, Inc.
- Established market leader in 3D design software with significant competitive pressure.
- Diversified key segments: Architecture, Engineering, Construction, Manufacturing, Media and Entertainment.
- Moderate exposure through cloud-based software and evolving design technologies.
Unity Software Inc.
- Growing player in real-time 3D content platform with high competitive volatility.
- Concentrated in Create and Operate solutions for interactive 2D and 3D content creation.
- High exposure driven by real-time 3D, AR, VR, and interactive content demands.
Autodesk, Inc. vs Unity Software Inc. Positioning
Autodesk shows a diversified business model across multiple industries with stable market presence, while Unity focuses on interactive real-time content platforms in fewer segments. Autodesk benefits from broad industry applications; Unity faces higher market volatility and technological shifts.
Which has the best competitive advantage?
Autodesk holds a very favorable moat with growing ROIC well above WACC, indicating durable competitive advantage and value creation. Unity has a very unfavorable moat with declining ROIC below WACC, signaling value destruction and weaker competitive positioning.
Stock Comparison
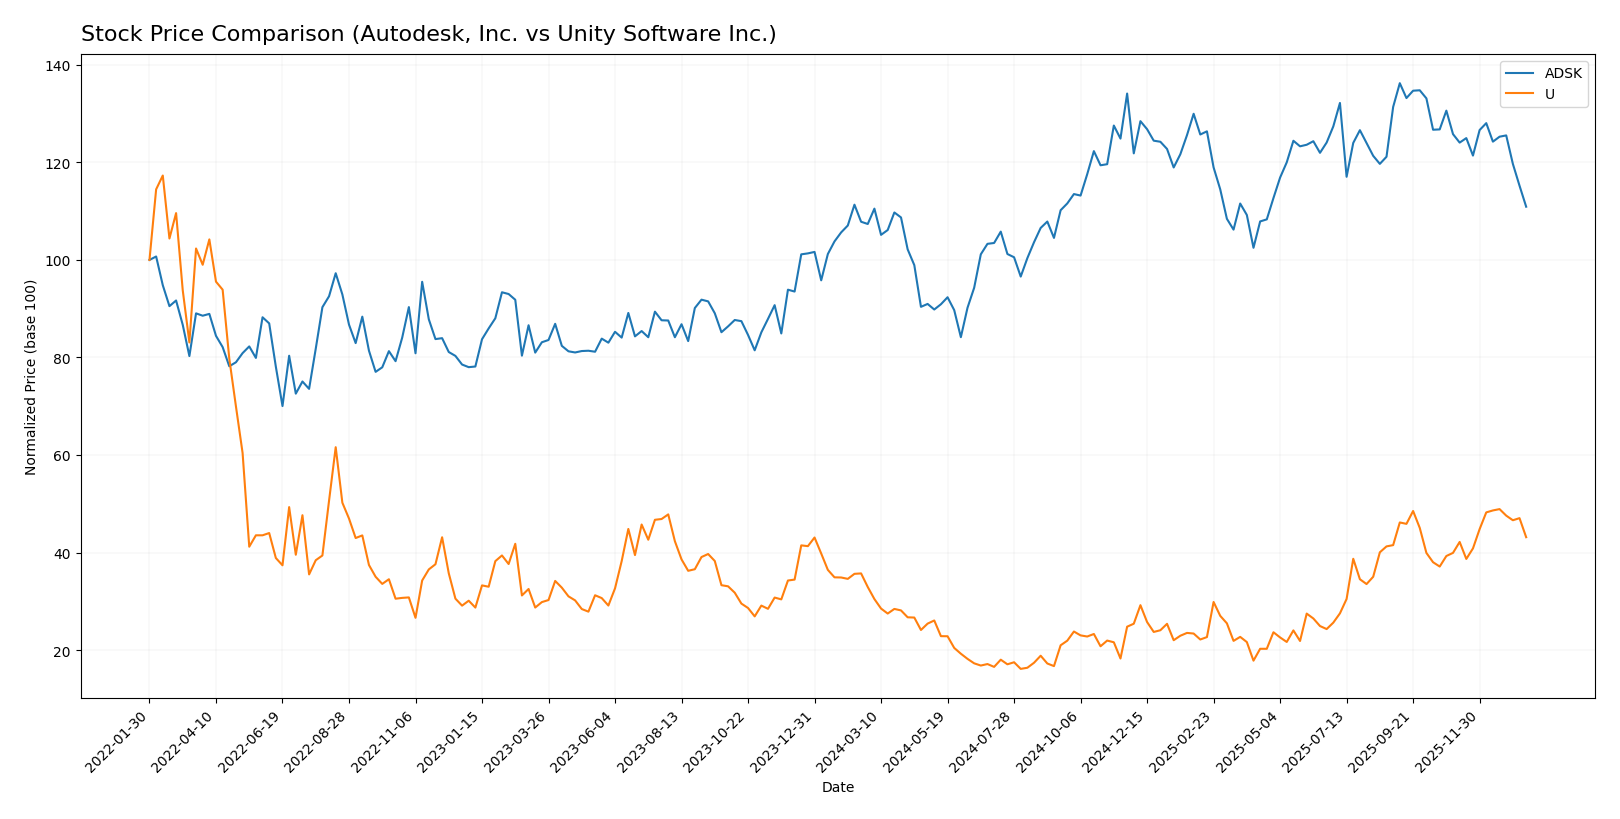
The stock price movements over the past year reveal contrasting dynamics, with Autodesk, Inc. showing a modest bullish trend with deceleration, while Unity Software Inc. exhibits a strong accelerating bullish trend and higher relative gains.
Trend Analysis
Autodesk, Inc. (ADSK) recorded a 3.3% price increase over the past 12 months, indicating a bullish trend with deceleration. The stock experienced a high of 326.37 and a low of 201.6, and recent weeks show a short-term decline of -11.83%.
Unity Software Inc. (U) showed a robust 31.0% price increase over the same period, confirming a bullish trend with acceleration. Its price ranged from 15.32 to 46.42, and recent data indicate continued positive momentum with an 8.05% gain.
Comparing both, Unity Software has delivered the highest market performance, outpacing Autodesk significantly in price appreciation and recent trading momentum.
Target Prices
The current analyst consensus for Autodesk, Inc. and Unity Software Inc. reflects moderate to strong upside potential.
| Company | Target High | Target Low | Consensus |
|---|---|---|---|
| Autodesk, Inc. | 400 | 343 | 373 |
| Unity Software Inc. | 60 | 39 | 50.98 |
Autodesk’s target consensus at 373 is significantly above its current price of 265.69, indicating expected growth. Unity’s consensus target of 50.98 also exceeds its current price of 40.95, suggesting analyst optimism despite recent volatility.
Analyst Opinions Comparison
This section compares analysts’ ratings and grades for Autodesk, Inc. and Unity Software Inc.:
Rating Comparison
Autodesk, Inc. Rating
- Rating: B-, considered very favorable
- Discounted Cash Flow Score: 3, moderate valuation
- ROE Score: 5, very favorable
- ROA Score: 4, favorable
- Debt To Equity Score: 1, very unfavorable
- Overall Score: 3, moderate
Unity Software Inc. Rating
- Rating: D+, considered very unfavorable
- Discounted Cash Flow Score: 1, very unfavorable
- ROE Score: 1, very unfavorable
- ROA Score: 1, very unfavorable
- Debt To Equity Score: 1, very unfavorable
- Overall Score: 1, very unfavorable
Which one is the best rated?
Based strictly on the provided data, Autodesk, Inc. holds superior ratings with a B- and notably higher scores in discounted cash flow, ROE, ROA, and overall score. Unity Software Inc. scores uniformly low with a D+ rating and very unfavorable scores.
Scores Comparison
The scores comparison between Autodesk, Inc. and Unity Software Inc. highlights their financial stability and strength:
Autodesk, Inc. Scores
- Altman Z-Score: 5.05, in the safe zone, indicating low bankruptcy risk.
- Piotroski Score: 8, very strong financial health and value potential.
Unity Software Inc. Scores
- Altman Z-Score: 2.93, in the grey zone, indicating moderate bankruptcy risk.
- Piotroski Score: 4, average financial health and value potential.
Which company has the best scores?
Autodesk, Inc. shows a higher Altman Z-Score in the safe zone and a very strong Piotroski Score, whereas Unity Software’s scores reflect moderate financial risk and average strength. Autodesk, Inc. holds the superior scores based strictly on the provided data.
Grades Comparison
Here is the comparison of recent grades and ratings from recognized financial institutions for both companies:
Autodesk, Inc. Grades
This table summarizes the latest grades and rating changes from major grading companies for Autodesk, Inc.:
| Grading Company | Action | New Grade | Date |
|---|---|---|---|
| Barclays | Maintain | Overweight | 2025-11-26 |
| Wells Fargo | Maintain | Overweight | 2025-11-26 |
| Deutsche Bank | Upgrade | Buy | 2025-11-26 |
| B of A Securities | Maintain | Neutral | 2025-11-26 |
| Rosenblatt | Maintain | Buy | 2025-11-26 |
| Macquarie | Maintain | Outperform | 2025-11-26 |
| BMO Capital | Maintain | Market Perform | 2025-11-26 |
| Baird | Maintain | Outperform | 2025-11-26 |
| Rosenblatt | Maintain | Buy | 2025-11-24 |
| Baird | Maintain | Outperform | 2025-11-18 |
Autodesk’s grades show a generally positive outlook, with multiple buy and outperform ratings and only a few neutral or market perform grades.
Unity Software Inc. Grades
Below are the recent grades and rating updates from key grading firms for Unity Software Inc.:
| Grading Company | Action | New Grade | Date |
|---|---|---|---|
| Morgan Stanley | Maintain | Overweight | 2026-01-13 |
| Goldman Sachs | Maintain | Neutral | 2026-01-13 |
| Wells Fargo | Maintain | Overweight | 2026-01-08 |
| Jefferies | Maintain | Buy | 2026-01-05 |
| Piper Sandler | Upgrade | Overweight | 2025-12-11 |
| BTIG | Upgrade | Buy | 2025-12-11 |
| Wells Fargo | Upgrade | Overweight | 2025-12-05 |
| Arete Research | Upgrade | Buy | 2025-12-01 |
| Citigroup | Maintain | Buy | 2025-11-11 |
| Wells Fargo | Maintain | Equal Weight | 2025-11-07 |
Unity’s grades reveal an improving trend with several recent upgrades to buy and overweight ratings, indicating growing analyst confidence.
Which company has the best grades?
Both Autodesk and Unity have a consensus “Buy” rating, but Autodesk shows a stronger presence of outperform and buy grades among established firms, while Unity has more recent upgrades reflecting momentum. Investors may observe Autodesk’s consistent positive ratings versus Unity’s improving outlook.
Strengths and Weaknesses
Below is a comparison of key strengths and weaknesses for Autodesk, Inc. (ADSK) and Unity Software Inc. (U), based on the most recent financial and strategic data.
| Criterion | Autodesk, Inc. (ADSK) | Unity Software Inc. (U) |
|---|---|---|
| Diversification | Highly diversified revenue streams across Architecture, Manufacturing, Media, and AutoCAD products with steady growth. | Moderate diversification with Create and Operate Solutions; however, revenue is more concentrated and volatile. |
| Profitability | Strong profitability with 18.14% net margin and 42.43% ROE; creates significant shareholder value. | Negative profitability with -36.63% net margin and -20.81% ROE; currently shedding value. |
| Innovation | Consistently growing ROIC (+15.4%) indicates effective innovation and capital use. | Declining ROIC (-2%) and negative returns suggest struggles in innovation efficiency. |
| Global presence | Established global footprint in multiple industries with durable competitive advantage. | Growing presence but less established; competitive pressures remain high. |
| Market Share | Strong market share in engineering and construction software segments. | Emerging market share in gaming and real-time 3D sectors but challenged by competitors. |
Key takeaway: Autodesk demonstrates a robust and durable competitive position with solid profitability and diversified revenue, making it a safer choice for investors. Unity faces significant profitability challenges and value erosion, indicating higher risk and need for cautious investment consideration.
Risk Analysis
Below is a comparison table highlighting key risk factors for Autodesk, Inc. (ADSK) and Unity Software Inc. (U) based on the most recent available data:
| Metric | Autodesk, Inc. (ADSK) | Unity Software Inc. (U) |
|---|---|---|
| Market Risk | Beta 1.47 – moderately volatile | Beta 2.05 – high volatility |
| Debt level | Debt-to-Equity ~0.98 – moderate | Debt-to-Equity ~0.74 – moderate |
| Regulatory Risk | Moderate – global software sector | Moderate – tech and platform regulation |
| Operational Risk | Moderate – reliance on product innovation | Elevated – negative margins, losses |
| Environmental Risk | Low – software industry | Low – software industry |
| Geopolitical Risk | Moderate – global sales exposure | Moderate – global sales exposure |
Synthesizing these risks: Unity’s high market volatility and operational losses present the most impactful concerns, notably reflected in its negative profitability and weaker financial stability. Autodesk shows more financial resilience with favorable profitability and strong bankruptcy safety scores, though it faces typical tech sector market and regulatory risks. Investors should weigh Unity’s growth potential against its elevated financial and operational risks, while Autodesk appears more stable but with valuation concerns.
Which Stock to Choose?
Autodesk, Inc. (ADSK) shows a favorable income evolution with a 12.7% revenue growth in 2025 and strong profitability metrics, including an 18.14% net margin and a 42.43% ROE. Its debt level is moderate with a net debt to EBITDA ratio of 0.62, and the company holds a very favorable overall rating of B-.
Unity Software Inc. (U) experienced a decline in revenue by 17.1% in 2024 and suffers from negative profitability, with a -36.63% net margin and -20.81% ROE. The company maintains a strong liquidity position with a current ratio of 2.5, but its overall financial ratios are slightly unfavorable. Its rating stands at a very unfavorable D+.
Investors focused on durable value creation and profitability might find Autodesk’s very favorable moat and strong rating more aligned with a quality investing profile, while those with a higher risk tolerance and seeking potential growth in a volatile environment might view Unity’s accelerating price trend as a speculative opportunity.
Disclaimer: Investment carries a risk of loss of initial capital. The past performance is not a reliable indicator of future results. Be sure to understand risks before making an investment decision.
Go Further
I encourage you to read the complete analyses of Autodesk, Inc. and Unity Software Inc. to enhance your investment decisions: