In today’s fast-evolving technology landscape, Uber Technologies, Inc. and Autodesk, Inc. stand out as innovative leaders within the software application industry. Uber revolutionizes mobility and delivery services through extensive platform integration, while Autodesk transforms design and engineering with its advanced 3D software solutions. Both companies push boundaries in their respective markets, making them compelling candidates for investment analysis. Join me as we explore which company presents the most attractive opportunity for your portfolio.
Table of contents
Companies Overview
I will begin the comparison between Uber Technologies, Inc. and Autodesk, Inc. by providing an overview of these two companies and their main differences.
Uber Technologies, Inc. Overview
Uber Technologies, Inc. develops and operates proprietary technology platforms that connect consumers with independent providers for ride-sharing, delivery, and freight services across multiple continents. Its business spans three segments: Mobility, Delivery, and Freight, offering a broad range of transportation and logistics solutions. Founded in 2009 and headquartered in San Francisco, Uber focuses on leveraging technology to connect riders, drivers, and delivery providers globally.
Autodesk, Inc. Overview
Autodesk, Inc. is a software company specializing in 3D design, engineering, and entertainment software solutions. Its portfolio includes products for civil engineering, construction management, manufacturing, and media production, serving professionals worldwide. Founded in 1982 and headquartered in San Rafael, Autodesk sells directly and through resellers, aiming to streamline design and collaboration processes across multiple industries with cloud and desktop software tools.
Key similarities and differences
Both Uber and Autodesk operate in the technology sector and provide software solutions, but their business models differ significantly. Uber focuses on platform-based services connecting consumers with independent providers in transportation and delivery, emphasizing mobility and logistics. In contrast, Autodesk develops and sells specialized software products for design and engineering professionals, focusing on digital creation and collaboration tools rather than consumer services.
Income Statement Comparison
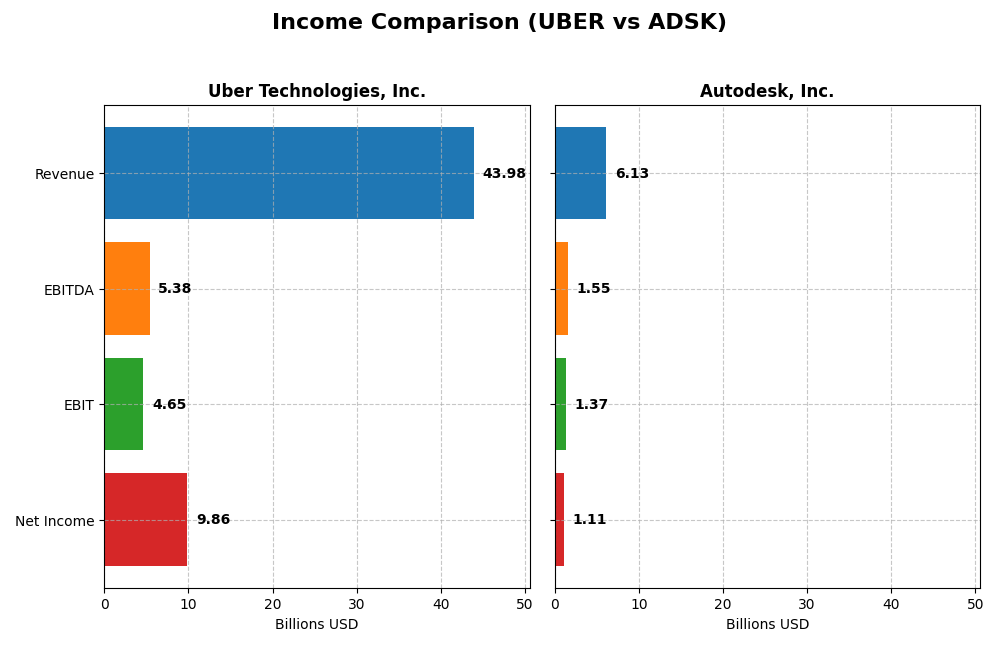
The table below presents a side-by-side comparison of key income statement metrics for Uber Technologies, Inc. and Autodesk, Inc., using their most recent fiscal year data.
| Metric | Uber Technologies, Inc. | Autodesk, Inc. |
|---|---|---|
| Market Cap | 176.3B | 56.6B |
| Revenue | 43.98B | 6.13B |
| EBITDA | 5.39B | 1.55B |
| EBIT | 4.65B | 1.37B |
| Net Income | 9.86B | 1.11B |
| EPS | 4.71 | 5.17 |
| Fiscal Year | 2024 | 2025 |
Income Statement Interpretations
Uber Technologies, Inc.
Uber demonstrated strong revenue growth from 2020 to 2024, surging from $11.1B to $44.0B. Net income reversed dramatically from -$6.8B in 2020 to nearly $9.9B in 2024, reflecting robust margin improvements. The 2024 fiscal year showed a favorable 18% revenue increase and a remarkable net margin expansion to 22.4%, signaling enhanced profitability and operational efficiency.
Autodesk, Inc.
Autodesk’s revenue steadily increased over 2021-2025, reaching $6.1B in 2025, with a 12.7% rise from 2024. Net income grew modestly in the latest year to $1.1B but declined overall compared to earlier years. Gross and EBIT margins remain strong at 90.6% and 22.3%, respectively, though net margin growth over the full period was negative, indicating some margin pressure despite steady top-line gains.
Which one has the stronger fundamentals?
Uber exhibits stronger fundamentals with consistent, substantial growth in revenue, net income, and margins over the period, supported by favorable income statement metrics across the board. Autodesk maintains high margins and steady revenue growth but faced unfavorable trends in net income and margin growth overall. Uber’s dynamic recovery and margin expansion outweigh Autodesk’s more moderate improvements.
Financial Ratios Comparison
The table below presents a side-by-side comparison of key financial ratios for Uber Technologies, Inc. and Autodesk, Inc. based on their most recent fiscal year data.
| Ratios | Uber Technologies, Inc. (2024) | Autodesk, Inc. (2025) |
|---|---|---|
| ROE | 45.7% | 42.4% |
| ROIC | 6.8% | 18.0% |
| P/E | 12.8 | 60.2 |
| P/B | 5.86 | 25.5 |
| Current Ratio | 1.07 | 0.68 |
| Quick Ratio | 1.07 | 0.68 |
| D/E | 0.53 | 0.98 |
| Debt-to-Assets | 22.3% | 23.6% |
| Interest Coverage | 5.35 | 0 |
| Asset Turnover | 0.86 | 0.57 |
| Fixed Asset Turnover | 14.14 | 21.44 |
| Payout Ratio | 0 | 0 |
| Dividend Yield | 0 | 0 |
Interpretation of the Ratios
Uber Technologies, Inc.
Uber shows a balanced mix of strong and neutral ratios with a favorable net margin of 22.41% and a very high return on equity at 45.72%, which indicates efficient profit generation. Its price-to-earnings ratio of 12.82 is attractive, though the price-to-book ratio of 5.86 raises some valuation concerns. The company does not pay dividends, reflecting a reinvestment strategy likely aimed at growth and innovation.
Autodesk, Inc.
Autodesk presents strong profitability with a favorable net margin of 18.14% and return on equity of 42.43%, supported by a robust return on invested capital at 18.01%. However, its valuation ratios such as PE of 60.2 and PB of 25.54 are quite high, and liquidity ratios below 1 signal potential short-term risk. Like Uber, Autodesk does not pay dividends, indicating a focus on reinvesting earnings to fuel expansion.
Which one has the best ratios?
Uber’s ratios are slightly favorable overall, balancing profitability and valuation with moderate leverage and liquidity, while Autodesk shows strong profitability but weaker liquidity and higher valuation concerns. Given these mixed signals, Uber’s more conservative valuation and balanced ratio profile may be seen as more stable, whereas Autodesk carries higher risk with its elevated multiples and liquidity challenges.
Strategic Positioning
This section compares the strategic positioning of Uber and Autodesk, including Market position, Key segments, and exposure to disruption:
Uber
- Leading global platform in ridesharing, delivery, and freight with high competition pressure.
- Operates in Mobility, Delivery, and Freight segments, driven by technology platforms connecting consumers and providers worldwide.
- Faces disruption risks from evolving mobility technology and logistics innovation but with growing profitability.
Autodesk
- Specialized software provider in 3D design and engineering with niche market focus.
- Key segments include Architecture, Engineering, Construction, Manufacturing, and Media with diversified software products.
- Exposed to software innovation and cloud-based solutions with steady growth in return on capital.
Uber vs Autodesk Positioning
Uber’s strategy is broadly diversified across mobility, delivery, and freight, leveraging large-scale platform operations. Autodesk focuses on concentrated software markets with specialized products. Uber’s scale offers broad market reach but faces intense competition, while Autodesk’s niche focus supports stable value creation.
Which has the best competitive advantage?
Autodesk demonstrates a strong economic moat with ROIC exceeding WACC and growing profitability, indicating durable competitive advantage. Uber shows slightly unfavorable moat status, shedding value despite improving ROIC, suggesting weaker competitive positioning.
Stock Comparison
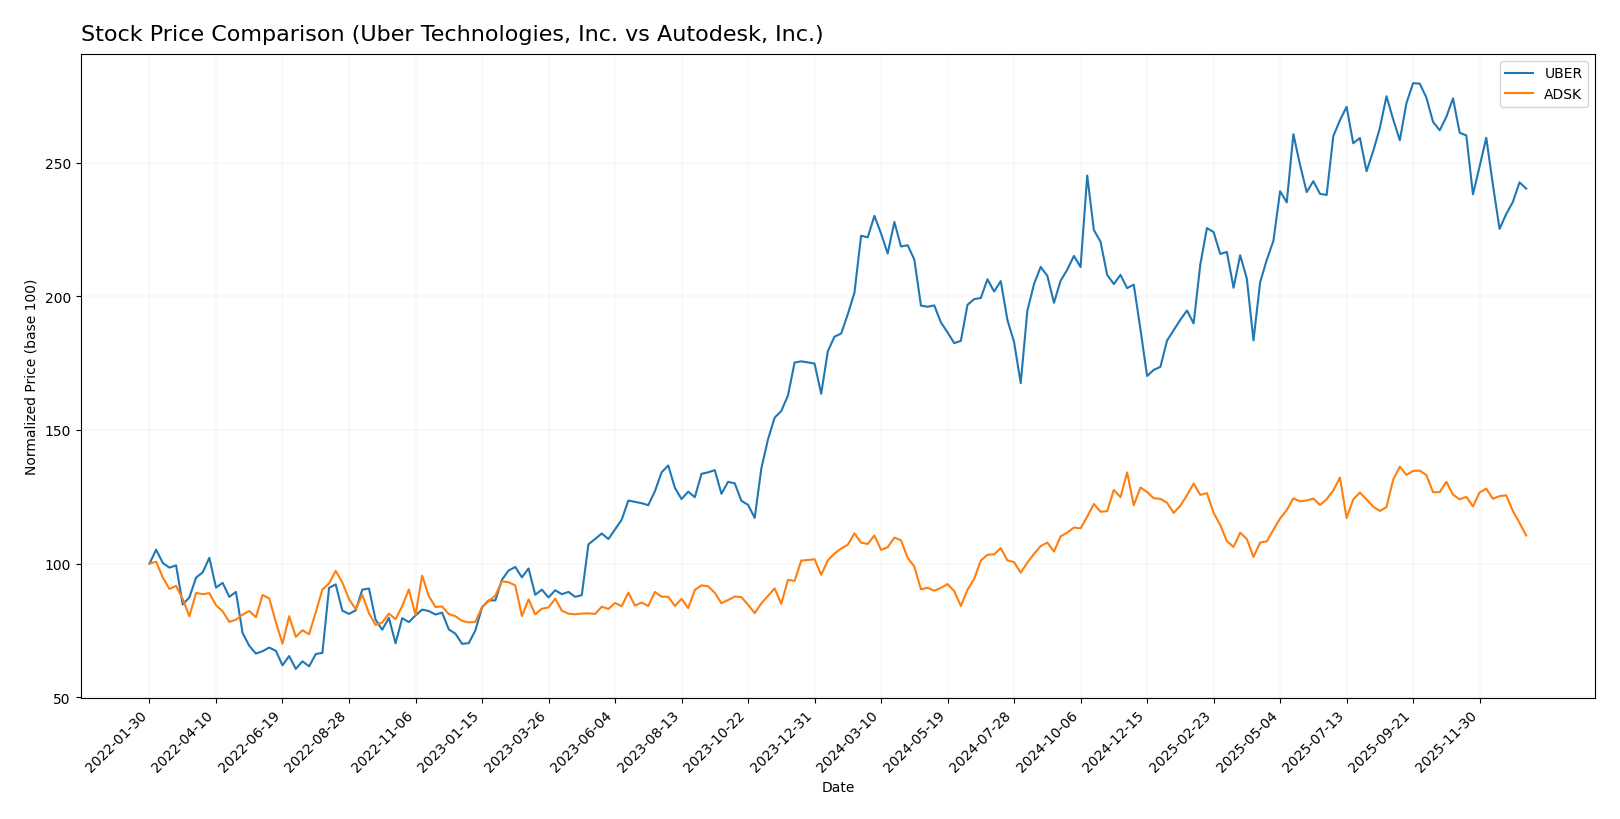
The stock price chart illustrates notable bullish trends with deceleration for both Uber Technologies, Inc. and Autodesk, Inc. over the past 12 months, despite recent price declines in the last quarter.
Trend Analysis
Uber Technologies, Inc. showed an 8.21% price increase over the past year, indicating a bullish trend with deceleration and a price range between 58.99 and 98.51. Recent months reveal a -12.31% decline with reduced volatility.
Autodesk, Inc. recorded a 2.93% price increase over the same period, also bullish with deceleration, but with higher volatility and a price range from 201.6 to 326.37. Recent trends show a -12.15% drop and increased volatility.
Comparing both stocks, Uber delivered the highest market performance over the past year, outperforming Autodesk in total price appreciation despite both facing recent downward trends.
Target Prices
The current analyst consensus target prices for Uber Technologies, Inc. and Autodesk, Inc. indicate optimistic potential upside compared to their current market prices.
| Company | Target High | Target Low | Consensus |
|---|---|---|---|
| Uber Technologies, Inc. | 140 | 73 | 111.26 |
| Autodesk, Inc. | 400 | 343 | 373 |
Analysts expect Uber’s stock to rise substantially, with a consensus target about 31% above its current price of $84.86. Autodesk shows even stronger upside potential, with targets roughly 40% higher than its current $265.69. This suggests bullish sentiment for both stocks.
Analyst Opinions Comparison
This section compares analysts’ ratings and grades for Uber Technologies, Inc. and Autodesk, Inc.:
Rating Comparison
Uber Rating
- Rating: B, considered very favorable by analysts.
- Discounted Cash Flow Score: 1, indicating very unfavorable valuation.
- ROE Score: 5, showing very favorable profit generation from equity.
- ROA Score: 5, demonstrating very effective asset utilization.
- Debt To Equity Score: 2, moderate financial risk.
- Overall Score: 3, a moderate overall financial standing.
Autodesk Rating
- Rating: B-, also very favorable according to analysts.
- Discounted Cash Flow Score: 3, reflecting a moderate valuation.
- ROE Score: 5, also very favorable in profit generation from equity.
- ROA Score: 4, favorable but slightly lower asset utilization.
- Debt To Equity Score: 1, indicating very unfavorable financial risk.
- Overall Score: 3, also a moderate overall financial standing.
Which one is the best rated?
Based strictly on provided data, Uber holds a slightly better rating with a B versus B- for Autodesk. Uber also scores better in discounted cash flow and debt-to-equity metrics, while both share equal overall and ROE scores.
Scores Comparison
Here is a comparison of the Altman Z-Score and Piotroski Score for Uber and Autodesk Technologies, Inc.:
Uber Scores
- Altman Z-Score: 4.44, indicating a safe zone with low bankruptcy risk.
- Piotroski Score: 6, representing average financial strength.
Autodesk Scores
- Altman Z-Score: 5.05, indicating a safe zone with very low bankruptcy risk.
- Piotroski Score: 8, representing very strong financial strength.
Which company has the best scores?
Autodesk shows stronger financial health with a higher Piotroski Score of 8 versus Uber’s 6 and a slightly better Altman Z-Score at 5.05 compared to 4.44 for Uber. Based strictly on these scores, Autodesk appears financially stronger.
Grades Comparison
The following sections present the recent grades from reputable grading companies for Uber Technologies, Inc. and Autodesk, Inc.:
Uber Technologies, Inc. Grades
The table below summarizes recent grades and actions from well-known grading firms for Uber:
| Grading Company | Action | New Grade | Date |
|---|---|---|---|
| BTIG | Maintain | Buy | 2026-01-15 |
| Wells Fargo | Maintain | Overweight | 2026-01-08 |
| Cantor Fitzgerald | Maintain | Overweight | 2026-01-08 |
| Wolfe Research | Maintain | Outperform | 2026-01-06 |
| Wedbush | Maintain | Neutral | 2025-12-19 |
| Morgan Stanley | Maintain | Overweight | 2025-12-08 |
| Arete Research | Upgrade | Buy | 2025-12-03 |
| Wells Fargo | Maintain | Overweight | 2025-11-05 |
| Guggenheim | Maintain | Buy | 2025-11-05 |
| DA Davidson | Maintain | Buy | 2025-11-05 |
Most recent grades for Uber Technologies show a strong buy and overweight consensus, reflecting stable positive sentiment from multiple analysts.
Autodesk, Inc. Grades
The table below summarizes recent grades and actions from well-known grading firms for Autodesk:
| Grading Company | Action | New Grade | Date |
|---|---|---|---|
| Barclays | Maintain | Overweight | 2025-11-26 |
| Wells Fargo | Maintain | Overweight | 2025-11-26 |
| Deutsche Bank | Upgrade | Buy | 2025-11-26 |
| B of A Securities | Maintain | Neutral | 2025-11-26 |
| Rosenblatt | Maintain | Buy | 2025-11-26 |
| Macquarie | Maintain | Outperform | 2025-11-26 |
| BMO Capital | Maintain | Market Perform | 2025-11-26 |
| Baird | Maintain | Outperform | 2025-11-26 |
| Rosenblatt | Maintain | Buy | 2025-11-24 |
| Baird | Maintain | Outperform | 2025-11-18 |
Autodesk’s recent grades indicate a generally optimistic view with several buy and outperform ratings, supported by multiple upgrades and consistent analyst confidence.
Which company has the best grades?
Both Uber and Autodesk have received predominantly positive grades, with consensus ratings at “Buy.” Uber’s grades emphasize consistent overweight and buy ratings from major firms, while Autodesk shows a mix of buy, outperform, and market perform grades, with some neutral opinions. For investors, Uber’s more concentrated buy and overweight ratings might indicate stronger near-term confidence compared to Autodesk’s slightly broader grade range.
Strengths and Weaknesses
Below is a comparison of key strengths and weaknesses for Uber Technologies, Inc. and Autodesk, Inc. based on the most recent financial and operational data.
| Criterion | Uber Technologies, Inc. | Autodesk, Inc. |
|---|---|---|
| Diversification | Strong diversification with Mobility $25B, Delivery $13.75B, and Freight $5.14B revenues in 2024 | Diversified software segments: Architecture $2.94B, AutoCAD $1.57B, Manufacturing $1.19B in 2025 |
| Profitability | Net margin 22.41%, ROE 45.72%, ROIC 6.79% (neutral), but overall value destroying (ROIC < WACC) | Net margin 18.14%, ROE 42.43%, ROIC 18.01% (favorable), creating strong value (ROIC > WACC) |
| Innovation | Rapidly growing ROIC trend +139% indicates improving efficiency and innovation in mobility and delivery | Steady ROIC growth +15%, continuous product innovation in CAD and AEC software |
| Global presence | Extensive global footprint in ride-sharing, delivery, and freight logistics | Global software presence with strong adoption in architecture, manufacturing, and media sectors |
| Market Share | Leading position in ride-share and delivery markets, but margin pressure from competition | Leading CAD software provider with entrenched customer base and high switching costs |
Key takeaways: Autodesk shows a durable competitive advantage with strong profitability and innovation, while Uber, despite improving profitability trends, currently destroys value relative to its cost of capital. Uber’s broad diversification across mobility and delivery services is a strength, but market pressures and capital efficiency remain concerns.
Risk Analysis
Below is a comparative risk table for Uber Technologies, Inc. and Autodesk, Inc. based on the latest available data for 2025-2026:
| Metric | Uber Technologies, Inc. (UBER) | Autodesk, Inc. (ADSK) |
|---|---|---|
| Market Risk | Moderate (Beta 1.20) | Higher (Beta 1.47) |
| Debt Level | Moderate (D/E 0.53) | Moderate to high (D/E 0.98) |
| Regulatory Risk | Medium (Rideshare regulations) | Medium (Software compliance) |
| Operational Risk | Medium (Global logistics) | Medium (Software delivery) |
| Environmental Risk | Moderate (Fleet emissions) | Lower (Software focus) |
| Geopolitical Risk | Moderate (Global operations) | Low (Mostly US focus) |
Uber’s main risks stem from regulatory scrutiny in multiple countries and operational complexity in ride-sharing and delivery logistics. Autodesk faces higher market volatility and debt but benefits from a software-centric model with less environmental exposure. Both have moderate regulatory and operational risks, but Uber’s global footprint increases geopolitical concerns. Recent financial metrics show Uber in a safe zone for bankruptcy risk with moderate leverage, while Autodesk has a very strong financial health score despite higher debt levels. Investors should weigh Uber’s regulatory and geopolitical risks against Autodesk’s valuation and market volatility challenges.
Which Stock to Choose?
Uber Technologies, Inc. shows a favorable income evolution with 295% revenue growth over five years and a strong 22.41% net margin in 2024. Its financial ratios are slightly favorable overall, supported by a high ROE of 45.72% and solid interest coverage, while debt levels remain moderate. The company’s profitability is improving, though its economic moat is slightly unfavorable due to ROIC below WACC despite a growing trend. Uber holds a very favorable overall rating with moderate scores on key financial metrics.
Autodesk, Inc. presents favorable income statement metrics, including a high gross margin of 90.57% and a 22.33% EBIT margin in 2025, yet its net income declined nearly 8% over the overall period. Financial ratios are neutral with favorable profitability and debt-to-assets but hindered by high valuation multiples and low liquidity ratios. Its economic moat is very favorable, demonstrating value creation with ROIC well above WACC and increasing profitability. Autodesk’s rating is very favorable, with strong Piotroski and Altman Z-Scores indicating financial strength.
For investors prioritizing growth and improving profitability, Uber may appear attractive due to its rapid income expansion and strong returns on equity. Conversely, those favoring durable competitive advantages and financial stability might find Autodesk’s consistent value creation and very favorable moat more appealing. The choice could depend on individual risk tolerance and investment strategy, balancing growth potential versus sustainable competitive positioning.
Disclaimer: Investment carries a risk of loss of initial capital. The past performance is not a reliable indicator of future results. Be sure to understand risks before making an investment decision.
Go Further
I encourage you to read the complete analyses of Uber Technologies, Inc. and Autodesk, Inc. to enhance your investment decisions: