In the dynamic world of software application providers, Autodesk, Inc. (ADSK) and Tyler Technologies, Inc. (TYL) stand out with their specialized offerings and innovation strategies. Autodesk leads in 3D design and engineering software, while Tyler excels in integrated public sector management solutions. Both serve distinct yet overlapping markets, making their comparison essential for investors seeking growth and stability. Join me as we explore which company presents the most compelling investment opportunity.

Table of contents
Companies Overview
I will begin the comparison between Autodesk and Tyler Technologies by providing an overview of these two companies and their main differences.
Autodesk Overview
Autodesk, Inc. specializes in 3D design, engineering, and entertainment software worldwide. Its portfolio includes AutoCAD, BIM 360, Fusion 360, and media-focused tools like Maya and 3ds Max. The company serves professionals in architecture, engineering, construction, manufacturing, and media industries. Founded in 1982 and headquartered in San Rafael, California, Autodesk operates in the software application industry with a market capitalization of approximately 56.6B USD.
Tyler Technologies Overview
Tyler Technologies, Inc. delivers integrated information management solutions for the public sector. It offers software for government financial management, appraisal and tax, judicial and public safety systems, and K-12 education administration. Founded in 1966 and based in Plano, Texas, Tyler operates across multiple segments with a 19B USD market cap. The company focuses on enhancing public sector operations with cloud collaborations, including a partnership with Amazon Web Services.
Key similarities and differences
Both Autodesk and Tyler Technologies operate in the software application industry, but their target markets differ significantly: Autodesk focuses on design and engineering professionals, while Tyler serves public sector agencies. Autodesk’s product suite emphasizes 3D modeling and creative software, whereas Tyler’s portfolio revolves around integrated government management solutions. Autodesk is larger by market cap and employee count, reflecting its broader industry reach compared to Tyler’s niche specialization in public sector software.
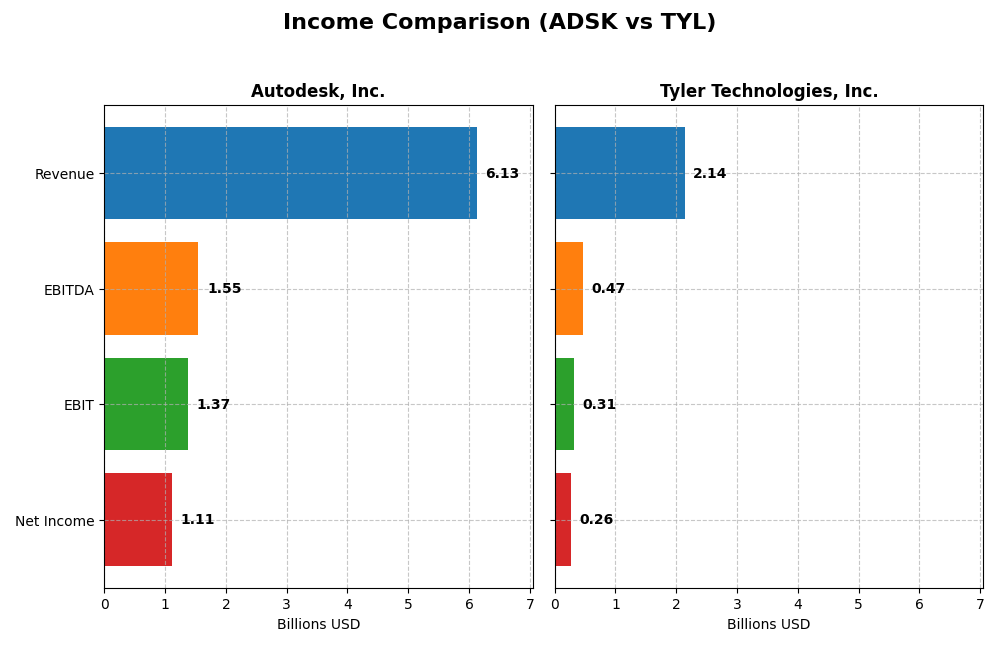
Income Statement Comparison
This table compares the key income statement metrics for Autodesk, Inc. and Tyler Technologies, Inc. for their most recent fiscal years, providing a clear financial snapshot.
| Metric | Autodesk, Inc. (ADSK) | Tyler Technologies, Inc. (TYL) |
|---|---|---|
| Market Cap | 56.6B | 18.9B |
| Revenue | 6.13B | 2.14B |
| EBITDA | 1.55B | 466M |
| EBIT | 1.37B | 314M |
| Net Income | 1.11B | 263M |
| EPS | 5.17 | 6.17 |
| Fiscal Year | 2025 | 2024 |
Income Statement Interpretations
Autodesk, Inc.
Autodesk’s revenue steadily increased from $3.79B in 2021 to $6.13B in 2025, a 61.7% growth over five years. Net income showed volatility, peaking at $1.21B in 2021 but dropping to $1.11B in 2025. Margins remain strong, with a gross margin exceeding 90% and an improving EBIT margin reaching 22.3% in 2025. The latest year saw favorable growth in revenue (+12.7%) and EBIT (+20.5%), alongside improved net margins.
Tyler Technologies, Inc.
Tyler’s revenue rose significantly from $1.11B in 2020 to $2.14B in 2024, representing a 91.5% increase. Net income also grew consistently, reaching $263M in 2024, up 35% over the period. Gross and EBIT margins are stable, with gross margin near 41% and EBIT margin at 14.7%. In 2024, revenue grew 9.5%, EBIT jumped 41.6%, and net margin improved by 44.7%, indicating strong operational leverage.
Which one has the stronger fundamentals?
Both companies demonstrate favorable income statement trends, but Tyler shows greater net income and EPS growth over the period, despite a lower gross margin than Autodesk. Autodesk exhibits higher profitability margins and a larger scale, though its net income and margin growth have faced recent declines. Tyler’s stronger overall growth and margin improvements suggest robust fundamentals, while Autodesk’s solid margins reflect operational efficiency.
Financial Ratios Comparison
The table below presents a side-by-side comparison of key financial ratios for Autodesk, Inc. and Tyler Technologies, Inc. for their most recent fiscal years, providing insight into their profitability, liquidity, leverage, and efficiency.
| Ratios | Autodesk, Inc. (2025) | Tyler Technologies, Inc. (2024) |
|---|---|---|
| ROE | 42.4% | 7.8% |
| ROIC | 18.0% | 6.2% |
| P/E | 60.2 | 93.4 |
| P/B | 25.5 | 7.3 |
| Current Ratio | 0.68 | 1.35 |
| Quick Ratio | 0.68 | 1.35 |
| D/E | 0.98 | 0.19 |
| Debt-to-Assets | 23.6% | 12.3% |
| Interest Coverage | 0 (not available) | 50.5 |
| Asset Turnover | 0.57 | 0.41 |
| Fixed Asset Turnover | 21.4 | 11.0 |
| Payout ratio | 0 | 0 |
| Dividend yield | 0 | 0 |
Interpretation of the Ratios
Autodesk, Inc.
Autodesk’s financial ratios show a mixed picture: strong profitability with a net margin of 18.14% and ROE at 42.43%, but concerns arise from a high P/E ratio of 60.2 and low liquidity indicated by a current ratio of 0.68. The company does not pay dividends, likely reflecting a reinvestment strategy focused on growth and innovation, supported by consistent free cash flow.
Tyler Technologies, Inc.
Tyler Technologies displays moderate profitability with a net margin of 12.3%, but its ROE is weak at 7.76%, suggesting less efficient equity use. Liquidity ratios are healthier, with a current ratio of 1.35 and quick ratio favorable. Tyler also does not pay dividends, which may indicate ongoing reinvestment or prioritization of R&D, consistent with its free cash flow patterns and conservative debt levels.
Which one has the best ratios?
Tyler Technologies edges out Autodesk slightly due to better liquidity and a more balanced debt profile, despite lower profitability metrics. Autodesk’s high profitability contrasts with concerns over valuation and liquidity. Both companies do not distribute dividends, focusing instead on growth, so the choice depends on investor preference for profitability versus financial stability.
Strategic Positioning
This section compares the strategic positioning of Autodesk and Tyler Technologies across Market position, Key segments, and Exposure to technological disruption:
Autodesk, Inc.
- Leading software provider in 3D design and engineering, facing competitive pressure in tech sector.
- Diverse segments: Architecture, Engineering, Construction, Manufacturing, Media, and Entertainment.
- Exposure through cloud-based construction management and design tools, innovating in 3D CAD and CAM.
Tyler Technologies, Inc.
- Focused on public sector software solutions with moderate competitive pressure in niche government markets.
- Concentrated segments: Enterprise software, appraisal, tax, SaaS, professional services, and transaction fees.
- Strategic AWS collaboration for cloud hosting; software solutions tailored for public sector automation and records.
Autodesk, Inc. vs Tyler Technologies, Inc. Positioning
Autodesk operates a diversified business across multiple professional design and manufacturing sectors, while Tyler Technologies focuses on concentrated public sector software. Autodesk’s broad market reach contrasts with Tyler’s specialized government agency focus, each with distinct scale and complexity.
Which has the best competitive advantage?
Autodesk shows a very favorable moat with growing ROIC and consistent value creation, indicating a durable competitive advantage. Tyler Technologies exhibits a very unfavorable moat with declining ROIC, signaling value destruction and weaker competitive positioning.
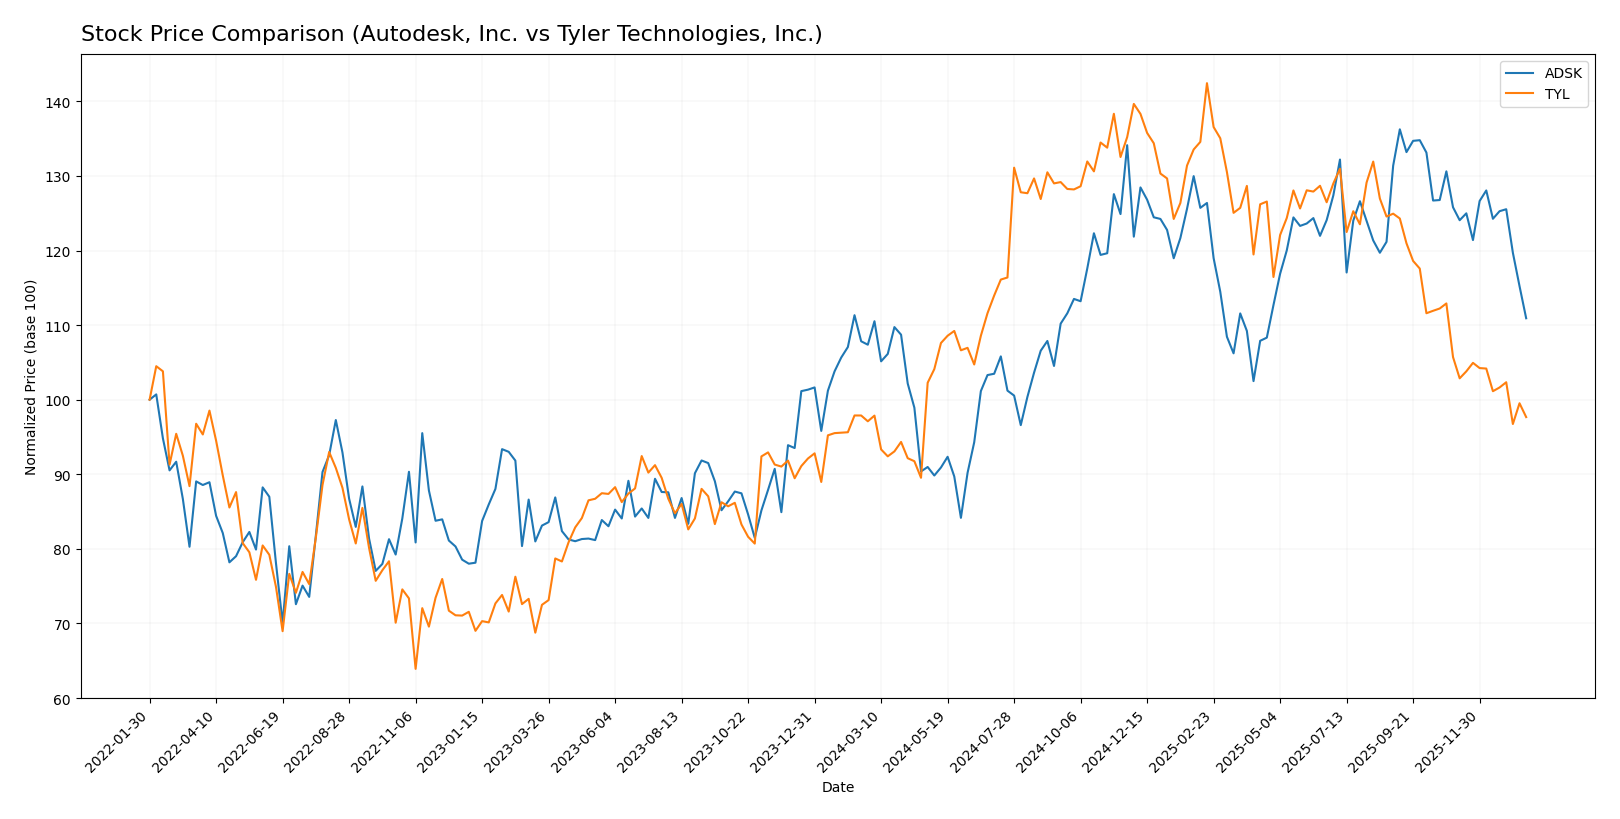
Stock Comparison
The stock prices of Autodesk, Inc. and Tyler Technologies, Inc. have demonstrated distinct dynamics over the past 12 months, with Autodesk showing a modest overall gain despite recent declines, while Tyler’s price change remains nearly flat but with notable recent downward pressure.
Trend Analysis
Autodesk, Inc. recorded a 3.3% price increase over the past year, indicating a bullish trend with deceleration. The stock hit a high of 326.37 and a low of 201.6, with recent months showing an 11.83% decline.
Tyler Technologies, Inc. experienced a 0.58% price increase over the same period, reflecting a neutral trend with deceleration. The stock ranged between 403.35 and 641.7, but recently fell by 7.61%.
Comparing both stocks, Autodesk delivered the highest market performance with a 3.3% gain, outperforming Tyler’s marginal 0.58% increase over the past year.
Target Prices
Analysts show a positive outlook with clear target price ranges for Autodesk, Inc. and Tyler Technologies, Inc.
| Company | Target High | Target Low | Consensus |
|---|---|---|---|
| Autodesk, Inc. | 400 | 343 | 373 |
| Tyler Technologies, Inc. | 675 | 470 | 584 |
The consensus target prices for Autodesk and Tyler Technologies are significantly above their current prices, indicating expected growth potential according to analysts. Autodesk trades near 266 USD, while Tyler is around 440 USD.
Analyst Opinions Comparison
This section compares analysts’ ratings and grades for Autodesk, Inc. and Tyler Technologies, Inc.:
Rating Comparison
Autodesk, Inc. Rating
- Rating: B- indicating a very favorable overall assessment.
- Discounted Cash Flow Score: Moderate at 3 out of 5.
- ROE Score: Very favorable at 5, showing efficient profit generation.
- ROA Score: Favorable at 4, reflecting effective asset utilization.
- Debt To Equity Score: Very unfavorable at 1, indicating high financial risk.
- Overall Score: Moderate at 3, summarizing financial standing.
Tyler Technologies, Inc. Rating
- Rating: B indicating a very favorable overall assessment.
- Discounted Cash Flow Score: Favorable at 4 out of 5.
- ROE Score: Moderate at 3, indicating average profit efficiency.
- ROA Score: Favorable at 4, reflecting effective asset utilization.
- Debt To Equity Score: Moderate at 3, showing balanced financial risk.
- Overall Score: Moderate at 3, summarizing financial standing.
Which one is the best rated?
Tyler Technologies holds a slightly better rating with a B versus Autodesk’s B-, supported by a higher discounted cash flow and debt-to-equity score. Autodesk excels in ROE but suffers from financial leverage concerns.
Scores Comparison
Here is a comparison of the financial scores for Autodesk and Tyler Technologies:
Autodesk Scores
- Altman Z-Score: 5.05, indicating a safe financial zone with low bankruptcy risk.
- Piotroski Score: 8, categorized as very strong financial health.
Tyler Technologies Scores
- Altman Z-Score: 7.42, also in the safe zone with very low bankruptcy risk.
- Piotroski Score: 6, reflecting average financial strength.
Which company has the best scores?
Tyler Technologies has a higher Altman Z-Score, suggesting a lower bankruptcy risk, while Autodesk shows a stronger Piotroski Score, indicating better overall financial health. Each company leads in one score based on the data provided.
Grades Comparison
The following presents the recent grades assigned to Autodesk, Inc. and Tyler Technologies, Inc. by various reputable grading companies:
Autodesk, Inc. Grades
This table summarizes Autodesk’s latest grades from several recognized financial institutions.
| Grading Company | Action | New Grade | Date |
|---|---|---|---|
| Barclays | Maintain | Overweight | 2025-11-26 |
| Wells Fargo | Maintain | Overweight | 2025-11-26 |
| Deutsche Bank | Upgrade | Buy | 2025-11-26 |
| B of A Securities | Maintain | Neutral | 2025-11-26 |
| Rosenblatt | Maintain | Buy | 2025-11-26 |
| Macquarie | Maintain | Outperform | 2025-11-26 |
| BMO Capital | Maintain | Market Perform | 2025-11-26 |
| Baird | Maintain | Outperform | 2025-11-26 |
| Rosenblatt | Maintain | Buy | 2025-11-24 |
| Baird | Maintain | Outperform | 2025-11-18 |
Overall, Autodesk exhibits a positive grading trend with multiple buy and outperform ratings and no downgrades in recent updates.
Tyler Technologies, Inc. Grades
This table outlines Tyler Technologies’ current grades from established grading firms.
| Grading Company | Action | New Grade | Date |
|---|---|---|---|
| Piper Sandler | Maintain | Overweight | 2026-01-13 |
| Wells Fargo | Maintain | Equal Weight | 2026-01-08 |
| DA Davidson | Maintain | Neutral | 2025-12-09 |
| Evercore ISI Group | Maintain | In Line | 2025-10-31 |
| DA Davidson | Maintain | Neutral | 2025-10-31 |
| DA Davidson | Maintain | Neutral | 2025-10-10 |
| DA Davidson | Maintain | Neutral | 2025-08-05 |
| Barclays | Maintain | Overweight | 2025-07-31 |
| Needham | Maintain | Buy | 2025-05-13 |
| Barclays | Maintain | Overweight | 2025-04-25 |
Tyler Technologies’ grades mostly reflect a hold or neutral stance, with some overweight and buy ratings, indicating a more cautious outlook.
Which company has the best grades?
Autodesk holds generally stronger grades, featuring multiple buy and outperform ratings, while Tyler Technologies displays more neutral and hold evaluations. This contrast may influence investor sentiment towards Autodesk as having a more favorable outlook based on current analyst opinions.
Strengths and Weaknesses
Below is a comparative table summarizing the key strengths and weaknesses of Autodesk, Inc. (ADSK) and Tyler Technologies, Inc. (TYL) based on recent financial performance, market position, and strategic factors:
| Criterion | Autodesk, Inc. (ADSK) | Tyler Technologies, Inc. (TYL) |
|---|---|---|
| Diversification | Strong diversification across Architecture, Manufacturing, AutoCAD, and Media segments with steady revenue growth. | Moderate diversification focused on SaaS, maintenance, and transaction fees, with less segment variety. |
| Profitability | High net margin (18.14%) and ROIC (18.01%) indicate strong profitability and efficient capital use. | Moderate net margin (12.3%) but lower ROIC (6.2%) and declining profitability trend. |
| Innovation | Very favorable economic moat with growing ROIC reflecting strong innovation and competitive advantage. | Very unfavorable moat status with declining ROIC, indicating challenges in sustaining innovation. |
| Global presence | Significant global reach serving multiple industries with well-established brand recognition. | Primarily focused on U.S. public sector software, with limited international exposure. |
| Market Share | Leading position in CAD and design software markets with strong customer loyalty. | Niche player in government technology solutions, but facing competitive pressures. |
In summary, Autodesk demonstrates robust diversification, profitability, and a durable competitive advantage, making it a strong candidate for growth-oriented investors. Tyler Technologies shows reasonable operational stability but suffers from declining profitability and a weaker moat, warranting cautious evaluation.
Risk Analysis
Below is a comparative table highlighting key risks for Autodesk, Inc. (ADSK) and Tyler Technologies, Inc. (TYL) based on the most recent data available in 2026:
| Metric | Autodesk, Inc. (ADSK) | Tyler Technologies, Inc. (TYL) |
|---|---|---|
| Market Risk | High beta at 1.47 indicates higher volatility and market sensitivity. | Moderate beta at 0.92 suggests lower market volatility. |
| Debt Level | Debt-to-equity ratio near 1.0, moderate leverage with 23.6% debt-to-assets. | Low leverage, debt-to-equity 0.19 and 12.3% debt-to-assets, low financial risk. |
| Regulatory Risk | Moderate, operates globally in software industry with evolving compliance needs. | Moderate, focused on US public sector software with government regulations. |
| Operational Risk | Complexity in diverse software products and cloud services increases operational challenges. | Focused on public sector solutions; operational risk from integration and service delivery. |
| Environmental Risk | Limited direct environmental impact; risks mainly reputational and regulatory. | Similar low environmental footprint; mostly software-based services. |
| Geopolitical Risk | Exposure to global markets including US tech policies and international trade tensions. | Primarily US-focused, lower geopolitical risk but sensitive to federal and state government budgets. |
In summary, Autodesk faces higher market and geopolitical risks due to its global presence and elevated beta, while Tyler Technologies benefits from lower leverage and more stable government contracts, though it must navigate regulatory and budgetary constraints. Market volatility and debt levels are the most impactful risks to monitor for Autodesk; Tyler’s risk profile is more moderate but includes dependency on public sector funding.
Which Stock to Choose?
Autodesk, Inc. (ADSK) shows a favorable income evolution with 12.7% revenue growth in 2025 and strong profitability metrics, including an 18.14% net margin and 42.43% ROE. Its debt levels are moderate with a net debt to EBITDA around 0.62, supported by a very favorable moat rating indicating durable competitive advantage. The overall financial ratios present a balanced picture with both favorable and unfavorable aspects, leading to a neutral global ratio evaluation.
Tyler Technologies, Inc. (TYL) reports steady income growth with a 9.53% revenue increase in 2024 and favorable net margin at 12.3%. Profitability ratios are moderate with a low 7.76% ROE, while debt is low and comfortably managed (net debt to EBITDA negative). The company’s moat rating is very unfavorable, reflecting declining profitability and value destruction. Financial ratios are slightly favorable overall, supported by solid liquidity and interest coverage.
Considering rating and financial evaluations, Autodesk’s very favorable moat and strong profitability metrics might appeal more to quality-focused investors seeking companies with durable competitive advantages. Conversely, Tyler’s lower debt and moderate income growth could be more attractive to risk-tolerant investors prioritizing steady expansion despite weaker profitability signals. The choice may appear to depend on the investor’s preference for growth and long-term value creation versus stability and moderate returns.
Disclaimer: Investment carries a risk of loss of initial capital. The past performance is not a reliable indicator of future results. Be sure to understand risks before making an investment decision.
Go Further
I encourage you to read the complete analyses of Autodesk, Inc. and Tyler Technologies, Inc. to enhance your investment decisions: