Home > Comparison > Technology > ADSK vs MSTR
The strategic rivalry between Autodesk, Inc. and Strategy Inc defines the current trajectory of the software application sector. Autodesk operates as a capital-intensive leader in 3D design and engineering software, while Strategy Inc blends bitcoin treasury management with AI-powered enterprise analytics. This head-to-head contrasts traditional software dominance against innovative fintech integration. This analysis evaluates which corporate path delivers superior risk-adjusted returns for a diversified portfolio in 2026.
Table of contents
Companies Overview
Autodesk and Strategy Inc stand as pivotal players in the evolving software landscape, each commanding distinct market niches.
Autodesk, Inc.: Leader in 3D Design Software
Autodesk dominates the 3D design and engineering software market. It generates revenue through subscriptions of flagship products like AutoCAD and Fusion 360, serving industries from architecture to manufacturing. In 2026, Autodesk sharpened its strategic focus on cloud-based collaboration tools, enhancing real-time project management and cross-industry integration.
Strategy Inc: Bitcoin Treasury and AI Analytics Pioneer
Strategy Inc operates at the intersection of bitcoin treasury management and AI-driven enterprise software. It earns by offering bitcoin exposure via securities and licensing cutting-edge analytics platforms like Strategy One. The company’s 2026 strategy emphasizes expanding AI applications for data governance while maintaining its unique position as a bitcoin exposure provider.
Strategic Collision: Similarities & Divergences
Both companies leverage software to empower enterprises, but Autodesk centers on design ecosystems, while Strategy Inc blends finance with AI analytics. Their primary battle unfolds in enterprise software innovation, albeit targeting different end users. Autodesk offers stable industry solutions; Strategy Inc presents a volatile yet potentially high-growth investment profile due to its bitcoin focus.
Income Statement Comparison
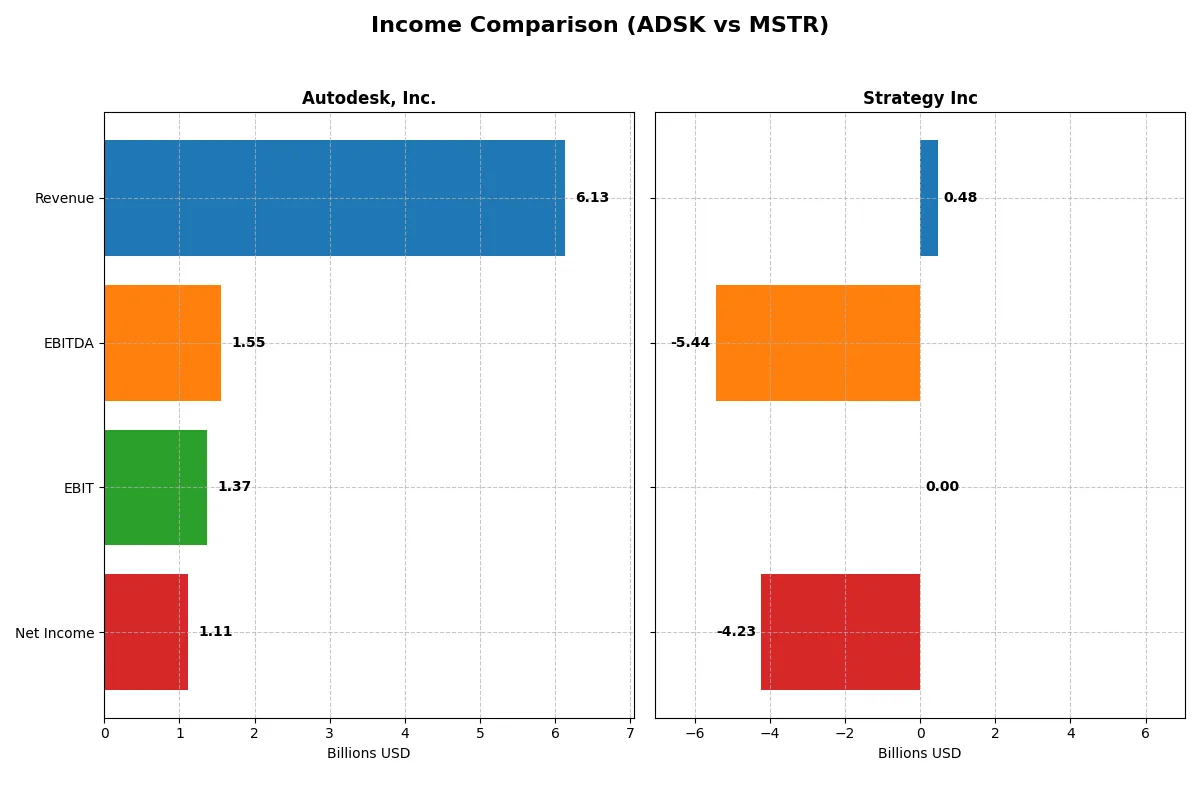
This data dissects the core profitability and scalability of both corporate engines to reveal who dominates the bottom line:
| Metric | Autodesk, Inc. (ADSK) | Strategy Inc (MSTR) |
|---|---|---|
| Revenue | 6.13B | 477M |
| Cost of Revenue | 578M | 149M |
| Operating Expenses | 4.20B | 5.62B |
| Gross Profit | 5.55B | 328M |
| EBITDA | 1.55B | -5.44B |
| EBIT | 1.37B | 0 |
| Interest Expense | 0 | -65M |
| Net Income | 1.11B | -4.23B |
| EPS | 5.17 | -15.23 |
| Fiscal Year | 2025 | 2025 |
Income Statement Analysis: The Bottom-Line Duel
This income statement comparison reveals each company’s core operational efficiency and profitability trajectory over recent years.
Autodesk, Inc. Analysis
Autodesk’s revenue surged from 3.79B in 2021 to 6.13B in 2025, showing strong top-line growth. Net income grew steadily to 1.11B in 2025, despite a slight overall period dip. The company maintains robust gross margins above 90%, with a healthy net margin near 18%, reflecting excellent cost control and operational leverage. Recent years show accelerating EBIT and EPS growth, signaling sustained momentum.
Strategy Inc Analysis
Strategy Inc’s revenue remained modest near 477M in 2025, barely growing over five years. Net income deteriorated sharply, posting a 4.23B loss in 2025, marking deep operational challenges. The gross margin at 68.7% is decent, but the net margin plunged below -886%, driven by ballooning expenses and massive other losses. Despite some EBIT improvement, overall profitability and growth remain severely negative.
Margin Strength vs. Earnings Collapse
Autodesk stands out with consistent revenue growth and strong profitability margins, demonstrating operational excellence. Strategy Inc struggles with shrinking top-line and massive net losses, eroding shareholder value. Autodesk’s profile appeals more to investors seeking stable earnings and margin power, while Strategy Inc’s losses highlight significant risk and profit uncertainty.
Financial Ratios Comparison
These vital ratios act as a diagnostic tool to expose the underlying fiscal health, valuation premiums, and capital efficiency of the companies compared below:
| Ratios | Autodesk, Inc. (ADSK) | Strategy Inc (MSTR) |
|---|---|---|
| ROE | 42.4% | -6.4% |
| ROIC | 18.0% | -4.4% |
| P/E | 60.2 | -47.8 |
| P/B | 25.5 | 3.06 |
| Current Ratio | 0.68 | 0.71 |
| Quick Ratio | 0.68 | 0.71 |
| D/E | 0.98 | 0.40 |
| Debt-to-Assets | 24% | 28% |
| Interest Coverage | 0 | -29.9 |
| Asset Turnover | 0.57 | 0.018 |
| Fixed Asset Turnover | 21.4 | 5.73 |
| Payout Ratio | 0 | 0 |
| Dividend Yield | 0 | 0 |
| Fiscal Year | 2025 | 2024 |
Efficiency & Valuation Duel: The Vital Signs
Financial ratios act as a company’s DNA, exposing hidden risks and operational strengths that shape investment decisions.
Autodesk, Inc.
Autodesk delivers strong profitability with a 42.4% ROE and 18.1% net margin, signaling operational excellence. Its valuation appears stretched, with a high P/E of 60.2 and P/B of 25.5. The company does not pay dividends but reinvests heavily in R&D, dedicating 24.2% of revenue to innovation, fueling long-term growth.
Strategy Inc
Strategy Inc suffers from weak profitability, posting negative ROE (-6.4%) and net margins (-251.7%), reflecting operational challenges. Despite a negative P/E, its P/B of 3.06 suggests undervaluation. The firm pays no dividends and shows poor free cash flow, with reinvestment efforts failing to offset losses, increasing risk for shareholders.
Premium Valuation vs. Operational Safety
Autodesk balances high profitability and innovation but trades at a premium, exposing valuation risk. Strategy Inc’s weak returns and negative cash flow weigh heavily despite lower valuation multiples. Investors seeking operational stability may prefer Autodesk, while those targeting turnaround potential might consider Strategy Inc’s riskier profile.
Which one offers the Superior Shareholder Reward?
Autodesk (ADSK) and Strategy Inc (MSTR) both skip dividends but differ sharply in buyback and reinvestment approaches. Autodesk’s robust free cash flow of 7/share funds moderate buybacks, sustaining growth with 0 payout ratio and solid margins (~18%). Strategy Inc’s losses and free cash flow deficits (-115/share) hinder buybacks, relying on risky reinvestments amid negative profitability. I see Autodesk’s disciplined capital allocation and strong cash generation as a sustainable model, offering superior total shareholder return in 2026 versus Strategy’s volatile profile and weakened financial health.
Comparative Score Analysis: The Strategic Profile
The radar chart reveals the fundamental DNA and trade-offs of Autodesk, Inc. and Strategy Inc, highlighting their core financial strengths and weaknesses:
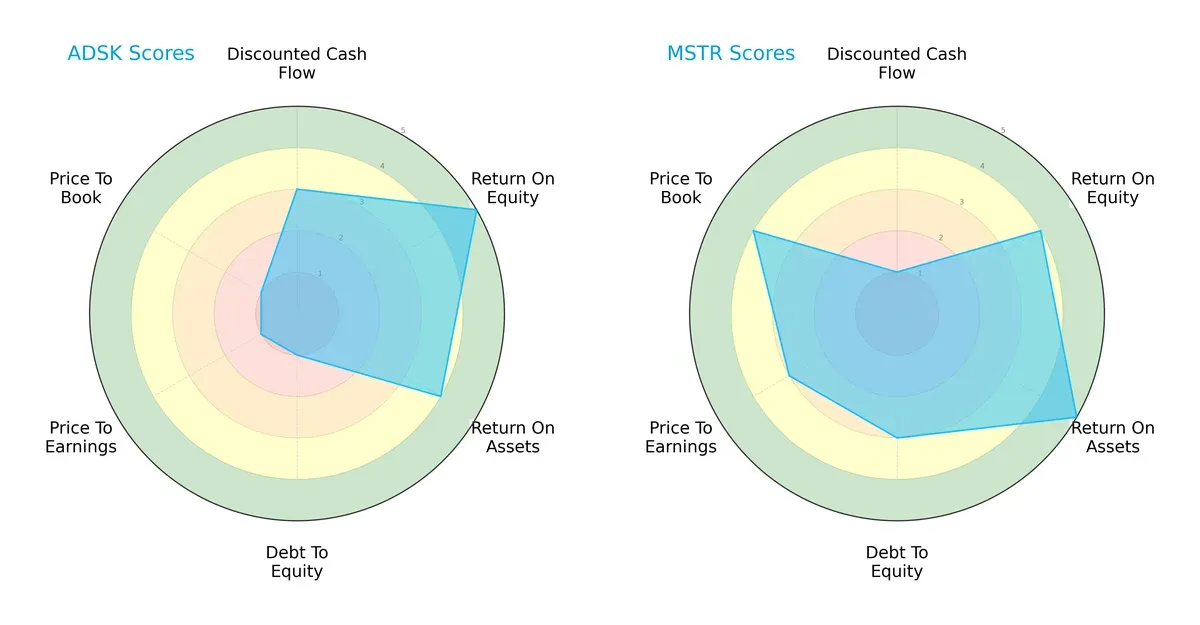
Autodesk excels in return on equity (5) and return on assets (4), reflecting strong profit generation and asset utilization. However, it suffers in debt management and valuation (all scores at 1), risking financial stability and market perception. Strategy Inc presents a more balanced profile, with moderate debt (3) and better valuation scores (PE 3, PB 4), despite weaker discounted cash flow (1). Strategy Inc’s strength lies in prudent capital structure and fair valuation, while Autodesk leans heavily on operational efficiency but at potential financial risk.
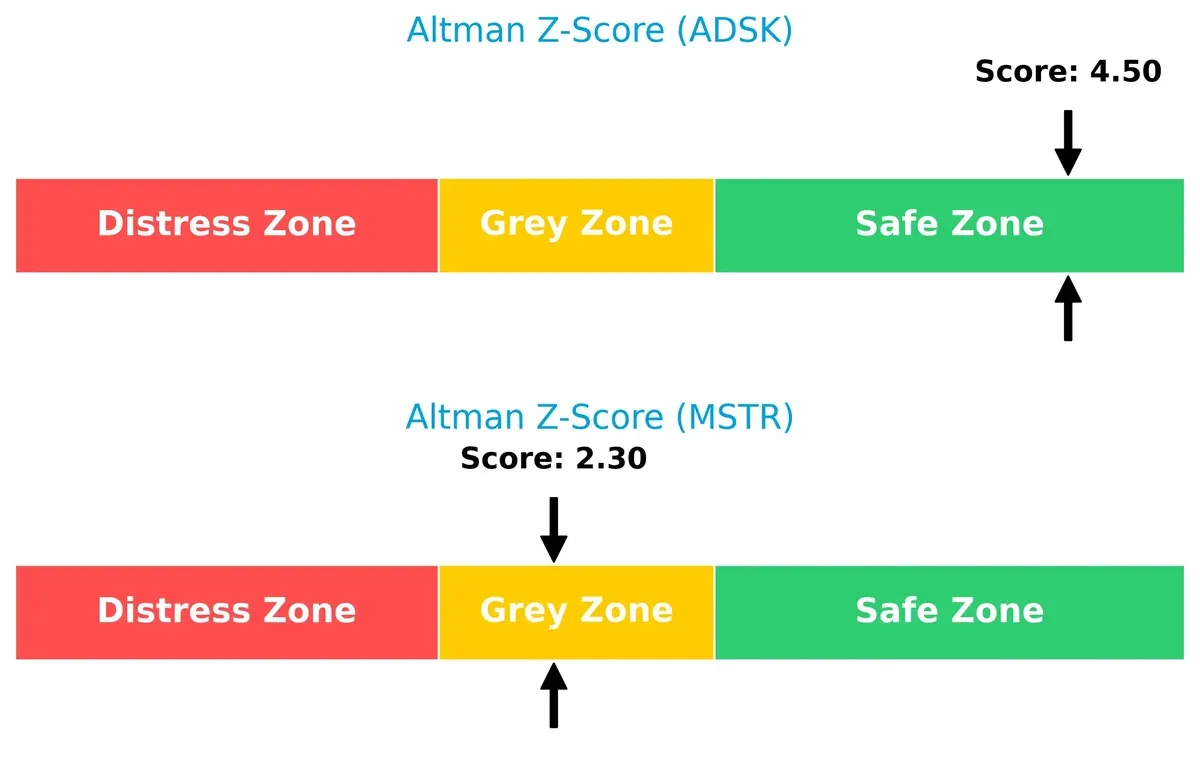
Bankruptcy Risk: Solvency Showdown
Autodesk’s Altman Z-Score of 4.5 places it firmly in the safe zone, signaling robust solvency. Strategy Inc’s 2.3 score falls in the grey zone, indicating moderate bankruptcy risk in this cycle:
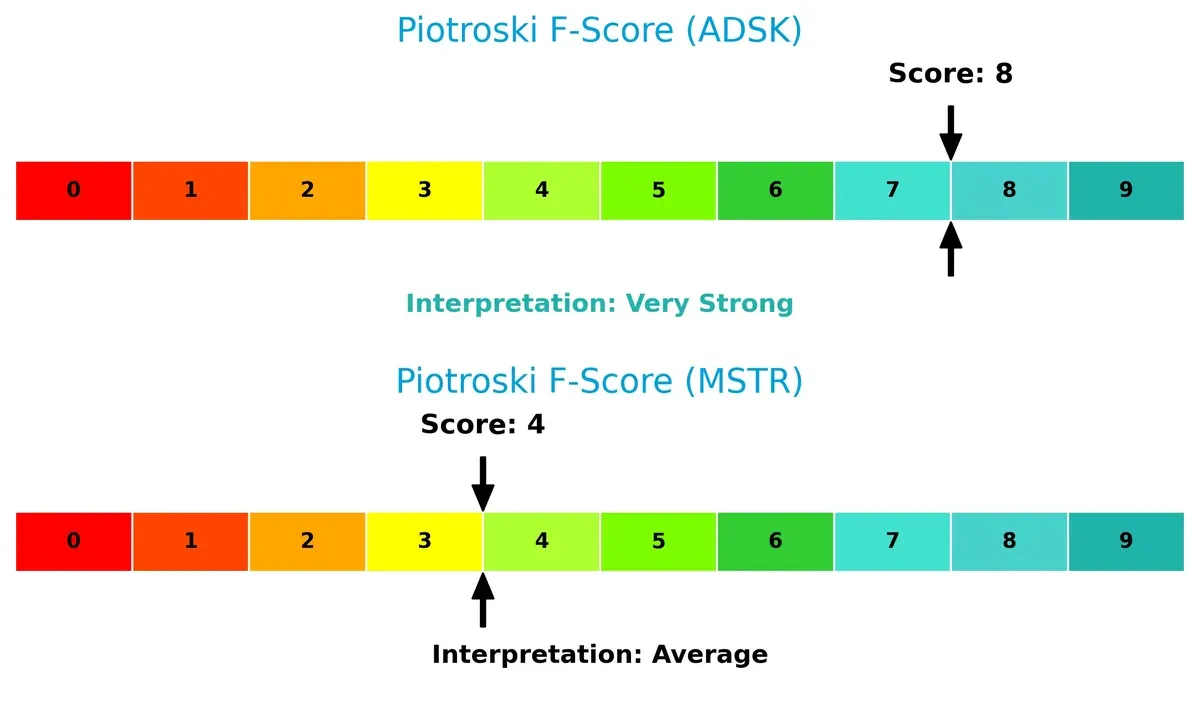
Financial Health: Quality of Operations
Autodesk’s Piotroski F-Score of 8 indicates very strong operational quality and financial health. Strategy Inc’s score of 4 signals average health, suggesting internal red flags compared to Autodesk’s robust metrics:
How are the two companies positioned?
This section dissects the operational DNA of Autodesk and Strategy by comparing their revenue distribution and internal dynamics. The goal is to confront their economic moats to identify which model delivers the most resilient competitive advantage.
Revenue Segmentation: The Strategic Mix
This visual comparison dissects how Autodesk, Inc. and Strategy Inc diversify their income streams and reveals where their primary sector bets lie:
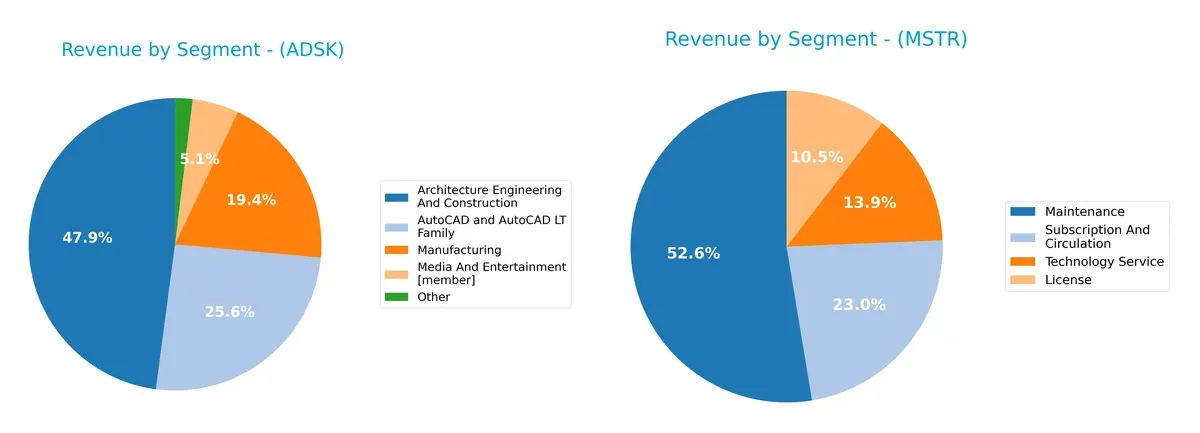
Autodesk anchors its revenue in Architecture Engineering And Construction with $2.94B, while AutoCAD and Manufacturing add $1.57B and $1.19B respectively, showing notable diversification. Strategy Inc pivots heavily on Maintenance at $244M, dwarfing other segments like Subscription ($107M) and Technology Service ($64M). Autodesk’s mix suggests strong ecosystem lock-in across industries; Strategy Inc’s reliance on Maintenance exposes concentration risk but ensures steady recurring income.
Strengths and Weaknesses Comparison
This table compares the Strengths and Weaknesses of Autodesk and Strategy Inc:
Autodesk Strengths
- Diverse product segments including Architecture, Manufacturing, and Media
- Strong profitability with 18.14% net margin and 42.43% ROE
- Favorable fixed asset turnover at 21.44
- Global presence with significant revenues in Americas, EMEA, and Asia Pacific
Strategy Inc Strengths
- Favorable debt to equity ratio at 0.4
- Positive fixed asset turnover at 5.73
- Diverse revenue streams including License, Maintenance, and Subscription
- Presence in North America, EMEA, and other regions
Autodesk Weaknesses
- Unfavorable liquidity ratios with current and quick ratios at 0.68
- High P/E of 60.2 and P/B of 25.54 suggest overvaluation risk
- Weighted Average Cost of Capital (WACC) at 10.27% unfavorable
- No dividend yield
Strategy Inc Weaknesses
- Negative profitability metrics with -251.73% net margin and -6.4% ROE
- Unfavorable current and quick ratios at 0.71
- Negative interest coverage and very low asset turnover at 0.02
- No dividend yield
Autodesk’s strengths lie in its diversified product lines and strong profitability, yet it faces liquidity challenges and valuation concerns. Strategy Inc shows solid asset utilization and manageable leverage but suffers from poor profitability and liquidity, which may constrain its financial flexibility.
The Moat Duel: Analyzing Competitive Defensibility
A structural moat is the only true protection for long-term profits against relentless competitive erosion. Let’s dissect how these firms defend their turf:
Autodesk, Inc.: Intangible Assets & Scale-Driven Moat
Autodesk leverages deep intangible assets and vast scale, reflected in a robust 90.6% gross margin and growing ROIC above WACC by 7.7%. Expansion into cloud-based design tools in 2026 should widen its moat further.
Strategy Inc: Bitcoin Treasury & Analytics Niche
Strategy Inc’s moat centers on unique bitcoin treasury exposure and AI analytics. Unlike Autodesk, it struggles with margin instability and declining ROIC trends, risking disruption despite pockets of revenue growth opportunities.
Verdict: Intangible Assets vs. Niche Treasury Exposure
Autodesk’s widening intangible asset moat and consistent value creation outmatch Strategy Inc’s volatile, shrinking competitive edge. Autodesk stands better poised to defend and grow market share in 2026.
Which stock offers better returns?
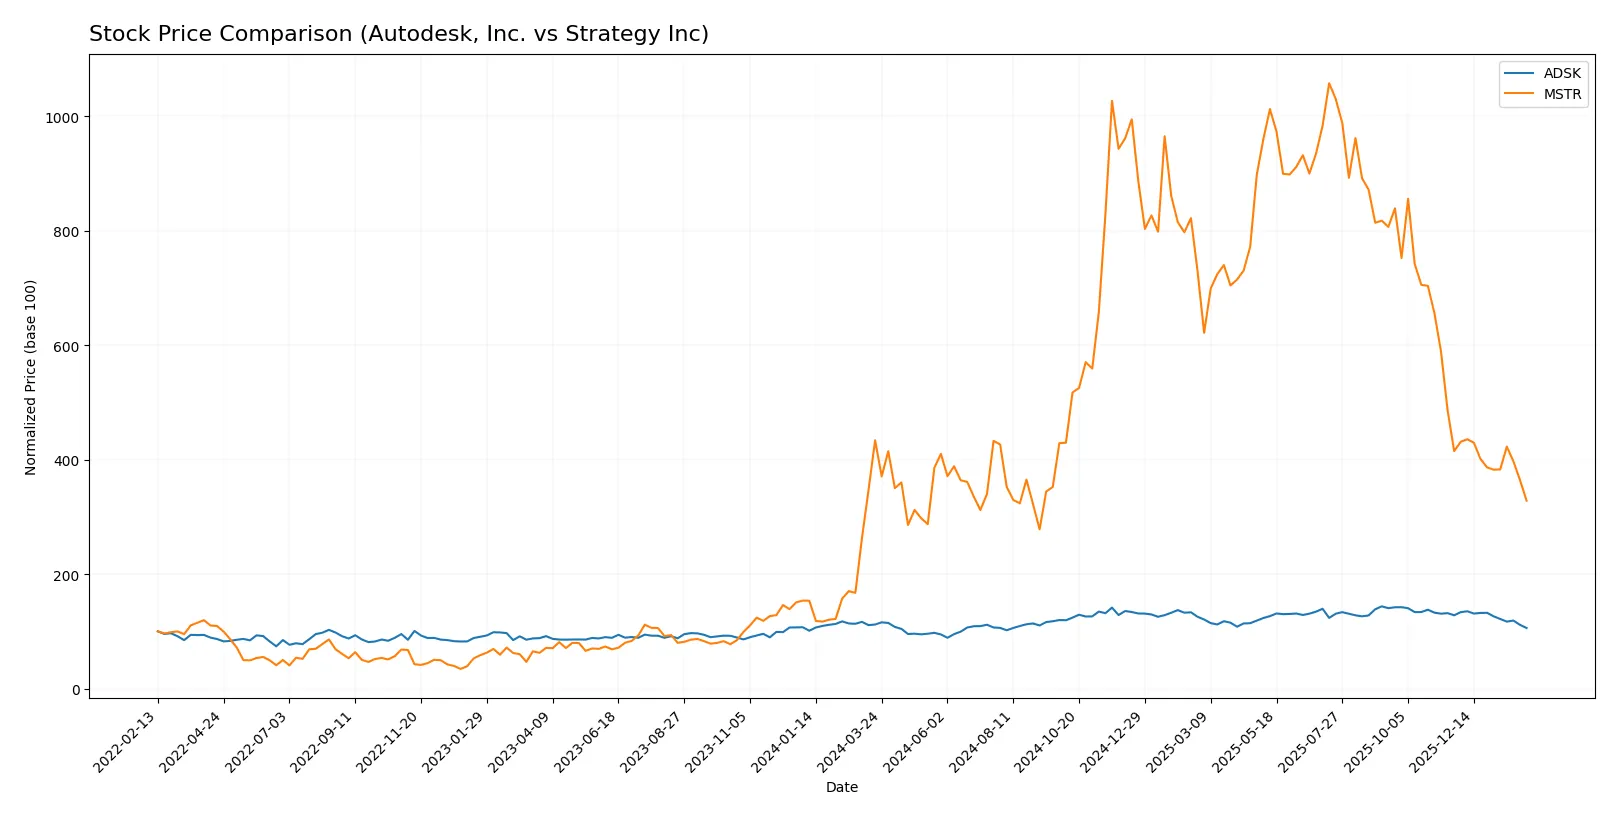
Over the past year, both Autodesk, Inc. and Strategy Inc have experienced clear downward price trends, with Autodesk showing milder losses and Strategy Inc facing sharper declines amid increasing trading volumes.
Trend Comparison
Autodesk’s stock declined by 5.44% over the past 12 months, reflecting a bearish trend with decelerating losses and a high volatility of 30.0. The stock peaked at 326.37 and fell to a low of 201.6.
Strategy Inc’s stock dropped 24.3% in the same period, signaling a stronger bearish trend with deceleration and a much higher volatility of 101.34. It reached a high of 434.58 and a low of 114.3.
Comparing both, Autodesk’s stock delivered a less severe loss, outperforming Strategy Inc, which posted the largest market decline over the past year.
Target Prices
Analysts present a mixed but generally optimistic target consensus for Autodesk, Inc. and Strategy Inc.
| Company | Target Low | Target High | Consensus |
|---|---|---|---|
| Autodesk, Inc. | 343 | 400 | 373 |
| Strategy Inc | 175 | 705 | 374.5 |
Autodesk’s target consensus at 373 implies a 55% upside from its current 240 price, reflecting strong confidence in its long-term growth. Strategy Inc’s wide range suggests high volatility, but the consensus price nearly triples its current 135, indicating aggressive bullish sentiment despite elevated risk.

Don’t Let Luck Decide Your Entry Point
Optimize your entry points with our advanced ProRealTime indicators. You’ll get efficient buy signals with precise price targets for maximum performance. Start outperforming now!
How do institutions grade them?
Here is a comparison of recent institutional grades for Autodesk, Inc. and Strategy Inc:
Autodesk, Inc. Grades
The following table summarizes Autodesk’s recent grades from major financial institutions.
| Grading Company | Action | New Grade | Date |
|---|---|---|---|
| JP Morgan | Upgrade | Overweight | 2026-02-02 |
| Rosenblatt | Maintain | Buy | 2025-11-26 |
| Deutsche Bank | Upgrade | Buy | 2025-11-26 |
| Wells Fargo | Maintain | Overweight | 2025-11-26 |
| Barclays | Maintain | Overweight | 2025-11-26 |
| Macquarie | Maintain | Outperform | 2025-11-26 |
| B of A Securities | Maintain | Neutral | 2025-11-26 |
| BMO Capital | Maintain | Market Perform | 2025-11-26 |
| Baird | Maintain | Outperform | 2025-11-26 |
| Rosenblatt | Maintain | Buy | 2025-11-24 |
Strategy Inc Grades
Below is a summary of Strategy Inc’s most recent institutional grades.
| Grading Company | Action | New Grade | Date |
|---|---|---|---|
| BTIG | Maintain | Buy | 2026-02-06 |
| Canaccord Genuity | Maintain | Buy | 2026-02-04 |
| Mizuho | Maintain | Outperform | 2026-01-16 |
| TD Cowen | Maintain | Buy | 2026-01-15 |
| Citigroup | Maintain | Buy | 2025-12-22 |
| Bernstein | Maintain | Outperform | 2025-12-08 |
| Monness, Crespi, Hardt | Upgrade | Neutral | 2025-11-10 |
| HC Wainwright & Co. | Maintain | Buy | 2025-11-03 |
| Canaccord Genuity | Maintain | Buy | 2025-11-03 |
| TD Cowen | Maintain | Buy | 2025-10-31 |
Which company has the best grades?
Both companies receive predominantly positive institutional grades. Autodesk shows a mix of Overweight, Buy, and Outperform ratings, indicating steady confidence. Strategy Inc’s grades lean heavily Buy and Outperform, reflecting strong market optimism. Investors may interpret these grades as signals of institutional support but should consider other factors for a comprehensive view.
Risks specific to each company
The following categories identify the critical pressure points and systemic threats facing both Autodesk, Inc. and Strategy Inc in the 2026 market environment:
1. Market & Competition
Autodesk, Inc.
- Competes in diversified software with steady demand in 3D design and engineering sectors.
Strategy Inc
- Faces high competition and volatility due to bitcoin treasury exposure and niche AI analytics.
2. Capital Structure & Debt
Autodesk, Inc.
- Debt to assets at 23.6% is favorable; interest coverage is strong and stable.
Strategy Inc
- Lower debt to equity ratio (0.4) but interest coverage is negative, signaling financial stress.
3. Stock Volatility
Autodesk, Inc.
- Beta of 1.45 suggests moderate volatility typical of tech sector.
Strategy Inc
- Beta of 3.54 indicates very high volatility, driven by bitcoin exposure and market speculation.
4. Regulatory & Legal
Autodesk, Inc.
- Faces standard tech industry regulatory scrutiny with no major legal red flags reported.
Strategy Inc
- Bitcoin treasury operations expose company to evolving and uncertain regulatory frameworks globally.
5. Supply Chain & Operations
Autodesk, Inc.
- Robust SaaS delivery model reduces supply chain risks; broad product portfolio.
Strategy Inc
- Limited operational scale and high dependency on digital asset management increase operational risk.
6. ESG & Climate Transition
Autodesk, Inc.
- Technology focus enables ESG integration; no major climate transition risks flagged.
Strategy Inc
- ESG risks elevated due to bitcoin holdings and energy-intensive crypto assets.
7. Geopolitical Exposure
Autodesk, Inc.
- Global presence but primarily U.S.-based, with moderate exposure to geopolitical tensions.
Strategy Inc
- Significant international bitcoin operations heighten exposure to geopolitical and regulatory volatility.
Which company shows a better risk-adjusted profile?
Autodesk’s strongest risk lies in its stretched liquidity ratios, posing near-term funding concerns despite solid operational metrics. Strategy Inc’s paramount risk is its financial instability, highlighted by negative interest coverage and extreme stock volatility. Autodesk’s Altman Z-score of 4.5 places it firmly in a safe zone, while Strategy’s 2.3 signals moderate distress risk. The data shows Autodesk offers a more balanced, lower-risk profile, supported by stable earnings and debt metrics. Strategy’s high beta (3.54) and negative margins underscore elevated risk, driven by its bitcoin treasury model.
Final Verdict: Which stock to choose?
Autodesk, Inc. wields unmatched operational efficiency and a strong track record of value creation. Its rising ROIC well above WACC signals a durable competitive advantage. Yet, its low liquidity ratios warrant caution. It fits best in portfolios seeking aggressive growth with an appetite for occasional balance sheet risks.
Strategy Inc’s strategic moat lies in its intangible asset dominance and conservative debt profile. While its income and profitability metrics lag, it offers comparatively better financial stability than Autodesk. This stock suits investors favoring GARP—growth at a reasonable price—with a tolerance for cyclical volatility.
If you prioritize sustainable profitability and efficient capital allocation, Autodesk outshines due to its superior ROIC and income quality. However, if you seek relative financial safety and are willing to accept uneven earnings, Strategy Inc offers better stability despite weaker growth prospects. Both present distinct analytical scenarios depending on your risk tolerance and investment horizon.
Disclaimer: Investment carries a risk of loss of initial capital. The past performance is not a reliable indicator of future results. Be sure to understand risks before making an investment decision.
Go Further
I encourage you to read the complete analyses of Autodesk, Inc. and Strategy Inc to enhance your investment decisions: