In today’s fast-evolving tech landscape, Autodesk, Inc. and SoundHound AI, Inc. stand out for their innovative software solutions. Autodesk leads in 3D design and engineering software, while SoundHound pioneers voice AI platforms. Both compete within the software application industry, targeting different yet overlapping tech markets. This article will explore their strengths and risks to reveal which company offers the most compelling investment opportunity for you.
Table of contents
Companies Overview
I will begin the comparison between Autodesk, Inc. and SoundHound AI, Inc. by providing an overview of these two companies and their main differences.
Autodesk Overview
Autodesk, Inc. is a leading provider of 3D design, engineering, and entertainment software worldwide. Its mission is to empower professionals across architecture, engineering, manufacturing, and media industries with innovative tools such as AutoCAD, BIM 360, and Fusion 360. Headquartered in San Rafael, California, Autodesk serves a global customer base with a broad product portfolio aimed at design, simulation, and digital content creation.
SoundHound AI Overview
SoundHound AI, Inc. develops an independent voice AI platform designed to enable businesses to create high-quality conversational experiences. Its flagship product, the Houndify platform, offers tools like automatic speech recognition and natural language understanding. Based in Santa Clara, California, SoundHound focuses on embedding voice solutions across industries to enhance customer interactions through advanced AI technologies.
Key similarities and differences
Both Autodesk and SoundHound operate in the software application industry within the technology sector, focusing on innovative solutions to improve user experience. Autodesk targets design and engineering professionals with 3D software and cloud-based management tools, while SoundHound specializes in AI-driven voice interaction platforms. Their scale differs significantly, with Autodesk having a market cap of approximately 56.6B and 15,300 employees, compared to SoundHound’s 4.7B market cap and a workforce of 842.
Income Statement Comparison
The table below presents a side-by-side comparison of key income statement metrics for Autodesk, Inc. and SoundHound AI, Inc. for their most recent fiscal years.
| Metric | Autodesk, Inc. (ADSK) | SoundHound AI, Inc. (SOUN) |
|---|---|---|
| Market Cap | 56.6B | 4.7B |
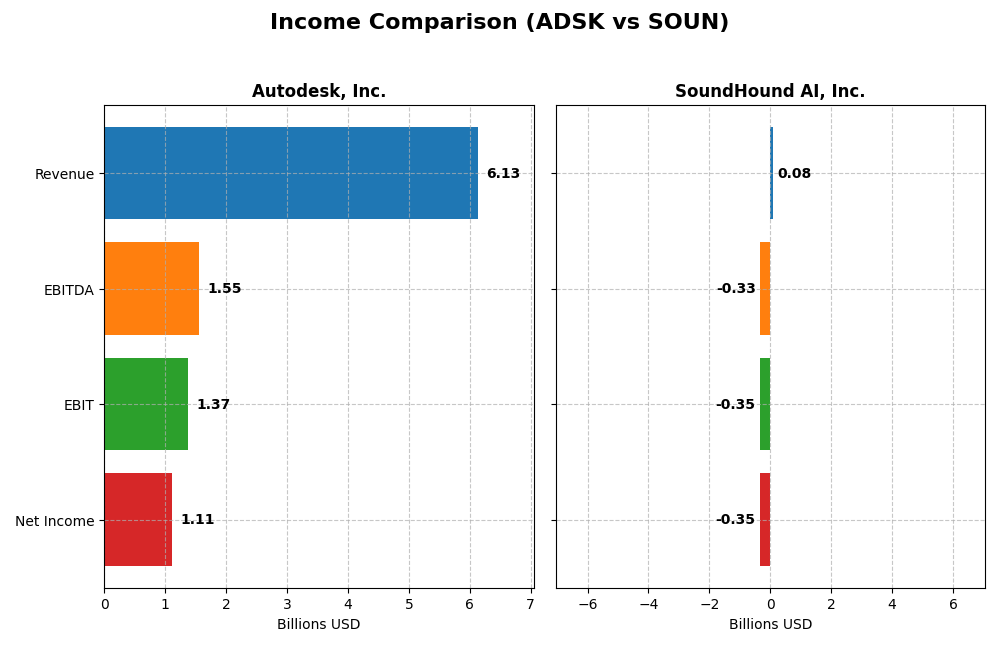
| Revenue | 6.13B | 85M |
| EBITDA | 1.55B | -329M |
| EBIT | 1.37B | -348M |
| Net Income | 1.11B | -351M |
| EPS | 5.17 | -1.04 |
| Fiscal Year | 2025 | 2024 |
Income Statement Interpretations
Autodesk, Inc.
Autodesk’s revenue exhibited a steady upward trend, growing 61.74% over 2021-2025 and reaching $6.13B in 2025. Net income showed variability, declining 7.95% overall but increasing 22.2% in the last year to $1.11B. Margins remained robust with a gross margin of 90.57% and net margin of 18.14%, both favorable. The recent year showed improved profitability and margin expansion.
SoundHound AI, Inc.
SoundHound’s revenue grew sharply by 550.63% from 2020 to 2024, hitting $84.7M in 2024. However, net income remained negative, falling 371.3% over the period with a loss of $351M in 2024. Margins were mixed: gross margin was favorable at 48.86%, but EBIT and net margins were deeply negative. The latest year saw strong revenue growth but worsening profitability and margin contraction.
Which one has the stronger fundamentals?
Autodesk demonstrates stronger fundamentals with stable, high margins and consistent profitability growth in 2025, reflecting operational efficiency and scale. Conversely, SoundHound shows impressive revenue acceleration but persistent losses and negative margins, indicating ongoing investment or operational challenges. Autodesk’s favorable income statement metrics outweigh SoundHound’s growth despite its unfavorable profitability profile.
Financial Ratios Comparison
The table below presents a side-by-side comparison of key financial ratios for Autodesk, Inc. (ADSK) and SoundHound AI, Inc. (SOUN) based on their most recent fiscal year data, enabling a clear view of their financial performance.
| Ratios | Autodesk, Inc. (ADSK) | SoundHound AI, Inc. (SOUN) |
|---|---|---|
| ROE | 42.4% | -191.9% |
| ROIC | 18.0% | -68.1% |
| P/E | 60.2 | -19.1 |
| P/B | 25.5 | 36.8 |
| Current Ratio | 0.68 | 3.77 |
| Quick Ratio | 0.68 | 3.77 |
| D/E | 0.98 | 0.02 |
| Debt-to-Assets | 23.6% | 0.8% |
| Interest Coverage | 0 | -28.1 |
| Asset Turnover | 0.57 | 0.15 |
| Fixed Asset Turnover | 21.4 | 14.3 |
| Payout ratio | 0 | 0 |
| Dividend yield | 0 | 0 |
Interpretation of the Ratios
Autodesk, Inc.
Autodesk shows a balanced ratio profile with strong returns: net margin at 18.14%, ROE at 42.43%, and ROIC at 18.01%, indicating robust profitability. However, high valuation multiples like a PE of 60.2 and PB of 25.54, plus a low current ratio of 0.68, suggest liquidity concerns. Autodesk does not pay dividends, focusing on reinvestment and growth.
SoundHound AI, Inc.
SoundHound AI’s ratios are mostly weak, with negative net margin (-414.06%), ROE (-191.99%), and ROIC (-68.13%), reflecting operational losses and inefficiency. Its high current ratio of 3.77 contrasts with poor asset turnover of 0.15. The company does not pay dividends, likely due to ongoing investment in R&D and growth during its early phase.
Which one has the best ratios?
Autodesk presents a more favorable ratio structure with strong profitability, efficient capital use, and manageable debt levels, despite some liquidity and valuation challenges. SoundHound AI exhibits mostly unfavorable financial ratios, reflecting its developmental stage and operational difficulties. Overall, Autodesk’s ratios appear stronger than SoundHound AI’s.
Strategic Positioning
This section compares the strategic positioning of Autodesk, Inc. and SoundHound AI, Inc., including market position, key segments, and exposure to technological disruption:
Autodesk, Inc.
- Large market cap of 56.6B with established software presence; faces competitive pressure in software applications.
- Diverse key segments: Architecture, Engineering, Construction, Manufacturing, Media, and AutoCAD software families drive revenues.
- Exposure to technological disruption moderate, focused on 3D design and engineering software innovation.
SoundHound AI, Inc.
- Smaller market cap of 4.7B; operates in a niche AI voice platform market with high competition.
- Revenue mainly from hosted services, licensing, and professional services focused on voice AI solutions.
- High exposure to AI and voice technology disruption due to evolving conversational platforms.
Autodesk, Inc. vs SoundHound AI, Inc. Positioning
Autodesk adopts a diversified strategy across multiple industries and software products, providing broad market coverage. SoundHound AI concentrates on voice AI technology, offering specialized solutions but with narrower segment focus and higher market volatility.
Which has the best competitive advantage?
Autodesk demonstrates a very favorable moat with growing ROIC above WACC, indicating durable competitive advantage and efficient capital use. SoundHound AI shows a slightly unfavorable moat, shedding value despite increasing profitability, reflecting a weaker competitive position.
Stock Comparison
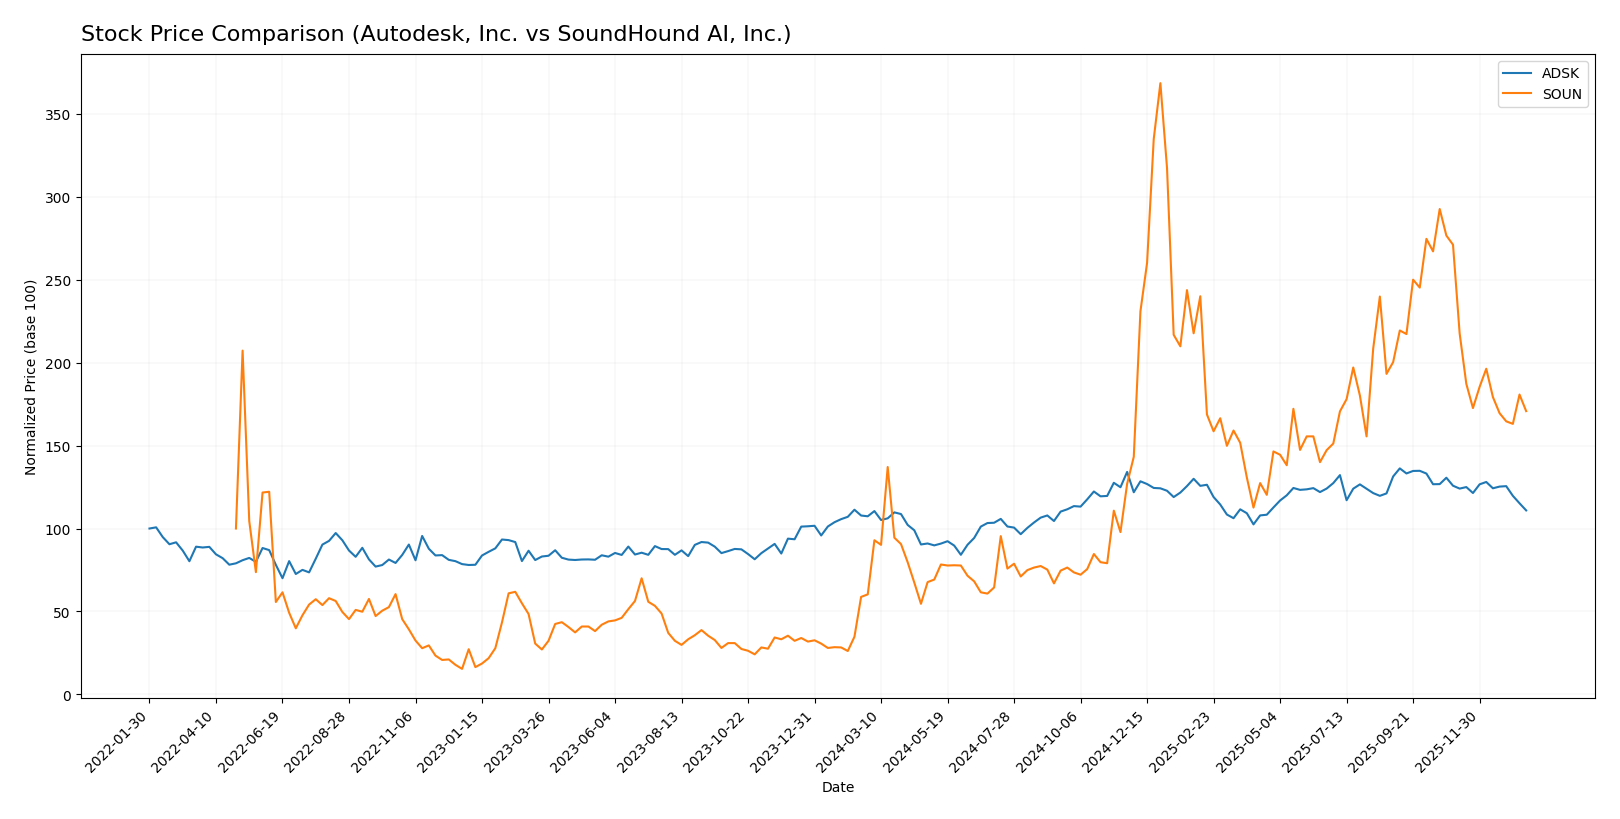
The stock price movements of Autodesk, Inc. (ADSK) and SoundHound AI, Inc. (SOUN) over the past 12 months reveal distinct bullish trends with varying degrees of price appreciation and recent downward momentum.
Trend Analysis
Autodesk, Inc. (ADSK) experienced a 3.3% price increase over the past year, indicating a bullish trend with decelerating momentum. The stock ranged between 201.6 and 326.37, showing moderate volatility with a standard deviation of 29.87.
SoundHound AI, Inc. (SOUN) posted a substantial 183.16% price increase over the same period, confirming a bullish trend despite deceleration. The stock fluctuated between 3.55 and 23.95, with lower volatility at a 4.66 standard deviation.
Comparing both, SOUN delivered the highest market performance with a far greater percentage gain than ADSK, although both have faced recent price declines since November 2025.
Target Prices
The target price consensus for Autodesk, Inc. and SoundHound AI, Inc. reflects optimistic analyst expectations.
| Company | Target High | Target Low | Consensus |
|---|---|---|---|
| Autodesk, Inc. | 400 | 343 | 373 |
| SoundHound AI, Inc. | 15 | 11 | 13.33 |
Analysts see Autodesk’s stock price rising significantly from its current $265.69, while SoundHound AI’s consensus target suggests moderate upside from $11.10.
Analyst Opinions Comparison
This section compares analysts’ ratings and grades for Autodesk, Inc. and SoundHound AI, Inc.:
Rating Comparison
Autodesk, Inc. Rating
- Rating: B-, considered very favorable overall.
- Discounted Cash Flow Score: Moderate at 3, indicating fair valuation.
- ROE Score: Very favorable at 5, showing strong profit generation from equity.
- ROA Score: Favorable at 4, demonstrating effective asset use.
- Debt To Equity Score: Very unfavorable at 1, suggesting high financial risk.
- Overall Score: Moderate at 3, reflecting a balanced financial standing.
SoundHound AI, Inc. Rating
- Rating: C-, also noted as very favorable overall.
- Discounted Cash Flow Score: Very unfavorable at 1, signaling poor valuation.
- ROE Score: Very unfavorable at 1, reflecting weak equity returns.
- ROA Score: Very unfavorable at 1, indicating poor asset utilization.
- Debt To Equity Score: Favorable at 4, indicating lower financial risk.
- Overall Score: Very unfavorable at 1, denoting weak overall performance.
Which one is the best rated?
Based strictly on the data, Autodesk has a higher overall score and better ratings in ROE, ROA, and discounted cash flow, despite a weaker debt-to-equity score. SoundHound scores lower overall but has a stronger debt-to-equity rating.
Scores Comparison
Here is a comparison of the key financial scores for Autodesk, Inc. and SoundHound AI, Inc.:
ADSK Scores
- Altman Z-Score: 5.05, indicating a safe zone status.
- Piotroski Score: 8, classified as very strong financial health.
SOUN Scores
- Altman Z-Score: 6.62, indicating a safe zone status.
- Piotroski Score: 3, classified as very weak financial health.
Which company has the best scores?
Both companies are in the safe zone based on their Altman Z-Scores, with SoundHound AI scoring higher. However, Autodesk has a much stronger Piotroski Score, indicating better overall financial strength compared to SoundHound AI.
Grades Comparison
The following presents a comparison of recent grades for Autodesk, Inc. and SoundHound AI, Inc.:
Autodesk, Inc. Grades
This table summarizes Autodesk’s latest grades from reputable grading companies as of late 2025:
| Grading Company | Action | New Grade | Date |
|---|---|---|---|
| Barclays | Maintain | Overweight | 2025-11-26 |
| Wells Fargo | Maintain | Overweight | 2025-11-26 |
| Deutsche Bank | Upgrade | Buy | 2025-11-26 |
| B of A Securities | Maintain | Neutral | 2025-11-26 |
| Rosenblatt | Maintain | Buy | 2025-11-26 |
| Macquarie | Maintain | Outperform | 2025-11-26 |
| BMO Capital | Maintain | Market Perform | 2025-11-26 |
| Baird | Maintain | Outperform | 2025-11-26 |
| Rosenblatt | Maintain | Buy | 2025-11-24 |
| Baird | Maintain | Outperform | 2025-11-18 |
Autodesk’s grades show a strong buy and outperform consensus with multiple maintains and one upgrade, reflecting positive analyst sentiment.
SoundHound AI, Inc. Grades
Below is the summary of SoundHound AI’s recent grades from recognized grading firms:
| Grading Company | Action | New Grade | Date |
|---|---|---|---|
| Piper Sandler | Maintain | Neutral | 2026-01-05 |
| Cantor Fitzgerald | Upgrade | Overweight | 2025-12-12 |
| DA Davidson | Maintain | Buy | 2025-11-18 |
| Piper Sandler | Maintain | Neutral | 2025-11-07 |
| HC Wainwright & Co. | Maintain | Buy | 2025-10-16 |
| HC Wainwright & Co. | Maintain | Buy | 2025-09-17 |
| Wedbush | Maintain | Outperform | 2025-09-11 |
| DA Davidson | Maintain | Buy | 2025-09-10 |
| Ladenburg Thalmann | Upgrade | Buy | 2025-08-11 |
| Wedbush | Maintain | Outperform | 2025-08-08 |
SoundHound AI’s grades indicate a consistent buy and outperform trend with recent upgrades from neutral and overweight ratings.
Which company has the best grades?
Both Autodesk and SoundHound AI share a “Buy” consensus rating, but Autodesk benefits from a larger number of buy and outperform grades across a more diversified set of grading companies. This broader positive analyst backing may offer investors a relatively stronger confirmation signal.
Strengths and Weaknesses
Below is a comparative overview of key strengths and weaknesses for Autodesk, Inc. (ADSK) and SoundHound AI, Inc. (SOUN) based on the latest financial and operational data.
| Criterion | Autodesk, Inc. (ADSK) | SoundHound AI, Inc. (SOUN) |
|---|---|---|
| Diversification | Highly diversified with multiple segments including Architecture, Manufacturing, and Media (largest segment $2.94B in 2025) | Limited diversification; revenue mainly from Hosted Services ($57M in 2024) with smaller Licensing and Professional Services |
| Profitability | Strong profitability; net margin 18.14%, ROIC 18.01%, creating value consistently | Negative profitability; net margin -414.06%, ROIC -68.13%, currently shedding value |
| Innovation | Established leader with durable competitive advantages and growing ROIC (+15.4%) | Emerging player with growing ROIC (+57.2%) but still unprofitable and value destroying |
| Global presence | Well-established global footprint across industries | Smaller scale, likely limited global reach given revenue size and niche market |
| Market Share | Significant market share in CAD and engineering software markets | Niche market presence in AI voice and speech recognition, still developing market position |
Key takeaways: Autodesk demonstrates a robust and diversified business model with solid profitability and a strong competitive moat, making it a more stable investment. SoundHound AI shows promising innovation and improving ROIC but remains unprofitable and riskier due to its limited scale and negative margins.
Risk Analysis
Below is a table summarizing key risks for Autodesk, Inc. (ADSK) and SoundHound AI, Inc. (SOUN) based on the most recent data:
| Metric | Autodesk, Inc. (ADSK) | SoundHound AI, Inc. (SOUN) |
|---|---|---|
| Market Risk | Moderate beta 1.47; tech sector volatility | High beta 2.88; highly volatile stock price |
| Debt level | Moderate debt-to-assets 23.6%, neutral D/E 0.98 | Very low debt 0.8%, favorable D/E 0.02 |
| Regulatory Risk | Moderate, typical for software industry | Moderate, emerging AI regulation potential |
| Operational Risk | Moderate, scale with 15.3K employees | Higher, smaller scale with 842 employees |
| Environmental Risk | Low to moderate, no direct exposure | Low, primarily software focused |
| Geopolitical Risk | Moderate, US-based with global customers | Moderate, US-based with international reach |
The most likely and impactful risks revolve around market volatility and operational scale differences. Autodesk’s mature position with strong financial health offsets some market risks, while SoundHound’s high beta and negative profitability present higher market and operational risks. SoundHound’s weak profitability and negative interest coverage also imply higher financial vulnerability despite low debt levels. Investors should weigh Autodesk’s stable yet moderately leveraged profile against SoundHound’s growth potential but elevated financial and market risks.
Which Stock to Choose?
Autodesk, Inc. (ADSK) shows a favorable income evolution with 12.7% revenue growth in 2025 and strong profitability metrics, including an 18.14% net margin and a 42.43% ROE. Its debt level is moderate, and the company holds a very favorable B- rating.
SoundHound AI, Inc. (SOUN) exhibits rapid revenue growth of 84.62% in 2024 but suffers from significant profitability challenges, with a -414.06% net margin and negative ROE. Its financial ratios largely appear unfavorable, though it holds a favorable C- rating despite value destruction.
For investors, Autodesk’s very favorable rating and robust income and ratio profile might appear more suitable for those seeking quality and stability. Conversely, SoundHound’s growth trajectory combined with profitability risks could be interpreted as more aligned with risk-tolerant, growth-focused profiles.
Disclaimer: Investment carries a risk of loss of initial capital. The past performance is not a reliable indicator of future results. Be sure to understand risks before making an investment decision.
Go Further
I encourage you to read the complete analyses of Autodesk, Inc. and SoundHound AI, Inc. to enhance your investment decisions: