In the dynamic world of technology, Shopify Inc. and Autodesk, Inc. stand out as leaders in software applications, yet they serve distinct yet overlapping markets. Shopify drives innovation in e-commerce platforms, empowering merchants globally, while Autodesk excels in 3D design and engineering software across multiple industries. This comparison explores their growth strategies and market positions to help you decide which company presents a more compelling investment opportunity in 2026.
Table of contents
Companies Overview
I will begin the comparison between Shopify Inc. and Autodesk, Inc. by providing an overview of these two companies and their main differences.
Shopify Inc. Overview
Shopify Inc. is a commerce company headquartered in Ottawa, Canada, offering a platform that enables merchants to manage and sell products through multiple sales channels such as web storefronts, physical locations, and social media. The company supports merchants with inventory management, payments, fulfillment, and analytics. Established in 2004, Shopify operates globally and focuses on facilitating e-commerce growth for businesses of all sizes.
Autodesk, Inc. Overview
Autodesk, Inc., based in San Rafael, California, provides 3D design, engineering, and entertainment software worldwide. Its product portfolio includes AutoCAD, BIM 360, Fusion 360, and other tools for architecture, engineering, manufacturing, and media industries. Founded in 1982, Autodesk targets professionals with solutions that span design, simulation, collaboration, and production tracking, distributed through direct sales and reseller networks.
Key similarities and differences
Both Shopify and Autodesk operate in the technology sector, specifically within application software, serving global markets. While Shopify focuses on e-commerce platforms and merchant solutions facilitating online and offline sales, Autodesk specializes in design and engineering software for professional industries. Their business models differ, with Shopify centered on enabling commerce for merchants, whereas Autodesk provides specialized tools for design and manufacturing workflows.
Income Statement Comparison
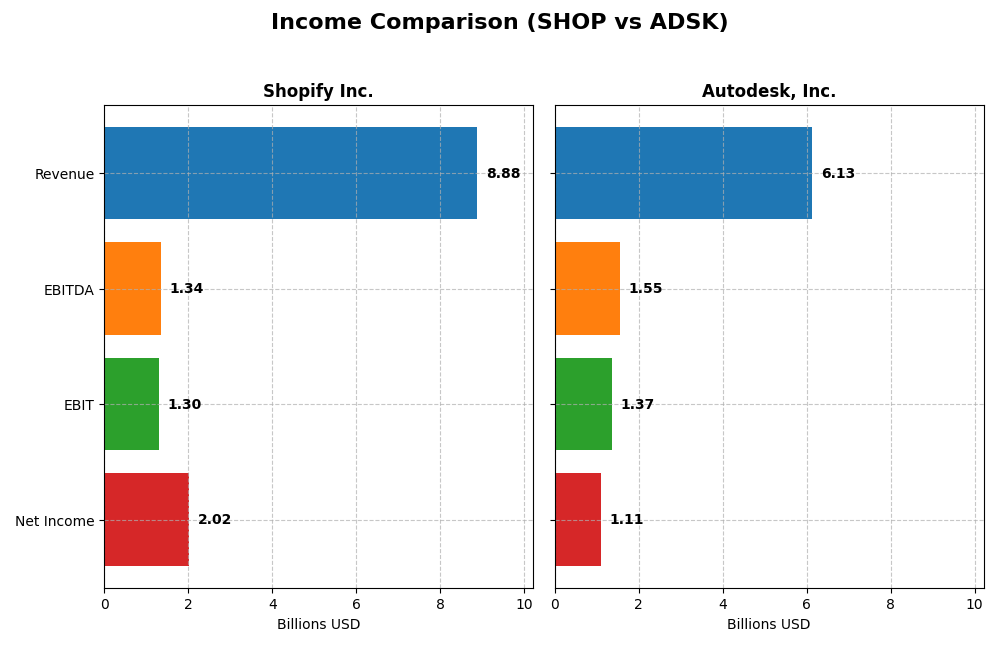
The table below compares key income statement metrics for Shopify Inc. and Autodesk, Inc. for their most recent fiscal years, providing a snapshot of their financial performance.
| Metric | Shopify Inc. (2024) | Autodesk, Inc. (2025) |
|---|---|---|
| Market Cap | 205.3B | 56.5B |
| Revenue | 8.88B | 6.13B |
| EBITDA | 1.34B | 1.55B |
| EBIT | 1.30B | 1.37B |
| Net Income | 2.02B | 1.11B |
| EPS | 1.56 | 5.17 |
| Fiscal Year | 2024 | 2025 |
Income Statement Interpretations
Shopify Inc.
Shopify’s revenue demonstrated strong growth from $2.9B in 2020 to $8.9B in 2024, with net income rebounding sharply from a $3.46B loss in 2022 to a $2.02B profit in 2024. Margins improved significantly, with a gross margin over 50% and net margin rising to 22.7%. The latest year showed accelerated revenue and margin expansion, reflecting robust operational recovery.
Autodesk, Inc.
Autodesk’s revenue increased steadily from $3.8B in 2021 to $6.1B in 2025, with net income peaking at $1.21B in 2021 but declining to $1.11B in 2025. Gross margin remained very high at 90.6%, and net margin was 18.1%. Despite consistent revenue growth, net income and margin growth showed some weakening over the overall period, though the latest year maintained favorable earnings expansion.
Which one has the stronger fundamentals?
Both companies exhibit favorable income statement attributes, but Shopify shows more pronounced revenue and net income growth, alongside improving margins and profitability after prior losses. Autodesk maintains higher gross margins and stable net margins but reveals some challenges with net income and margin declines over time. Shopify’s recovery and margin improvements suggest stronger momentum in fundamentals.
Financial Ratios Comparison
This table presents a side-by-side comparison of key financial ratios for Shopify Inc. (SHOP) and Autodesk, Inc. (ADSK) based on their most recent fiscal year data.
| Ratios | Shopify Inc. (2024) | Autodesk, Inc. (2025) |
|---|---|---|
| ROE | 17.5% | 42.4% |
| ROIC | 7.5% | 18.0% |
| P/E | 68.2 | 60.2 |
| P/B | 11.9 | 25.5 |
| Current Ratio | 3.71 | 0.68 |
| Quick Ratio | 3.70 | 0.68 |
| D/E | 0.097 | 0.976 |
| Debt-to-Assets | 8.1% | 23.6% |
| Interest Coverage | 0 | 0 |
| Asset Turnover | 0.64 | 0.57 |
| Fixed Asset Turnover | 63.4 | 21.4 |
| Payout Ratio | 0 | 0 |
| Dividend Yield | 0 | 0 |
Interpretation of the Ratios
Shopify Inc.
Shopify shows a balanced profile with favorable net margin (22.74%) and return on equity (17.47%), but its high price-to-earnings (68.18) and price-to-book (11.91) ratios are concerning. The current ratio of 3.71 is flagged unfavorable despite a strong quick ratio. Shopify does not pay dividends, likely prioritizing growth and reinvestment over payouts.
Autodesk, Inc.
Autodesk demonstrates strong profitability with a 42.43% return on equity and solid net margin of 18.14%. However, liquidity ratios are weak, with current and quick ratios near 0.68. Its price multiples are high, and debt-to-equity is neutral. Like Shopify, Autodesk pays no dividends, focusing on reinvestment and R&D instead of shareholder distributions.
Which one has the best ratios?
Shopify’s ratios are slightly more favorable overall, with half rated positively compared to Autodesk’s 42.86%. Shopify’s liquidity and leverage ratios are stronger, though both face high valuation multiples and neither pays dividends. Autodesk shows higher profitability but weaker liquidity, resulting in a neutral global opinion against Shopify’s slight advantage.
Strategic Positioning
This section compares the strategic positioning of Shopify Inc. and Autodesk, Inc. across market position, key segments, and exposure to technological disruption:
Shopify Inc.
- Leading commerce platform with 205B market cap, high beta indicates strong competitive pressure.
- Focuses on commerce services including subscriptions and merchant solutions as main revenue drivers.
- Platform-based business exposed to evolving e-commerce technologies and digital payment innovations.
Autodesk, Inc.
- Software leader in 3D design and engineering with 56B market cap, facing moderate competitive pressure.
- Diversified segments including architecture, manufacturing, media, and CAD software drive business.
- Relies on advanced design and cloud-based construction software, continuously adapting to tech changes.
Shopify Inc. vs Autodesk, Inc. Positioning
Shopify operates a concentrated commerce platform primarily driven by merchant and subscription solutions, enabling global sales channels. Autodesk maintains a diversified portfolio across design, manufacturing, and entertainment software, spreading risks across multiple professional industries.
Which has the best competitive advantage?
Autodesk demonstrates a very favorable moat with ROIC exceeding WACC and growing profitability, indicating durable competitive advantage. Shopify’s slightly unfavorable moat suggests value destruction despite improving ROIC, reflecting a less stable competitive position.
Stock Comparison
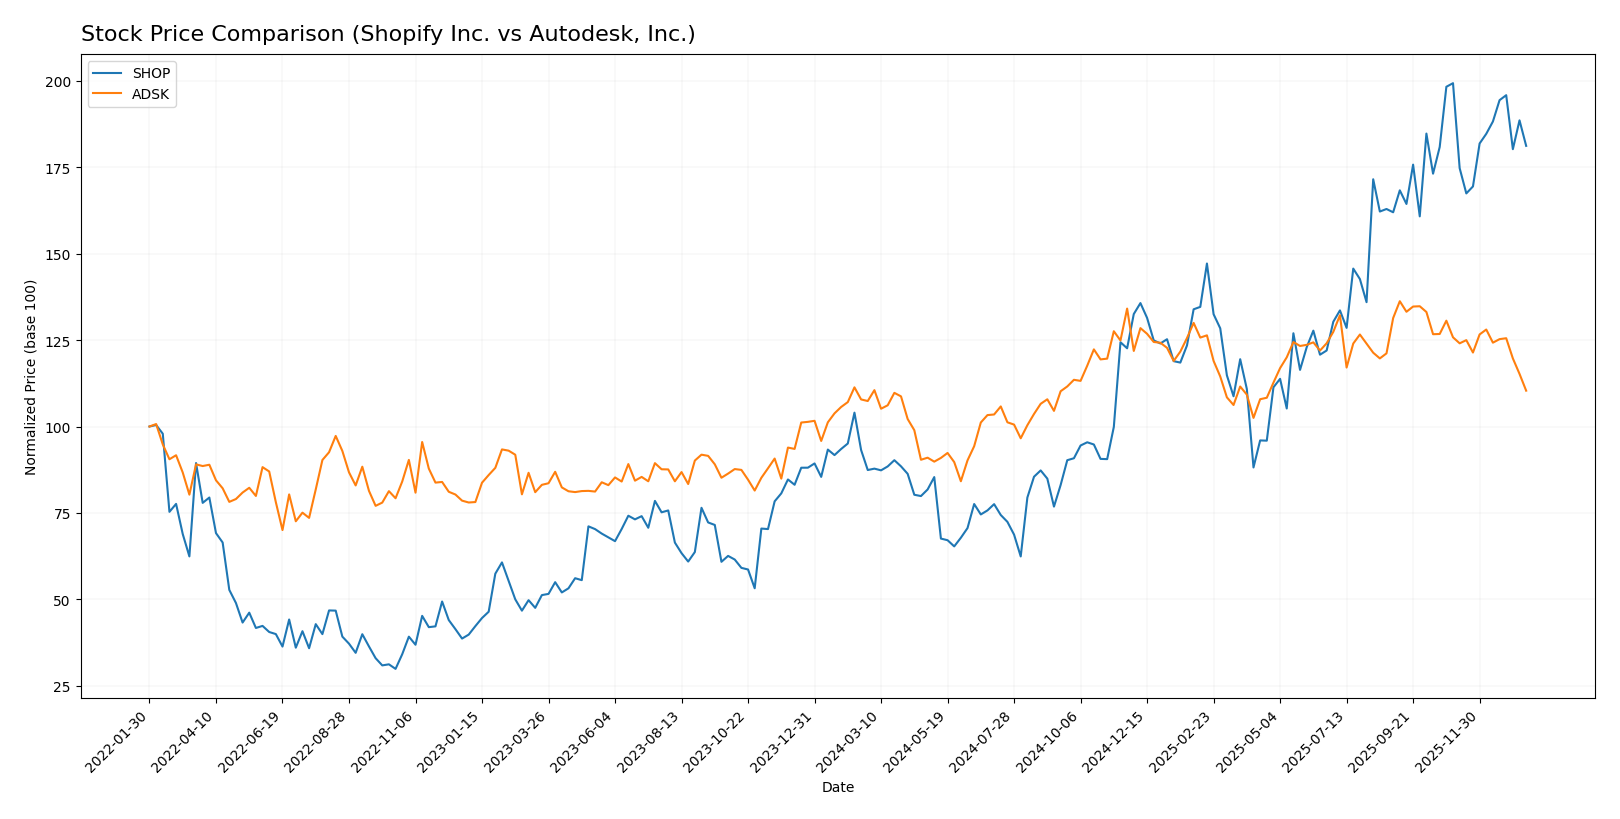
The stock price movements of Shopify Inc. and Autodesk, Inc. over the past year reveal significant divergences, with Shopify showing strong gains and Autodesk maintaining a marginal upward trajectory amidst recent declines.
Trend Analysis
Shopify Inc. exhibits a bullish trend with a 107.29% price increase over the past 12 months, although momentum is decelerating. Its price ranged from 54.43 to 173.86, with notable volatility reflected in a 33.71 standard deviation.
Autodesk, Inc. also shows a bullish trend with a modest 2.79% gain over the same period, accompanied by decelerating growth. The stock fluctuated between 201.6 and 326.37, with slightly lower volatility at a 29.88 standard deviation.
Comparatively, Shopify outperformed Autodesk significantly in market performance over the past year, with a much higher percentage gain despite both showing slowing acceleration.
Target Prices
Analysts present a bullish consensus for both Shopify Inc. and Autodesk, Inc., indicating potential upside from current prices.
| Company | Target High | Target Low | Consensus |
|---|---|---|---|
| Shopify Inc. | 200 | 140 | 186.24 |
| Autodesk, Inc. | 400 | 343 | 373 |
The target consensus for Shopify at 186.24 suggests a moderate upside compared to its current price of 157.68 USD, while Autodesk’s consensus of 373 indicates a strong potential gain from the current 264.63 USD.
Analyst Opinions Comparison
This section compares analysts’ ratings and grades for Shopify Inc. and Autodesk, Inc.:
Rating Comparison
Shopify Inc. Rating
- Rating: B, considered very favorable overall.
- Discounted Cash Flow Score: 2, moderate value.
- ROE Score: 4, favorable profitability.
- ROA Score: 5, very favorable asset use.
- Debt To Equity Score: 3, moderate financial risk.
- Overall Score: 3, moderate overall performance.
Autodesk, Inc. Rating
- Rating: B-, also very favorable overall.
- Discounted Cash Flow Score: 3, moderate value.
- ROE Score: 5, very favorable profitability.
- ROA Score: 4, favorable asset use.
- Debt To Equity Score: 1, very unfavorable financial risk.
- Overall Score: 3, moderate overall performance.
Which one is the best rated?
Based strictly on the provided data, Shopify holds a higher debt-to-equity score indicating lower financial risk, while Autodesk scores higher in ROE but has weaker debt management. Overall, both have the same overall score of 3, making their ratings comparable but highlighting different strengths and weaknesses.
Scores Comparison
Here is a comparison of the Altman Z-Score and Piotroski Score for Shopify and Autodesk:
SHOP Scores
- Altman Z-Score: 50.42, indicating a safe zone status.
- Piotroski Score: 6, reflecting average financial strength.
ADSK Scores
- Altman Z-Score: 5.05, indicating a safe zone status.
- Piotroski Score: 8, reflecting very strong financial strength.
Which company has the best scores?
Based strictly on the provided data, Autodesk has a lower Altman Z-Score but still safely in the safe zone and a higher Piotroski Score, indicating stronger financial health than Shopify.
Grades Comparison
Here is a comparison of the recent grades and ratings for Shopify Inc. and Autodesk, Inc.:
Shopify Inc. Grades
The following table summarizes recent grade updates from recognized financial institutions for Shopify Inc.:
| Grading Company | Action | New Grade | Date |
|---|---|---|---|
| Scotiabank | Upgrade | Sector Outperform | 2026-01-08 |
| Wolfe Research | Downgrade | Peer Perform | 2026-01-06 |
| Wells Fargo | Maintain | Overweight | 2025-12-17 |
| Truist Securities | Maintain | Hold | 2025-11-05 |
| CIBC | Maintain | Outperform | 2025-11-05 |
| Cantor Fitzgerald | Maintain | Neutral | 2025-11-05 |
| DA Davidson | Maintain | Buy | 2025-11-05 |
| Scotiabank | Maintain | Sector Perform | 2025-11-05 |
| Needham | Maintain | Buy | 2025-11-05 |
| JP Morgan | Maintain | Overweight | 2025-11-05 |
Shopify’s grades show a mix of mostly positive ratings with some recent upgrades and downgrades, indicating a generally favorable but somewhat cautious outlook.
Autodesk, Inc. Grades
The following table details recent grades and rating actions for Autodesk, Inc.:
| Grading Company | Action | New Grade | Date |
|---|---|---|---|
| Macquarie | Maintain | Outperform | 2025-11-26 |
| BMO Capital | Maintain | Market Perform | 2025-11-26 |
| Wells Fargo | Maintain | Overweight | 2025-11-26 |
| Deutsche Bank | Upgrade | Buy | 2025-11-26 |
| Rosenblatt | Maintain | Buy | 2025-11-26 |
| Baird | Maintain | Outperform | 2025-11-26 |
| B of A Securities | Maintain | Neutral | 2025-11-26 |
| Barclays | Maintain | Overweight | 2025-11-26 |
| Rosenblatt | Maintain | Buy | 2025-11-24 |
| Baird | Maintain | Outperform | 2025-11-18 |
Autodesk’s grades consistently reflect strong buy and outperform recommendations, with a recent upgrade reinforcing a positive consensus.
Which company has the best grades?
Both Shopify Inc. and Autodesk, Inc. have a consensus “Buy” rating with numerous buy and outperform grades. Autodesk displays a more consistent pattern of high ratings and recent upgrades, potentially signaling stronger current analyst confidence, which may influence investor sentiment toward more stability in Autodesk’s outlook.
Strengths and Weaknesses
Below is a comparison table highlighting the key strengths and weaknesses of Shopify Inc. (SHOP) and Autodesk, Inc. (ADSK) based on the most recent financial and strategic data.
| Criterion | Shopify Inc. (SHOP) | Autodesk, Inc. (ADSK) |
|---|---|---|
| Diversification | Moderate product range focused on e-commerce services and subscriptions | Well diversified across architecture, manufacturing, media, and emerging tech |
| Profitability | Net margin 22.74%, ROE 17.47%, but ROIC below WACC, indicating value destruction | Net margin 18.14%, ROE 42.43%, ROIC well above WACC, strong value creation |
| Innovation | Growing ROIC trend indicates improving efficiency and innovation | Durable competitive advantage with steady ROIC growth |
| Global presence | Strong presence in e-commerce markets globally | Broad global footprint in multiple industrial sectors |
| Market Share | Leading platform in e-commerce solutions but high valuation metrics may pressure growth | Leader in CAD and design software with solid market dominance |
Key takeaways: Autodesk demonstrates a stronger economic moat with efficient capital use and higher profitability, while Shopify shows improving profitability but currently destroys value relative to its cost of capital. Autodesk’s broader diversification and durable competitive advantage make it a more stable investment choice in 2026.
Risk Analysis
Below is a comparative table highlighting key risks for Shopify Inc. and Autodesk, Inc. based on the most recent financial and market data available for 2025-2026:
| Metric | Shopify Inc. (SHOP) | Autodesk, Inc. (ADSK) |
|---|---|---|
| Market Risk | High beta at 2.84 indicates high volatility risk | Moderate beta at 1.47 suggests moderate market sensitivity |
| Debt level | Low debt-to-equity at 0.1, low financial leverage | Higher debt-to-equity near 0.98, moderate financial risk |
| Regulatory Risk | Moderate, with global e-commerce regulations evolving | Moderate, tech industry compliance and export controls apply |
| Operational Risk | Platform dependency and intense competition | Software innovation and subscription model retention challenges |
| Environmental Risk | Low direct impact, some supply chain exposure | Moderate, sustainability demands in software and hardware use |
| Geopolitical Risk | Exposure to global markets including emerging regions | Exposure to US-China trade tensions and global distribution |
The most impactful risks for Shopify are its high market volatility and the challenge to maintain growth amid intense competition in e-commerce platforms. Autodesk faces significant financial leverage risk and geopolitical exposure, especially related to supply chains and international software sales. Both companies remain in a safe financial zone but require monitoring of external risks and debt management.
Which Stock to Choose?
Shopify Inc. (SHOP) shows a strong income evolution with 203% revenue growth over five years and consistently favorable profitability metrics. Its financial ratios are slightly favorable, supported by low debt levels and a very favorable rating of B. However, its return on invested capital (ROIC) is below the cost of capital, indicating value destruction despite improving profitability.
Autodesk, Inc. (ADSK) exhibits steady income growth with a 12.7% revenue increase in the last year and favorable profitability ratios, including a high ROE of 42.4%. The company carries higher debt levels with a neutral debt-to-equity ratio but demonstrates a very favorable moat status and a solid B- rating, supported by very strong Piotroski scores and safe Altman Z-scores.
Investors focused on growth might find Shopify’s rapidly improving income statement and moderate financial ratios appealing, while those prioritizing quality and durable competitive advantage could see Autodesk’s strong profitability and very favorable moat status as attractive. The choice could depend on tolerance for financial leverage and preference between rapid growth versus stable value creation.
Disclaimer: Investment carries a risk of loss of initial capital. The past performance is not a reliable indicator of future results. Be sure to understand risks before making an investment decision.
Go Further
I encourage you to read the complete analyses of Shopify Inc. and Autodesk, Inc. to enhance your investment decisions: