In the dynamic world of technology, Salesforce, Inc. (CRM) and Autodesk, Inc. (ADSK) stand out as leaders in software innovation, serving diverse but overlapping industries. Salesforce excels in customer relationship management with a vast cloud platform, while Autodesk specializes in 3D design and engineering software. This comparison explores their market positions and innovation strategies to help you decide which company offers the most compelling investment opportunity in 2026.
Table of contents
Companies Overview
I will begin the comparison between Salesforce and Autodesk by providing an overview of these two companies and their main differences.
Salesforce Overview
Salesforce, Inc. specializes in customer relationship management technology, aiming to connect companies and customers globally. Its Customer 360 platform supports collaborative and personalized customer experiences across sales, service, marketing, and commerce. The company also integrates analytics, app development, and engagement tools like Slack, serving diverse industries from financial services to healthcare. Headquartered in San Francisco, Salesforce employs over 76K people and trades on the NYSE.
Autodesk Overview
Autodesk, Inc. delivers 3D design, engineering, and entertainment software globally, targeting professionals in architecture, construction, manufacturing, and media. Its product suite includes AutoCAD, Fusion 360, BIM 360, and creative tools like Maya and 3ds Max, supporting design, simulation, and production tracking. Based in San Rafael, Autodesk has around 15.3K employees and is listed on NASDAQ. It sells directly and via resellers.
Key similarities and differences
Both Salesforce and Autodesk operate in the technology sector focusing on software applications but serve different market niches: Salesforce emphasizes customer relationship management platforms, while Autodesk provides design and engineering software. Salesforce’s offerings are broad, including analytics and communication tools, whereas Autodesk concentrates on 3D modeling and production software. Each company leverages direct and partner sales channels but differs substantially in employee scale and market capitalization.
Income Statement Comparison
The table below compares key income statement metrics for Salesforce, Inc. and Autodesk, Inc. for their most recent fiscal year, providing a snapshot of their financial performance.
| Metric | Salesforce, Inc. (CRM) | Autodesk, Inc. (ADSK) |
|---|---|---|
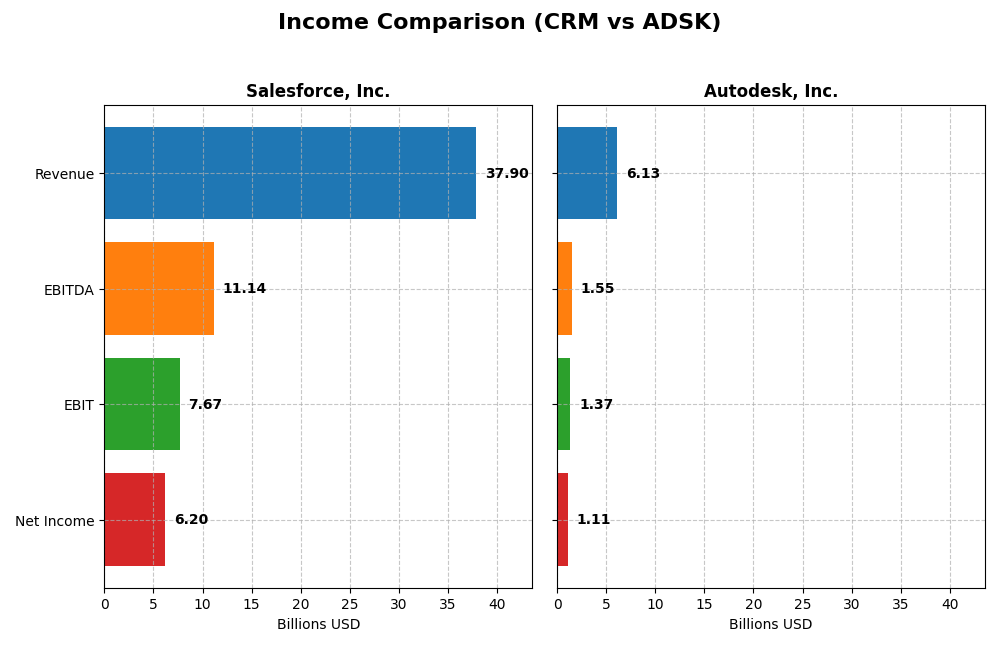
| Market Cap | 219B | 56.3B |
| Revenue | 37.9B | 6.13B |
| EBITDA | 11.1B | 1.55B |
| EBIT | 7.67B | 1.37B |
| Net Income | 6.20B | 1.11B |
| EPS | 6.44 | 5.17 |
| Fiscal Year | 2025 | 2025 |
Income Statement Interpretations
Salesforce, Inc.
Salesforce has shown strong revenue growth from $21.3B in 2021 to $37.9B in 2025, with net income rising from $4.07B to $6.2B over the same period. Gross and EBIT margins remained favorable, demonstrating efficient cost control. In 2025, revenue growth slowed slightly to 8.7%, but net margin and EPS improved significantly, reflecting enhanced profitability.
Autodesk, Inc.
Autodesk’s revenue increased steadily from $3.79B in 2021 to $6.13B in 2025, with net income fluctuating and declining overall from $1.21B to $1.11B. Margins remain robust, especially gross margin at over 90%. The latest year showed 12.7% revenue growth with moderate net margin expansion, but overall net income and EPS declined over the five years.
Which one has the stronger fundamentals?
Salesforce exhibits broader revenue and net income growth with high margin stability and rapid EPS gains, though it faces a slight net margin contraction over the period. Autodesk maintains superior gross margins and consistent revenue growth but reveals unfavorable trends in net income and EPS long term. Both companies have favorable income statements, but Salesforce’s overall growth and profitability metrics appear more robust.
Financial Ratios Comparison
The table below presents a side-by-side comparison of key financial ratios for Salesforce, Inc. (CRM) and Autodesk, Inc. (ADSK) based on the most recent fiscal year 2025 data available.
| Ratios | Salesforce, Inc. (CRM) | Autodesk, Inc. (ADSK) |
|---|---|---|
| ROE | 10.13% | 42.43% |
| ROIC | 7.95% | 18.01% |
| P/E | 53.04 | 60.20 |
| P/B | 5.37 | 25.54 |
| Current Ratio | 1.06 | 0.68 |
| Quick Ratio | 1.06 | 0.68 |
| D/E | 0.19 | 0.98 |
| Debt-to-Assets | 11.07% | 23.62% |
| Interest Coverage | 26.49 | 0 |
| Asset Turnover | 0.37 | 0.57 |
| Fixed Asset Turnover | 7.03 | 21.44 |
| Payout Ratio | 24.80% | 0 |
| Dividend Yield | 0.47% | 0 |
Interpretation of the Ratios
Salesforce, Inc.
Salesforce shows a mixed ratio profile with favorable net margin and strong interest coverage, but unfavorable high price multiples and asset turnover. Its debt levels are low and well-managed, supporting financial stability. The company pays dividends with a low 0.47% yield, suggesting modest shareholder returns, balanced by cautious payout coverage and limited repurchase risks.
Autodesk, Inc.
Autodesk’s ratios reveal robust profitability and returns, particularly in ROE and ROIC, but a weak liquidity position with low current and quick ratios. Debt levels are moderate but manageable, with excellent interest coverage. The company does not pay dividends, likely prioritizing reinvestment and growth, indicated by strong operational returns and likely emphasis on R&D.
Which one has the best ratios?
Salesforce’s ratios reflect a slightly favorable outlook with solid financial stability, though challenged by valuation concerns. Autodesk presents stronger profitability but suffers from liquidity weaknesses and higher valuation multiples. Overall, Salesforce offers a more balanced ratio profile, while Autodesk’s higher risks in liquidity and valuation temper its favorable returns.
Strategic Positioning
This section compares the strategic positioning of Salesforce and Autodesk, including market position, key segments, and exposure to technological disruption:
Salesforce, Inc.
- Leading CRM software provider with strong competitive pressure in enterprise software market.
- Diverse segments: Sales Cloud, Service Cloud, Marketing, Commerce, Analytics, Platform, and Professional Services.
- Exposure to disruption through integration, analytics, and cloud platform innovation in customer relationship management.
Autodesk, Inc.
- Specialist in 3D design and engineering software facing competitive pressure in CAD and construction sectors.
- Focused segments: Architecture, Engineering & Construction, AutoCAD family, Manufacturing, Media & Entertainment.
- Exposure to disruption in cloud-based construction management and 3D CAD technologies.
Salesforce vs Autodesk Positioning
Salesforce has a diversified business model across multiple customer engagement and analytics platforms, offering broad industry reach. Autodesk concentrates on design and engineering software with specialized industry focus, which may limit diversification but enhances domain expertise.
Which has the best competitive advantage?
Autodesk demonstrates a very favorable moat with ROIC significantly above WACC and growing profitability, indicating durable competitive advantage. Salesforce shows a slightly unfavorable moat, shedding value despite growing ROIC, reflecting weaker competitive advantage.
Stock Comparison
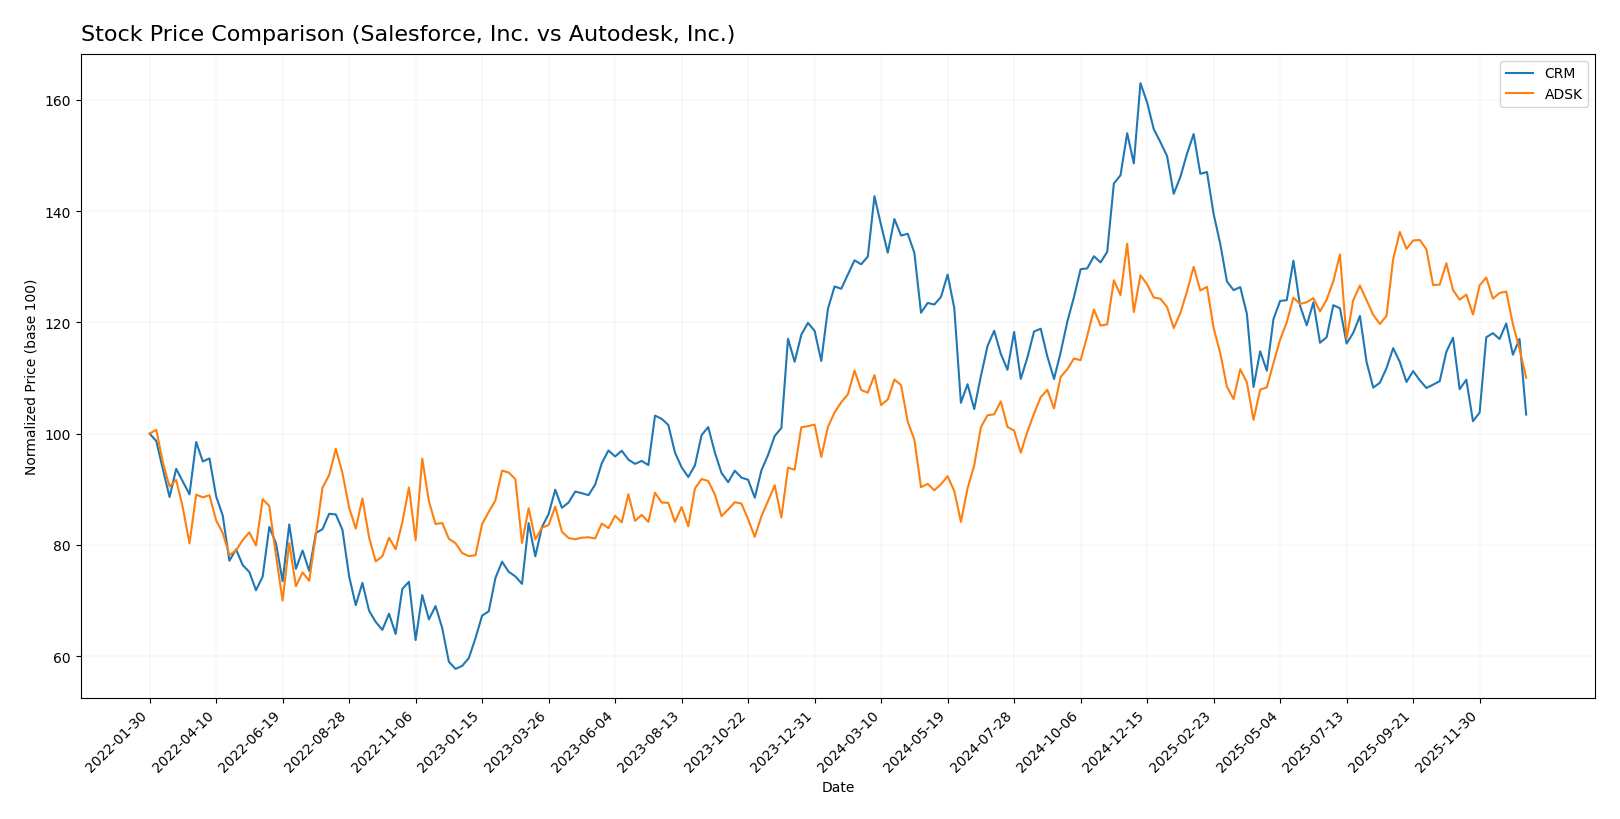
The stock price movements of Salesforce, Inc. (CRM) and Autodesk, Inc. (ADSK) over the past year reveal contrasting trends, with CRM showing a significant decline amid accelerating bearish momentum, while ADSK exhibits a slight bullish increase but recent weakening.
Trend Analysis
Salesforce, Inc. (CRM) experienced a -21.53% price change over the past 12 months, indicating a bearish trend with accelerating decline and a high volatility level of 31.78. The stock ranged between 227.11 and 361.99 during this period.
Autodesk, Inc. (ADSK) posted a 2.49% price increase over the same timeframe, signaling a bullish trend with deceleration. Its price fluctuated from 201.6 to 326.37, with volatility measured at 29.88.
Comparing both, Autodesk delivered the highest market performance with a mild bullish trend, while Salesforce showed a pronounced bearish trend and greater price depreciation over the past year.
Target Prices
Analysts show a positive outlook with clear target price ranges for both Salesforce, Inc. and Autodesk, Inc.
| Company | Target High | Target Low | Consensus |
|---|---|---|---|
| Salesforce, Inc. | 400 | 250 | 324.17 |
| Autodesk, Inc. | 400 | 343 | 373 |
The consensus targets for Salesforce and Autodesk are significantly above their current stock prices of $229.18 and $263.50, respectively, indicating expected upward potential from analysts based on their latest evaluations.
Analyst Opinions Comparison
This section compares analysts’ ratings and grades for Salesforce, Inc. and Autodesk, Inc.:
Rating Comparison
Salesforce, Inc. Rating
- Rating: B+, classified as Very Favorable by analysts.
- Discounted Cash Flow Score: 4, indicating a Favorable valuation.
- ROE Score: 4, reflecting Favorable profitability from equity.
- ROA Score: 4, Favorable asset utilization.
- Debt To Equity Score: 3, assessed as Moderate financial risk.
- Overall Score: 3, reflecting a Moderate overall rating.
Autodesk, Inc. Rating
- Rating: B-, also classified as Very Favorable.
- Discounted Cash Flow Score: 3, indicating a Moderate valuation.
- ROE Score: 5, indicating Very Favorable profitability from equity.
- ROA Score: 4, similarly Favorable asset utilization.
- Debt To Equity Score: 1, assessed as Very Unfavorable financial risk.
- Overall Score: 3, also reflecting a Moderate overall rating.
Which one is the best rated?
Salesforce holds a higher overall rating (B+) and stronger discounted cash flow and debt-to-equity scores, while Autodesk excels in return on equity but shows higher financial risk. Based strictly on the data, Salesforce is better rated overall.
Scores Comparison
The comparison of Salesforce and Autodesk scores highlights their financial stability and strength metrics:
Salesforce Scores
- Altman Z-Score: 5.26, indicating a safe zone status.
- Piotroski Score: 7, reflecting strong financial health.
Autodesk Scores
- Altman Z-Score: 5.05, indicating a safe zone status.
- Piotroski Score: 8, reflecting very strong financial health.
Which company has the best scores?
Autodesk has a slightly lower Altman Z-Score but a higher Piotroski Score compared to Salesforce. Based solely on the scores, Autodesk shows stronger financial health according to the Piotroski metric.
Grades Comparison
Here is the comparison of recent grades and ratings for Salesforce, Inc. and Autodesk, Inc.:
Salesforce, Inc. Grades
The table below summarizes recent grades from notable financial institutions for Salesforce, Inc.:
| Grading Company | Action | New Grade | Date |
|---|---|---|---|
| Barclays | Maintain | Overweight | 2026-01-12 |
| RBC Capital | Maintain | Sector Perform | 2026-01-05 |
| Morgan Stanley | Maintain | Overweight | 2025-12-09 |
| Citigroup | Maintain | Neutral | 2025-12-08 |
| DA Davidson | Maintain | Neutral | 2025-12-05 |
| Citizens | Maintain | Market Outperform | 2025-12-04 |
| Deutsche Bank | Maintain | Buy | 2025-12-04 |
| Wedbush | Maintain | Outperform | 2025-12-04 |
| Northland Capital Markets | Maintain | Market Perform | 2025-12-04 |
| Canaccord Genuity | Maintain | Buy | 2025-12-04 |
Salesforce’s grades predominantly indicate a positive outlook with multiple “Buy,” “Overweight,” and “Outperform” ratings maintained recently.
Autodesk, Inc. Grades
The table below presents recent grades from credible grading companies for Autodesk, Inc.:
| Grading Company | Action | New Grade | Date |
|---|---|---|---|
| Macquarie | Maintain | Outperform | 2025-11-26 |
| BMO Capital | Maintain | Market Perform | 2025-11-26 |
| Wells Fargo | Maintain | Overweight | 2025-11-26 |
| Deutsche Bank | Upgrade | Buy | 2025-11-26 |
| Rosenblatt | Maintain | Buy | 2025-11-26 |
| Baird | Maintain | Outperform | 2025-11-26 |
| B of A Securities | Maintain | Neutral | 2025-11-26 |
| Barclays | Maintain | Overweight | 2025-11-26 |
| Rosenblatt | Maintain | Buy | 2025-11-24 |
| Baird | Maintain | Outperform | 2025-11-18 |
Autodesk’s ratings also show a favorable trend, with a recent upgrade to “Buy” by Deutsche Bank and multiple “Outperform” and “Buy” grades.
Which company has the best grades?
Both Salesforce and Autodesk have predominantly positive grades with buy-side recommendations. Salesforce has a larger number of “Buy” and “Overweight” ratings sustained by more institutions, whereas Autodesk shows consistent “Outperform” and recent upgrades. Investors may interpret Salesforce’s broader consensus as stronger endorsement, potentially influencing confidence and portfolio decisions.
Strengths and Weaknesses
Below is a comparative table highlighting the key strengths and weaknesses of Salesforce, Inc. (CRM) and Autodesk, Inc. (ADSK) based on recent financial and market data:
| Criterion | Salesforce, Inc. (CRM) | Autodesk, Inc. (ADSK) |
|---|---|---|
| Diversification | Highly diversified product portfolio across multiple cloud services with growing revenue streams | Focused on architecture, manufacturing, and design software; less diversified but specialized segments |
| Profitability | Moderate profitability; net margin 16.35%, ROIC 7.95% (slightly unfavorable moat) | Strong profitability; net margin 18.14%, ROIC 18.01%, very favorable moat |
| Innovation | Strong innovation evidenced by growing ROIC trend and expanding platform services | Consistent innovation with durable competitive advantage and increasing profitability |
| Global presence | Extensive global footprint with strong cloud adoption worldwide | Solid global presence, especially in architecture and manufacturing verticals |
| Market Share | Leading market share in CRM and cloud software but challenged by competition and high valuation multiples (PE 53.04) | Leading market share in design software with high ROE (42.43%) but high valuation multiples (PE 60.2) |
In summary, Autodesk demonstrates a more favorable profitability and competitive moat with strong innovation and focused market segments. Salesforce offers broad diversification and solid global reach but faces challenges in value creation and high valuation, requiring cautious risk management.
Risk Analysis
Below is a comparison table summarizing key risks associated with Salesforce, Inc. (CRM) and Autodesk, Inc. (ADSK) based on their most recent financial and market data.
| Metric | Salesforce, Inc. (CRM) | Autodesk, Inc. (ADSK) |
|---|---|---|
| Market Risk | Beta 1.27; moderately sensitive to market swings | Beta 1.47; higher volatility than CRM |
| Debt level | Low debt-to-equity ratio (0.19); favorable leverage | Higher debt-to-equity (0.98); moderate leverage risk |
| Regulatory Risk | Moderate, due to global operations and data privacy laws | Moderate, with exposure to international regulations |
| Operational Risk | Large workforce (76K); complexity in integrating acquisitions (e.g., Slack) | Smaller workforce (15.3K); reliance on continuous innovation |
| Environmental Risk | Moderate; technology sector exposure to energy use and e-waste | Moderate; focus on sustainable design software but manufacturing impact possible |
| Geopolitical Risk | Moderate; global customer base subject to trade tensions | Moderate; supply chain and international sales could be affected |
Salesforce’s moderate market risk and low debt provide some stability, but its high valuation multiples and integration challenges pose risks. Autodesk shows higher market volatility and leverage, increasing financial risk, though it maintains strong profitability and innovation. Geopolitical uncertainties and regulatory changes remain common risks for both.
Which Stock to Choose?
Salesforce, Inc. (CRM) shows a strong income evolution with 8.72% revenue growth in 2025 and favorable profitability metrics including a 16.35% net margin. Its financial ratios are slightly favorable overall, supported by low debt levels (debt-to-equity 0.19) and a solid rating of B+. However, CRM’s ROIC remains below WACC, indicating slight value destruction despite improving profitability.
Autodesk, Inc. (ADSK) exhibits robust income growth with 12.7% revenue increase in 2025 and higher profitability, including an 18.14% net margin. Its financial ratios are neutral overall but include strong returns on equity (42.43%) and invested capital. ADSK has higher debt levels and a B- rating; its ROIC exceeds WACC, signaling durable value creation.
Investors focused on stable profitability and moderate debt might view Salesforce’s profile as slightly more favorable, while those prioritizing strong returns on equity and capital employed could find Autodesk’s durable competitive advantage more appealing. The choice may depend on the investor’s risk tolerance and emphasis on value creation versus income stability.
Disclaimer: Investment carries a risk of loss of initial capital. The past performance is not a reliable indicator of future results. Be sure to understand risks before making an investment decision.
Go Further
I encourage you to read the complete analyses of Salesforce, Inc. and Autodesk, Inc. to enhance your investment decisions: