Autodesk, Inc. and PTC Inc. are two prominent players in the software application industry, specializing in design and product development solutions. Both companies serve overlapping markets, offering innovative tools for engineering, manufacturing, and digital transformation. Their commitment to advancing technology through cloud and augmented reality platforms sets them apart. In this article, I will help you determine which of these tech innovators presents the most compelling investment opportunity in 2026.
Table of contents
Companies Overview
I will begin the comparison between Autodesk, Inc. and PTC Inc. by providing an overview of these two companies and their main differences.
Autodesk Overview
Autodesk, Inc. specializes in 3D design, engineering, and entertainment software and services worldwide. Its product suite includes AutoCAD Civil 3D for civil engineering, BIM 360 for construction management, and Fusion 360 for 3D CAD and CAM. Headquartered in San Rafael, CA, Autodesk serves professionals in architecture, engineering, manufacturing, and media industries, positioning itself as a leader in design and visualization technology.
PTC Overview
PTC Inc. operates as a software and services company offering solutions across the Americas, Europe, and Asia Pacific. Its portfolio includes the ThingWorx platform for digital transformation, Vuforia for augmented reality, and Onshape, a SaaS product development platform. Based in Boston, MA, PTC focuses on product lifecycle management, application lifecycle management, and digital innovation to help enterprises accelerate time to value.
Key similarities and differences
Both Autodesk and PTC operate in the software application industry, providing CAD and product lifecycle solutions. Autodesk primarily targets design, engineering, and entertainment sectors with a broad 3D software suite, while PTC emphasizes digital transformation and AR with a focus on lifecycle and collaboration tools. Autodesk is larger with 15,300 employees and a $61.2B market cap, compared to PTC’s 7,512 employees and $20.4B market cap, reflecting different scales and market reach.
Income Statement Comparison
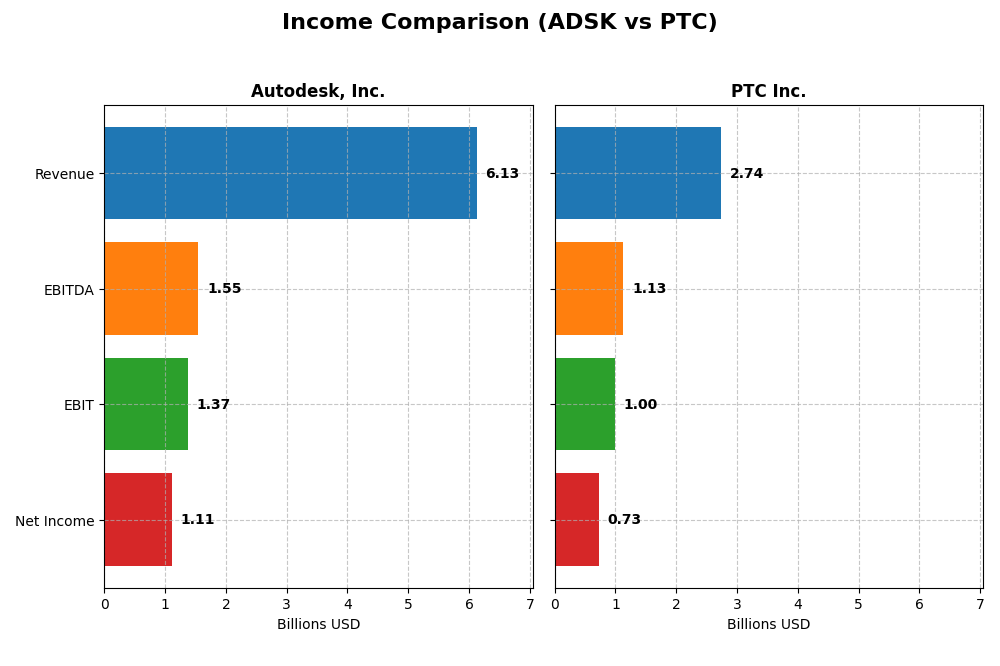
Below is a side-by-side comparison of the most recent fiscal year income statements for Autodesk, Inc. and PTC Inc., highlighting key financial metrics.
| Metric | Autodesk, Inc. (ADSK) | PTC Inc. (PTC) |
|---|---|---|
| Market Cap | 61.2B | 20.4B |
| Revenue | 6.13B | 2.74B |
| EBITDA | 1.55B | 1.13B |
| EBIT | 1.37B | 997M |
| Net Income | 1.11B | 734M |
| EPS | 5.17 | 6.18 |
| Fiscal Year | 2025 | 2025 |
Income Statement Interpretations
Autodesk, Inc.
Autodesk’s revenue grew steadily from $3.79B in 2021 to $6.13B in 2025, marking a 61.74% increase over the period. However, net income showed volatility, peaking in 2021 at $1.21B, then dipping to $823M in 2023 before recovering to $1.11B in 2025. Margins remain strong with a gross margin above 90%, and 2025 saw favorable improvements in revenue and EBIT growth, although net margin declined overall.
PTC Inc.
PTC’s revenue expanded from $1.81B in 2021 to $2.74B in 2025, a 51.58% rise. Net income exhibited consistent growth, rising from $477M in 2021 to $734M in 2025, supported by improving margins and operational efficiency. The company’s EBIT margin stands out at 36.4%, with significant gains in net margin and EPS in the most recent year, reflecting a robust operational performance and sustained profitability.
Which one has the stronger fundamentals?
PTC demonstrates stronger fundamentals with consistent net income growth of 53.9% over five years, higher EBIT and net margins, and a substantial 96.79% EPS growth in 2025. Autodesk shows robust revenue growth and high gross margins but faces challenges in net income and margin consistency. Overall, PTC’s income statement indicators reflect a more favorable and stable financial health.
Financial Ratios Comparison
This table presents the most recent financial ratios for Autodesk, Inc. and PTC Inc., allowing a straightforward comparison of their profitability, liquidity, leverage, and operational efficiency as of their latest fiscal year.
| Ratios | Autodesk, Inc. (ADSK) | PTC Inc. (PTC) |
|---|---|---|
| ROE | 42.4% | 19.2% |
| ROIC | 18.0% | 14.4% |
| P/E | 60.2 | 33.2 |
| P/B | 25.5 | 6.4 |
| Current Ratio | 0.68 | 1.12 |
| Quick Ratio | 0.68 | 1.12 |
| D/E (Debt-to-Equity) | 0.98 | 0.36 |
| Debt-to-Assets | 23.6% | 20.7% |
| Interest Coverage | 0 | 12.8 |
| Asset Turnover | 0.57 | 0.41 |
| Fixed Asset Turnover | 21.4 | 15.6 |
| Payout Ratio | 0 | 0 |
| Dividend Yield | 0 | 0 |
Interpretation of the Ratios
Autodesk, Inc.
Autodesk shows strong profitability ratios with a 42.43% ROE and 18.14% net margin, indicating efficient earnings generation. However, valuation metrics like a high PE of 60.2 and PB of 25.54 are unfavorable, alongside liquidity concerns given a low current ratio of 0.68. The company does not pay dividends, likely prioritizing reinvestment or growth strategies.
PTC Inc.
PTC presents a favorable overall ratio profile with a 26.8% net margin and 19.18% ROE, though slightly lower than Autodesk’s profitability. Its liquidity ratios are better, with a current ratio of 1.12 and a quick ratio rated favorable. PTC also does not pay dividends, which may reflect reinvestment priorities or growth focus, supported by reasonable debt levels and interest coverage.
Which one has the best ratios?
PTC holds a more favorable ratio profile overall, with 57.14% favorable metrics versus Autodesk’s 42.86%. PTC’s stronger liquidity, moderate leverage, and solid coverage ratios contrast with Autodesk’s higher valuation multiples and weaker liquidity, suggesting PTC’s ratios are currently more balanced despite Autodesk’s superior profitability.
Strategic Positioning
This section compares the strategic positioning of Autodesk, Inc. and PTC Inc., focusing on Market position, Key segments, and exposure to technological disruption:
Autodesk, Inc.
- Larger market cap with significant competitive pressure in software application.
- Diverse segments: Architecture, Engineering, Construction, Manufacturing, Media.
- Uses cloud-based solutions but primarily in established CAD and design software.
PTC Inc.
- Smaller market cap, operates under moderate competitive pressure globally.
- Concentrated segments: Software Products and Professional Services.
- Emphasizes digital transformation platforms and augmented reality technology.
Autodesk, Inc. vs PTC Inc. Positioning
Autodesk pursues a diversified approach across multiple industries with strong legacy products, while PTC concentrates on digital transformation and AR solutions. Autodesk’s breadth offers revenue stability; PTC’s focus provides innovation opportunities but narrower exposure.
Which has the best competitive advantage?
Both companies create value above their cost of capital. Autodesk shows slightly favorable moat with declining profitability, whereas PTC has a very favorable moat with increasing profitability, indicating a more durable competitive advantage.
Stock Comparison
The stock price performance of Autodesk, Inc. (ADSK) and PTC Inc. over the past 12 months reveals contrasting trends, with ADSK showing a moderate bullish trajectory while PTC exhibits a bearish decline, reflecting differing market sentiments and trading dynamics.

Trend Analysis
Autodesk, Inc. (ADSK) recorded a 7.52% price increase over the past year, indicating a bullish trend with decelerating momentum. The stock ranged between $201.6 and $326.37, showing high volatility with a 29.92 std deviation.
PTC Inc. experienced a -7.1% price change, confirming a bearish trend accompanied by deceleration. Its stock fluctuated from $139.77 to $215.05, with moderate volatility measured by a 15.38 std deviation.
Comparing both, Autodesk delivered the highest market performance with its positive price change, while PTC faced a sustained decline, underlining stronger investor confidence in ADSK over the period.
Target Prices
The current analyst consensus points to promising upside potential for both Autodesk, Inc. and PTC Inc.
| Company | Target High | Target Low | Consensus |
|---|---|---|---|
| Autodesk, Inc. | 400 | 343 | 372.88 |
| PTC Inc. | 255 | 120 | 213.25 |
Analysts expect Autodesk’s stock to appreciate significantly from its current price of 286.73 USD, while PTC’s consensus target of 213.25 USD also suggests a notable upside from its present 170.1 USD. This reflects positive market sentiment and growth expectations for both technology firms.
Analyst Opinions Comparison
This section compares the analysts’ ratings and grades for Autodesk, Inc. and PTC Inc.:
Rating Comparison
Autodesk, Inc. Rating
- Rating: B- indicating a very favorable overall status.
- Discounted Cash Flow Score: Moderate at 3 out of 5.
- ROE Score: Very favorable at 5, showing strong equity returns.
- ROA Score: Favorable at 4, efficient asset utilization.
- Debt To Equity Score: Very unfavorable at 1, high risk.
- Overall Score: Moderate at 3, reflecting balanced performance.
PTC Inc. Rating
- Rating: B+ indicating a very favorable overall status.
- Discounted Cash Flow Score: Favorable at 4 out of 5.
- ROE Score: Favorable at 4, indicating good equity returns.
- ROA Score: Very favorable at 5, excellent asset use.
- Debt To Equity Score: Moderate at 2, moderate financial risk.
- Overall Score: Moderate at 3, reflecting balanced performance.
Which one is the best rated?
PTC holds a higher rating (B+) compared to Autodesk’s B-. PTC scores better in discounted cash flow, return on assets, and debt-to-equity, suggesting a more favorable financial profile strictly based on provided data.
Scores Comparison
Here is a comparison of the Altman Z-Score and Piotroski Score for both companies:
Autodesk Scores
- Altman Z-Score: 5.45, indicating a safe zone from bankruptcy risk.
- Piotroski Score: 8, reflecting very strong financial health.
PTC Scores
- Altman Z-Score: 5.90, indicating a safe zone from bankruptcy risk.
- Piotroski Score: 8, reflecting very strong financial health.
Which company has the best scores?
Both Autodesk and PTC show strong financial health with identical Piotroski Scores of 8. PTC has a slightly higher Altman Z-Score (5.90 vs. 5.45), indicating marginally lower bankruptcy risk based on this metric.
Grades Comparison
Here is a detailed comparison of the latest grades assigned to Autodesk, Inc. and PTC Inc. by leading financial institutions:
Autodesk, Inc. Grades
The following table summarizes recent grades for Autodesk, Inc. by reputable grading companies:
| Grading Company | Action | New Grade | Date |
|---|---|---|---|
| Barclays | Maintain | Overweight | 2025-11-26 |
| BMO Capital | Maintain | Market Perform | 2025-11-26 |
| Wells Fargo | Maintain | Overweight | 2025-11-26 |
| Deutsche Bank | Upgrade | Buy | 2025-11-26 |
| Rosenblatt | Maintain | Buy | 2025-11-26 |
| Macquarie | Maintain | Outperform | 2025-11-26 |
| Baird | Maintain | Outperform | 2025-11-26 |
| B of A Securities | Maintain | Neutral | 2025-11-26 |
| Rosenblatt | Maintain | Buy | 2025-11-24 |
| Baird | Maintain | Outperform | 2025-11-18 |
Autodesk’s grades predominantly trend positive, with multiple “Buy,” “Outperform,” and “Overweight” ratings alongside a few neutral or market perform marks.
PTC Inc. Grades
Below is a summary of recent grades for PTC Inc. from recognized grading companies:
| Grading Company | Action | New Grade | Date |
|---|---|---|---|
| Piper Sandler | Maintain | Neutral | 2025-11-07 |
| Rosenblatt | Maintain | Buy | 2025-11-06 |
| Rosenblatt | Maintain | Buy | 2025-10-30 |
| Barclays | Maintain | Overweight | 2025-07-31 |
| Piper Sandler | Maintain | Neutral | 2025-07-31 |
| Oppenheimer | Maintain | Outperform | 2025-07-31 |
| Rosenblatt | Maintain | Buy | 2025-07-31 |
| RBC Capital | Maintain | Outperform | 2025-07-31 |
| Keybanc | Maintain | Overweight | 2025-07-31 |
| Stifel | Maintain | Buy | 2025-07-31 |
PTC’s grades consistently show positive assessments, with several “Buy,” “Outperform,” and “Overweight” ratings, balanced by some neutral marks.
Which company has the best grades?
Comparing both companies, Autodesk, Inc. and PTC Inc. receive a similar distribution of favorable grades, including multiple “Buy” and “Outperform” ratings. Autodesk shows a slightly more recent upgrade from Deutsche Bank, while PTC has a broader set of “Buy” and “Outperform” opinions from several firms. These strong grades can indicate positive analyst sentiment, potentially influencing investor confidence and portfolio considerations.
Strengths and Weaknesses
Below is a comparison of key strengths and weaknesses for Autodesk, Inc. (ADSK) and PTC Inc. (PTC) based on their latest financial and operational data.
| Criterion | Autodesk, Inc. (ADSK) | PTC Inc. (PTC) |
|---|---|---|
| Diversification | Strong with multiple segments: Architecture ($2.94B), AutoCAD ($1.57B), Manufacturing ($1.19B), Media ($0.32B) | Moderate focus: License ($1.16B), Support & Cloud ($1.47B), Technology Service ($0.11B) |
| Profitability | Net margin 18.14%, ROE 42.43%, ROIC 18.01%; high profitability but declining ROIC trend (-48%) | Net margin 26.8%, ROE 19.18%, ROIC 14.43%; very favorable with growing ROIC (+42%) |
| Innovation | Established in CAD and engineering software with steady product upgrades | Strong innovation in cloud and IoT solutions with growing recurring services |
| Global presence | Large global footprint with dominant position in architecture and engineering markets | Expanding global reach focused on manufacturing and IoT sectors |
| Market Share | Leading in architecture and CAD software with diversified client base | Growing share in PLM and IoT software markets, leveraging cloud services |
Key takeaways: Autodesk benefits from a well-diversified product portfolio and strong profitability, though its declining ROIC trend suggests caution. PTC shows robust profitability with a growing competitive advantage, driven by innovation and expanding cloud services. Both have strengths, but PTC’s improving profitability and innovation momentum make it a compelling choice for investors seeking growth.
Risk Analysis
Below is a comparative table of key risks for Autodesk, Inc. (ADSK) and PTC Inc. (PTC) based on the most recent 2025 data:
| Metric | Autodesk, Inc. (ADSK) | PTC Inc. (PTC) |
|---|---|---|
| Market Risk | High beta (1.475) implies higher volatility and sensitivity to market swings. | Moderate beta (1.03) indicates closer to market average volatility. |
| Debt Level | Debt-to-equity ratio near 1.0, marked as very unfavorable, indicating higher leverage risk. | Low debt-to-equity ratio (~0.36), favorable, signaling lower financial leverage. |
| Regulatory Risk | Moderate; operates globally in software with standard tech regulations. | Moderate; similar global tech exposure with potential compliance demands. |
| Operational Risk | Medium; complex software suite with cloud reliance, but strong operational metrics. | Medium; diversified product lines but lower asset turnover might affect efficiency. |
| Environmental Risk | Low; software sector with minimal direct environmental impact. | Low; similar minimal direct environmental footprint. |
| Geopolitical Risk | Moderate; global supply chains and customers could be affected by trade tensions. | Moderate; global market presence entails exposure to geopolitical uncertainties. |
The most significant risks are Autodesk’s high market volatility and elevated debt level, which may increase financial vulnerability despite strong profitability. PTC exhibits better leverage management and lower volatility but faces operational efficiency challenges. Both companies face moderate regulatory and geopolitical risks typical for global tech firms. Caution is advised particularly with Autodesk’s debt profile.
Which Stock to Choose?
Autodesk, Inc. (ADSK) shows favorable income growth with a 12.7% revenue increase in 2025 and strong profitability metrics such as an 18.14% net margin and 42.43% ROE. The company maintains moderate debt levels, a slightly unfavorable liquidity position, and a very favorable overall rating of B-. Its economic moat is slightly favorable due to value creation but a declining ROIC trend.
PTC Inc. (PTC) reports higher income growth at 19.18% revenue growth in 2025 and stronger profitability, including a 26.8% net margin and 19.18% ROE. The company has lower leverage, better liquidity ratios, and a very favorable B+ rating. Its economic moat is very favorable with value creation and a growing ROIC trend, indicating increasing profitability durability.
For investors prioritizing growth and strong profitability with improving returns on capital, PTC might appear more favorable given its robust income growth, solid financial ratios, and durable competitive advantage. Conversely, those valuing higher ROE and established market presence could interpret Autodesk’s profile as reflecting steady value creation despite some liquidity constraints and a declining ROIC.
Disclaimer: Investment carries a risk of loss of initial capital. The past performance is not a reliable indicator of future results. Be sure to understand risks before making an investment decision.
Go Further
I encourage you to read the complete analyses of Autodesk, Inc. and PTC Inc. to enhance your investment decisions: