In the dynamic world of software applications, Autodesk, Inc. and Perfect Corp. stand out with distinct yet overlapping innovations. Autodesk is a giant in 3D design and engineering software, while Perfect Corp. pioneers AI-driven beauty and fashion tech solutions. Both companies leverage advanced technology to transform their industries, making them compelling choices for investors seeking growth and innovation. This article will help you identify which company holds the most promise for your portfolio.
Table of contents
Companies Overview
I will begin the comparison between Autodesk and Perfect Corp. by providing an overview of these two companies and their main differences.
Autodesk Overview
Autodesk, Inc. is a US-based technology company specializing in 3D design, engineering, and entertainment software and services. It offers a broad range of products such as AutoCAD, BIM 360, and Fusion 360, targeting professionals in architecture, engineering, construction, product design, manufacturing, and media. Founded in 1982, Autodesk is a well-established player with a market cap of approximately 56.6B USD and employs around 15,300 people.
Perfect Corp. Overview
Perfect Corp. is a Taiwanese technology firm founded in 2015 that provides SaaS AI and augmented reality solutions focused on beauty and fashion tech. Its offerings include virtual try-on features for makeup, hair, and accessories, supported by AI-driven analysis tools. With a market cap near 179M USD and a workforce of 342 employees, Perfect Corp. is a smaller, niche player listed on the NYSE since 2022.
Key similarities and differences
Both companies operate in the software application industry and focus on technology innovation, yet their market targets diverge significantly. Autodesk serves a broad professional market with comprehensive design and engineering tools, while Perfect Corp. concentrates on AI and AR solutions for beauty and fashion. Autodesk’s much larger scale and long-established presence contrast with Perfect’s specialized, emerging market approach and smaller market capitalization.
Income Statement Comparison
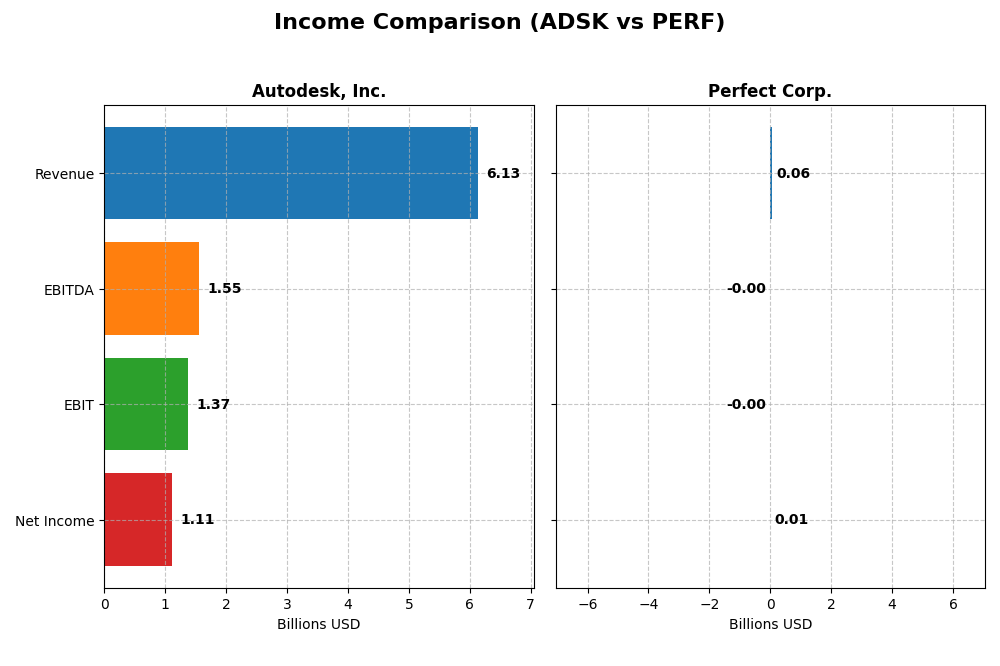
Below is a side-by-side comparison of the most recent fiscal year income statement metrics for Autodesk, Inc. and Perfect Corp., highlighting their financial performance.
| Metric | Autodesk, Inc. (ADSK) | Perfect Corp. (PERF) |
|---|---|---|
| Market Cap | 56.6B | 179M |
| Revenue | 6.13B | 60.2M |
| EBITDA | 1.55B | -2.05M |
| EBIT | 1.37B | -2.84M |
| Net Income | 1.11B | 5.02M |
| EPS | 5.17 | 0.05 |
| Fiscal Year | 2025 | 2024 |
Income Statement Interpretations
Autodesk, Inc.
Autodesk’s revenue grew steadily from $3.79B in 2021 to $6.13B in 2025, marking a 61.7% increase over five years. Net income showed fluctuations, peaking at $1.21B in 2021 but declining overall by 7.95%. Margins remain strong with a gross margin above 90% and a net margin near 18%, reflecting operational efficiency. The 2025 fiscal year saw favorable 12.7% revenue growth and 8.9% net margin improvement, indicating solid recent performance.
Perfect Corp.
Perfect Corp. expanded revenue impressively from $29.9M in 2020 to $60.2M in 2024, doubling over the period. Net income turned positive with $5M in 2024 after significant losses in earlier years. Gross margin remained favorable at nearly 78%, but EBIT margin was negative at -4.7%, indicating ongoing operating challenges. The latest year showed 12.5% revenue growth, though EBIT declined sharply, suggesting profitability pressures despite top-line gains.
Which one has the stronger fundamentals?
Autodesk demonstrates stronger fundamentals with consistently high margins, positive EBIT, and solid net income despite some margin erosion over the period. Perfect Corp. shows rapid revenue growth and an improving bottom line, but persistent negative EBIT and margin volatility highlight operational risks. Both companies have favorable income statement evaluations, yet Autodesk’s scale and profitability metrics reflect more stable financial health.
Financial Ratios Comparison
The table below presents a side-by-side comparison of key financial ratios for Autodesk, Inc. (ADSK) and Perfect Corp. (PERF) based on their most recent fiscal year data.
| Ratios | Autodesk, Inc. (ADSK) 2025 | Perfect Corp. (PERF) 2024 |
|---|---|---|
| ROE | 42.4% | 3.4% |
| ROIC | 18.0% | -2.1% |
| P/E | 60.2 | 56.6 |
| P/B | 25.5 | 1.93 |
| Current Ratio | 0.68 | 5.52 |
| Quick Ratio | 0.68 | 5.52 |
| D/E | 0.98 | 0.0035 |
| Debt-to-Assets | 23.6% | 0.28% |
| Interest Coverage | 0 | -449 |
| Asset Turnover | 0.57 | 0.33 |
| Fixed Asset Turnover | 21.4 | 57.9 |
| Payout ratio | 0 | 0 |
| Dividend yield | 0 | 0 |
Interpretation of the Ratios
Autodesk, Inc.
Autodesk shows a mixed profile with strong profitability ratios including a favorable net margin of 18.14% and a high ROE at 42.43%, supported by solid returns on invested capital. However, valuation ratios such as a PE of 60.2 and PB of 25.54 are unfavorable, as are liquidity ratios with a current ratio of 0.68. The company does not pay dividends, likely reinvesting earnings to support growth and innovation.
Perfect Corp.
Perfect Corp. displays some weaknesses with an ROE of 3.42% and negative ROIC, reflecting limited profitability and efficiency challenges. The WACC is favorable at 5.96%, but valuation remains high with a PE of 56.6. Liquidity ratios are mixed: a high current ratio of 5.52 but flagged as unfavorable due to potential inefficiencies. No dividends are paid, consistent with a growth-focused strategy and reinvestment priorities.
Which one has the best ratios?
Autodesk presents stronger profitability and return metrics than Perfect Corp., with several favorable ratios including net margin and return on equity. Though Autodesk faces valuation and liquidity concerns, Perfect’s more numerous unfavorable ratios, particularly in returns and interest coverage, suggest its financial position is slightly weaker. Overall, Autodesk’s ratios are more balanced despite some risks.
Strategic Positioning
This section compares the strategic positioning of Autodesk and Perfect Corp., focusing on market position, key segments, and exposure to technological disruption:
Autodesk, Inc.
- Leading software application provider with large market cap, facing moderate competitive pressure.
- Diversified segments including Architecture, Engineering, Construction, Manufacturing, and Media.
- Positioned in established software markets with moderate risk from emerging technologies.
Perfect Corp.
- Smaller market cap player specializing in AI/AR beauty and fashion tech, niche competitive environment.
- Concentrated on SaaS AI and AR solutions for beauty and fashion industries.
- Highly exposed to AI and AR technological disruption driving product innovation.
Autodesk, Inc. vs Perfect Corp. Positioning
Autodesk pursues a diversified business model across multiple professional software segments, offering stability and broad market reach. Perfect Corp. focuses narrowly on AI and AR in beauty tech, enabling rapid innovation but exposing it to niche market risks and smaller scale.
Which has the best competitive advantage?
Autodesk demonstrates a very favorable moat with consistent value creation and growing profitability, indicating a durable competitive advantage. Perfect Corp. shows a slightly unfavorable moat, currently shedding value despite improving profitability trends.
Stock Comparison
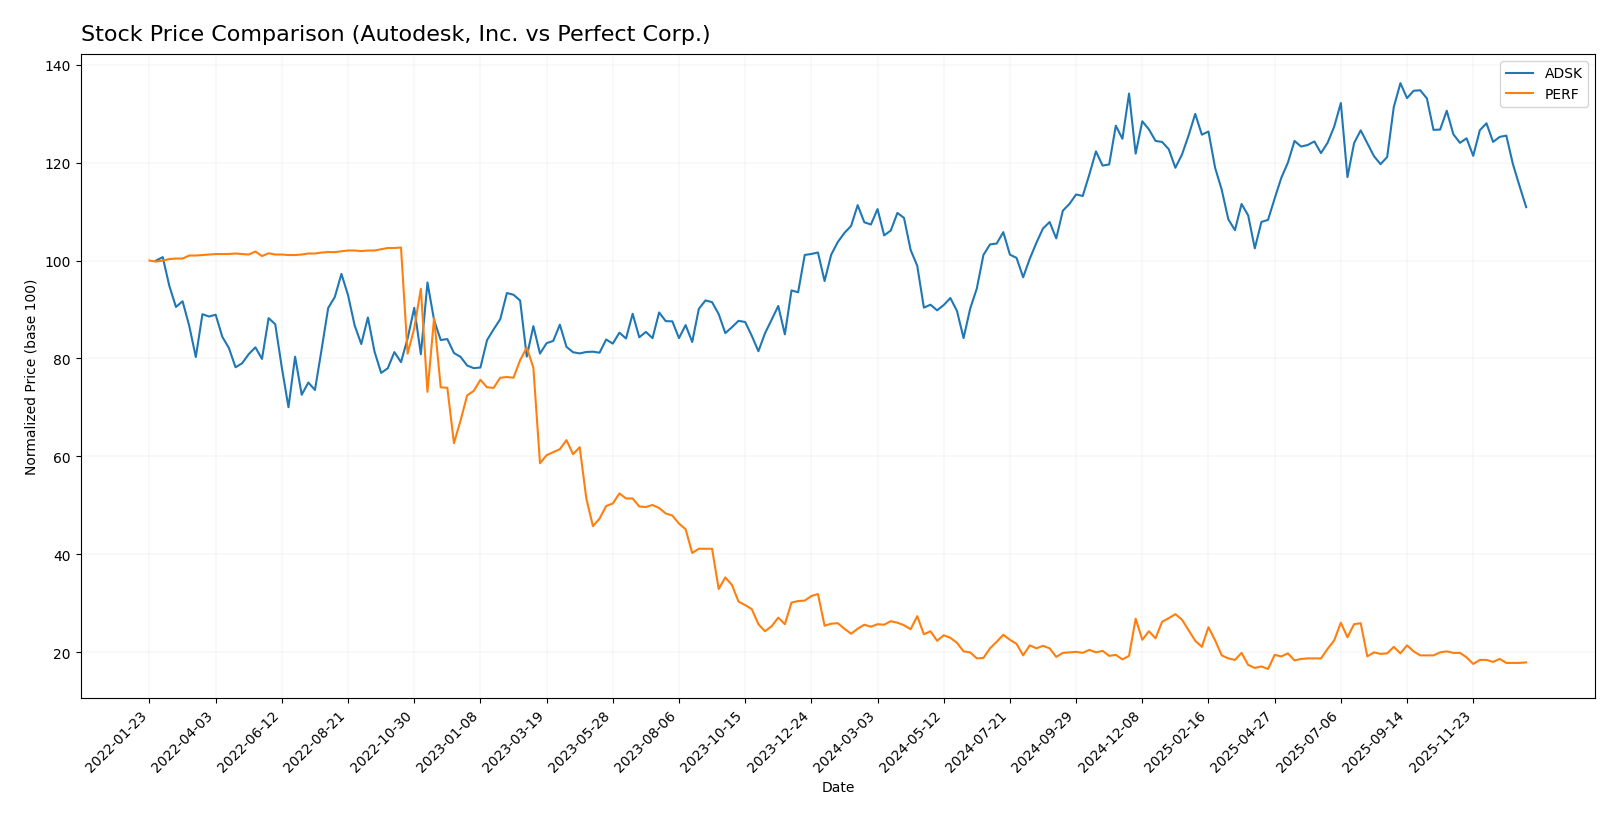
The stock price movements over the past 12 months reveal Autodesk, Inc. (ADSK) showing a modest bullish trend with decelerating gains, while Perfect Corp. (PERF) exhibits a pronounced bearish trend with a steady price decline.
Trend Analysis
Autodesk’s stock price increased by 3.3% over the past year, indicating a bullish trend with deceleration in momentum. It reached a high of 326.37 and a low of 201.6, with notable recent weakness showing an 11.83% drop.
Perfect Corp.’s stock declined by 28.98% over the same period, reflecting a bearish trend with deceleration. Its price ranged between 1.61 and 2.7, and recent losses of 9.84% confirm persistent downward pressure.
Comparing the two, Autodesk delivered the highest market performance with a positive price change, contrasting with Perfect Corp.’s significant bearish trend and larger price depreciation.
Target Prices
Analysts present a clear target price consensus for Autodesk, Inc. and Perfect Corp.
| Company | Target High | Target Low | Consensus |
|---|---|---|---|
| Autodesk, Inc. | 400 | 343 | 373 |
| Perfect Corp. | 7 | 7 | 7 |
Autodesk’s consensus target of 373 suggests significant upside from the current 265.69 USD price, reflecting strong analyst confidence. Perfect Corp.’s steady 7 USD target also implies notable potential gain from its current 1.74 USD price.
Analyst Opinions Comparison
This section compares analysts’ ratings and grades for Autodesk, Inc. and Perfect Corp.:
Rating Comparison
ADSK Rating
- Rating: B-, considered very favorable overall.
- Discounted Cash Flow Score: Moderate at 3, indicating average valuation.
- ROE Score: Very favorable at 5, showing strong profit generation from equity.
- ROA Score: Favorable at 4, reflecting good asset utilization.
- Debt To Equity Score: Very unfavorable at 1, indicating high financial risk.
- Overall Score: Moderate at 3, reflecting average financial standing.
PERF Rating
- Rating: A-, also very favorable overall.
- Discounted Cash Flow Score: Very favorable at 5, suggesting undervaluation.
- ROE Score: Moderate at 2, indicating less efficient equity use.
- ROA Score: Moderate at 3, showing average asset efficiency.
- Debt To Equity Score: Favorable at 4, suggesting lower financial risk.
- Overall Score: Favorable at 4, indicating stronger financial health.
Which one is the best rated?
Based strictly on the provided data, Perfect Corp. holds a better overall rating and higher scores in discounted cash flow and debt-to-equity, while Autodesk excels in return on equity and assets but has higher financial risk.
Scores Comparison
Here is a comparison of the Altman Z-Score and Piotroski Score for Autodesk, Inc. and Perfect Corp.:
Autodesk Scores
- Altman Z-Score: 5.05, indicating a safe zone, low bankruptcy risk.
- Piotroski Score: 8, rated very strong financial health.
Perfect Scores
- Altman Z-Score: 1.31, indicating distress zone, high bankruptcy risk.
- Piotroski Score: 6, rated average financial health.
Which company has the best scores?
Autodesk exhibits stronger financial health with a safe-zone Altman Z-Score and a very strong Piotroski Score of 8. Perfect shows higher risk with a distress-zone Altman Z-Score and an average Piotroski Score of 6, indicating weaker financial stability.
Grades Comparison
Here is a comparison of the recent grades assigned to Autodesk, Inc. and Perfect Corp. by recognized grading companies:
Autodesk, Inc. Grades
The table below shows recent grades assigned to Autodesk, Inc. by various financial institutions.
| Grading Company | Action | New Grade | Date |
|---|---|---|---|
| Barclays | Maintain | Overweight | 2025-11-26 |
| Wells Fargo | Maintain | Overweight | 2025-11-26 |
| Deutsche Bank | Upgrade | Buy | 2025-11-26 |
| B of A Securities | Maintain | Neutral | 2025-11-26 |
| Rosenblatt | Maintain | Buy | 2025-11-26 |
| Macquarie | Maintain | Outperform | 2025-11-26 |
| BMO Capital | Maintain | Market Perform | 2025-11-26 |
| Baird | Maintain | Outperform | 2025-11-26 |
| Rosenblatt | Maintain | Buy | 2025-11-24 |
| Baird | Maintain | Outperform | 2025-11-18 |
Overall, Autodesk shows a strong consensus of buy and outperform ratings with mostly maintained or upgraded grades in late 2025.
Perfect Corp. Grades
The table below shows recent grades assigned to Perfect Corp. by recognized financial institutions.
| Grading Company | Action | New Grade | Date |
|---|---|---|---|
| Piper Sandler | Maintain | Neutral | 2024-02-29 |
| Goldman Sachs | Maintain | Neutral | 2023-10-26 |
| Piper Sandler | Maintain | Neutral | 2023-10-25 |
| Piper Sandler | Maintain | Neutral | 2023-07-26 |
| Piper Sandler | Maintain | Neutral | 2023-07-25 |
| Piper Sandler | Maintain | Neutral | 2023-04-27 |
| Oppenheimer | Downgrade | Perform | 2023-04-20 |
| Oppenheimer | Downgrade | Perform | 2023-04-19 |
| Oppenheimer | Downgrade | Perform | 2023-04-18 |
| Piper Sandler | Maintain | Neutral | 2023-03-08 |
Perfect Corp.’s grades trend toward neutral and perform ratings, with no upgrades or buy ratings in recent years.
Which company has the best grades?
Autodesk, Inc. holds significantly better grades with multiple buy and outperform ratings compared to Perfect Corp., which mostly receives neutral ratings. This suggests stronger analyst confidence in Autodesk’s outlook, potentially influencing investor decisions toward higher expected growth or stability.
Strengths and Weaknesses
The following table compares Autodesk, Inc. (ADSK) and Perfect Corp. (PERF) across key criteria based on the most recent financial and strategic data.
| Criterion | Autodesk, Inc. (ADSK) | Perfect Corp. (PERF) |
|---|---|---|
| Diversification | Strong diversification with multiple segments: Architecture, Manufacturing, Media, AutoCAD family | Limited diversification; primarily focused on beauty tech products |
| Profitability | High profitability: Net margin 18.14%, ROIC 18.01%, ROE 42.43% (favorable) | Lower profitability: Net margin 8.34% (neutral), ROIC -2.1% (unfavorable), ROE 3.42% (unfavorable) |
| Innovation | Moderate to high innovation with strong product portfolio and increasing revenue in engineering software | Innovation growing; ROIC trend positive but still value-destructive |
| Global presence | Very strong global footprint in architecture, manufacturing, and media sectors | Smaller scale global presence, niche market focus |
| Market Share | Leading market share in CAD and engineering software markets | Emerging market share in AI beauty tech, but still developing |
In summary, Autodesk demonstrates a durable competitive advantage with strong profitability and broad diversification, making it a safer choice for value investors. Perfect Corp. shows promising growth and innovation but currently struggles with profitability and value creation, suggesting higher risk but potential for future improvement.
Risk Analysis
Below is a comparative table of key risk factors for Autodesk, Inc. (ADSK) and Perfect Corp. (PERF) based on the most recent financial and market data available for 2025 and 2024 respectively:
| Metric | Autodesk, Inc. (ADSK) | Perfect Corp. (PERF) |
|---|---|---|
| Market Risk | High beta (1.47) indicates greater volatility | Low beta (0.45) implies lower volatility |
| Debt level | Moderate debt-to-equity (0.98), favorable debt-to-assets (23.6%) | Virtually no debt (debt-to-equity 0.0, debt-to-assets 0.28%) |
| Regulatory Risk | Moderate, US-based with tech sector regulations | Moderate, Taiwan-based with potential cross-border regulatory challenges |
| Operational Risk | Large global operations, 15.3K employees; complexity risk | Smaller scale, 342 employees; less operational complexity |
| Environmental Risk | Moderate, exposure to sustainability demands in tech | Moderate, AR/AI tech sector with evolving environmental standards |
| Geopolitical Risk | US market exposure, subject to trade policies and tech export controls | Higher geopolitical risk due to Taiwan location and China-Taiwan tensions |
Synthesis: Autodesk faces notable market risk due to its higher beta and valuation concerns (high P/E and P/B ratios), but maintains moderate debt and strong profitability. Perfect Corp. shows low market volatility and minimal debt but is in the distress zone per Altman Z-score, reflecting financial fragility, combined with increased geopolitical risks due to its Taiwan base. Investors should weigh Autodesk’s valuation and volatility risks against Perfect’s financial distress and geopolitical uncertainty.
Which Stock to Choose?
Autodesk, Inc. (ADSK) shows a favorable income evolution with 12.7% revenue growth in 2025 and strong profitability indicators, including an 18.14% net margin and a 42.43% ROE. Its debt levels are moderate, with a net debt to EBITDA of 0.62 and a very favorable rating of B-. The company demonstrates a very favorable moat, creating value with a growing ROIC well above WACC.
Perfect Corp. (PERF) reports favorable income growth overall, with revenue up 101.53% and net income rising 189.77% over 2020-2024, though its 2024 EBIT margin is negative. Profitability ratios are mostly unfavorable, including a 3.42% ROE and negative ROIC versus WACC. The company has low debt and a strong current ratio but a slightly unfavorable global financial ratios evaluation and a very favorable A- rating.
Investors focused on durable value creation and strong profitability might find Autodesk’s very favorable moat and stable income growth suggestive of quality investing appeal, while those prioritizing rapid revenue growth with some risk tolerance could interpret Perfect Corp.’s high income growth and improving profitability as potential for growth investing, despite its current financial challenges.
Disclaimer: Investment carries a risk of loss of initial capital. The past performance is not a reliable indicator of future results. Be sure to understand risks before making an investment decision.
Go Further
I encourage you to read the complete analyses of Autodesk, Inc. and Perfect Corp. to enhance your investment decisions: