In today’s fast-evolving software landscape, Autodesk, Inc. and Paycom Software, Inc. stand out as influential players, each revolutionizing distinct yet overlapping niches of the application software industry. Autodesk leads in 3D design and engineering solutions, while Paycom excels in cloud-based human capital management services. Comparing their market positions and innovation strategies provides valuable insight. This article will help you decide which company offers the best investment opportunity in 2026.
Table of contents
Companies Overview
I will begin the comparison between Autodesk and Paycom Software by providing an overview of these two companies and their main differences.
Autodesk Overview
Autodesk, Inc. specializes in 3D design, engineering, and entertainment software and services worldwide. The company offers a broad portfolio including AutoCAD, BIM 360, and Fusion 360, targeting architecture, engineering, construction, product design, manufacturing, and media industries. Incorporated in 1982, Autodesk is headquartered in San Rafael, California, and employs approximately 15,300 people, positioning itself as a leader in application software for professional design and visualization.
Paycom Software Overview
Paycom Software, Inc. provides cloud-based human capital management (HCM) solutions primarily for small to mid-sized U.S. companies. Its software-as-a-service platform covers the entire employment lifecycle, including talent acquisition, time management, payroll, and compliance. Founded in 1998 and based in Oklahoma City, Oklahoma, Paycom employs about 7,300 people and is focused on delivering comprehensive HCM applications with data analytics and mobile capabilities.
Key similarities and differences
Both Autodesk and Paycom operate in the software application industry within the U.S. technology sector, offering specialized solutions for professional users. Autodesk’s business centers on design and engineering software with a global reach, while Paycom concentrates on cloud-based human capital management for domestic small to mid-sized companies. Autodesk’s workforce is roughly twice the size of Paycom’s, reflecting their differing market scopes and product focuses.
Income Statement Comparison
The table below compares key income statement metrics for Autodesk, Inc. and Paycom Software, Inc. for their most recent fiscal years, providing a snapshot of their financial performance.
| Metric | Autodesk, Inc. (ADSK) | Paycom Software, Inc. (PAYC) |
|---|---|---|
| Market Cap | 56.6B | 8.3B |
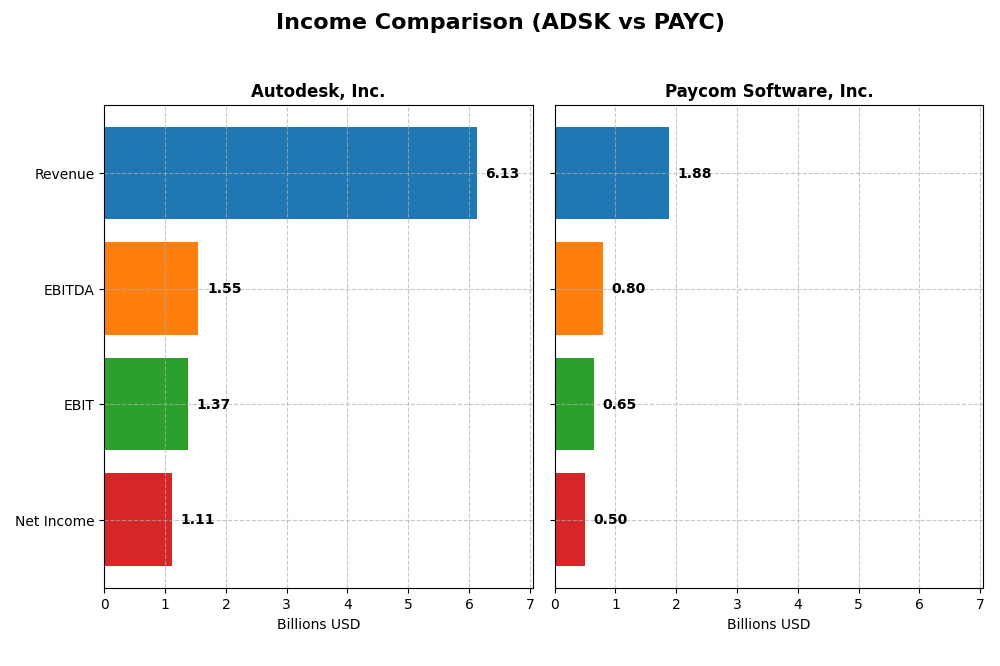
| Revenue | 6.13B | 1.88B |
| EBITDA | 1.55B | 798M |
| EBIT | 1.37B | 652M |
| Net Income | 1.11B | 502M |
| EPS | 5.17 | 8.93 |
| Fiscal Year | 2025 | 2024 |
Income Statement Interpretations
Autodesk, Inc.
Autodesk’s revenue showed a steady increase from $3.79B in 2021 to $6.13B in 2025, marking a 61.7% growth over five years. Net income fluctuated, peaking at $1.21B in 2021 before declining to $1.11B in 2025. Margins remained strong, with a gross margin above 90% and net margin around 18% in 2025. The latest year saw revenue growth accelerate by 12.7%, with improving EBIT and EPS margins.
Paycom Software, Inc.
Paycom’s revenue rose significantly from $841M in 2020 to $1.88B in 2024, more than doubling over five years. Net income grew even faster, jumping from $143M to $502M, reflecting a strong net margin increase to 26.7%. Margins improved notably, with EBIT margin surpassing 34%. In 2024, revenue grew by 11.2%, while net margin and EPS surged, indicating robust profitability gains.
Which one has the stronger fundamentals?
Both companies present favorable fundamentals, with Autodesk excelling in gross margin stability and strong revenue growth, albeit with some net income volatility. Paycom demonstrates exceptional net income and EPS growth alongside expanding margins and consistent profitability improvements. Paycom’s 100% favorable income statement evaluation contrasts with Autodesk’s 78.6%, highlighting stronger overall income statement fundamentals for Paycom.
Financial Ratios Comparison
The table below compares key financial ratios for Autodesk, Inc. and Paycom Software, Inc. based on their most recent fiscal year data, providing a snapshot of their financial health and valuation metrics.
| Ratios | Autodesk, Inc. (ADSK) 2025 | Paycom Software, Inc. (PAYC) 2024 |
|---|---|---|
| ROE | 42.4% | 31.9% |
| ROIC | 18.0% | 24.9% |
| P/E | 60.2 | 22.9 |
| P/B | 25.5 | 7.31 |
| Current Ratio | 0.68 | 1.10 |
| Quick Ratio | 0.68 | 1.10 |
| D/E | 0.98 | 0.05 |
| Debt-to-Assets | 23.6% | 1.4% |
| Interest Coverage | 0 | 187 |
| Asset Turnover | 0.57 | 0.32 |
| Fixed Asset Turnover | 21.4 | 2.93 |
| Payout ratio | 0% | 16.9% |
| Dividend yield | 0% | 0.74% |
Interpretation of the Ratios
Autodesk, Inc.
Autodesk shows strong profitability with a net margin of 18.14%, ROE at 42.43%, and ROIC at 18.01%, all favorable. However, concerns arise from a high PE ratio of 60.2, a low current ratio of 0.68, and a high price-to-book ratio of 25.54. The company does not pay dividends, likely focusing on growth and reinvestment strategies.
Paycom Software, Inc.
Paycom demonstrates favorable profitability with a 26.66% net margin, 31.85% ROE, and 24.86% ROIC. It maintains a strong balance sheet, with a current ratio of 1.1 and low debt-to-assets at 1.42%. Though it pays a modest dividend yield of 0.74%, this is considered unfavorable relative to its other strong ratios, indicating cautious shareholder returns.
Which one has the best ratios?
Paycom exhibits a more balanced set of favorable ratios, including better liquidity, lower debt, and reasonable valuation metrics. Autodesk shows excellent profitability but is weighed down by liquidity and valuation concerns. Overall, Paycom’s ratios are more favorable, while Autodesk’s present a mix of strengths and notable weaknesses.
Strategic Positioning
This section compares the strategic positioning of Autodesk and Paycom, including Market position, Key segments, and Exposure to technological disruption:
Autodesk, Inc.
- Large market cap near 57B, operating in competitive software application sector.
- Diverse segments: Architecture, Engineering, Construction, Manufacturing, Media.
- Faces disruption in 3D design and cloud software markets, adapting with cloud services.
Paycom Software, Inc.
- Smaller market cap about 8.3B, focused on cloud-based HCM software in US.
- Concentrated on human capital management software with recurring revenues.
- Exposed to SaaS market evolution; offers proprietary Bluetooth and analytics.
Autodesk vs Paycom Positioning
Autodesk pursues a diversified business model across multiple professional software segments, providing risk spreading. Paycom focuses narrowly on HCM software with strong recurring revenues but less diversification, implying concentration risk.
Which has the best competitive advantage?
Both companies demonstrate a very favorable economic moat with growing ROIC above WACC, signaling durable competitive advantages. Paycom shows a stronger ROIC trend and higher value creation, indicating a potentially more robust competitive advantage.
Stock Comparison
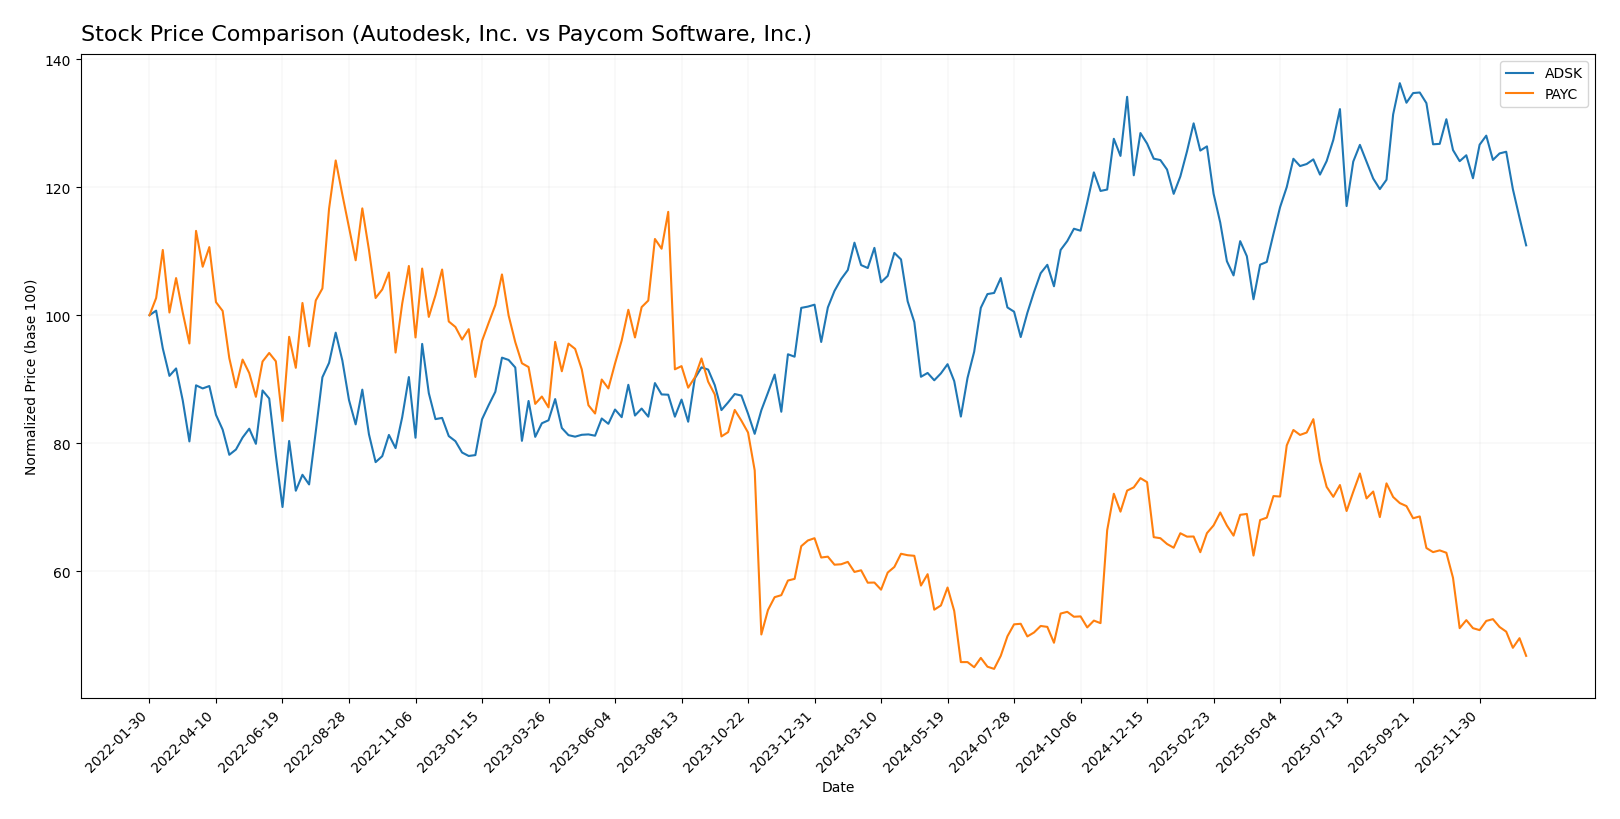
The stock price movements of Autodesk, Inc. (ADSK) and Paycom Software, Inc. (PAYC) over the past year reveal contrasting trends, with ADSK showing moderate gains amid decelerating momentum, while PAYC experiences a notable decline with increasing selling pressure.
Trend Analysis
Autodesk, Inc. (ADSK) recorded a 3.3% price increase over the past 12 months, indicating a bullish trend with decelerating acceleration. The stock’s price ranged between 201.6 and 326.37, with volatility reflected by a standard deviation of 29.87.
Paycom Software, Inc. (PAYC) experienced a 19.64% price decline over the same period, marking a bearish trend with deceleration. The stock fluctuated from a low of 141.96 to a high of 265.71, exhibiting a higher volatility standard deviation of 31.92.
Comparing both, ADSK delivered the highest market performance over the past year, showing resilience with a positive price change, whereas PAYC faced substantial downward pressure and weaker price trends.
Target Prices
The current analyst consensus shows a positive outlook for both Autodesk, Inc. and Paycom Software, Inc.
| Company | Target High | Target Low | Consensus |
|---|---|---|---|
| Autodesk, Inc. | 400 | 343 | 373 |
| Paycom Software, Inc. | 290 | 165 | 215 |
Autodesk’s target consensus at 373 suggests significant upside potential compared to its current price of 265.69 USD. Paycom’s consensus target of 215 also indicates a strong potential gain from its present price of 148.41 USD, reflecting optimistic analyst expectations.
Analyst Opinions Comparison
This section compares analysts’ ratings and grades for Autodesk, Inc. and Paycom Software, Inc.:
Rating Comparison
Autodesk, Inc. Rating
- Rating: B- indicating a very favorable standing.
- Discounted Cash Flow Score: Moderate at 3, suggesting average valuation accuracy.
- ROE Score: Very favorable at 5, reflecting excellent profit generation from equity.
- ROA Score: Favorable at 4, denoting good asset utilization.
- Debt To Equity Score: Very unfavorable at 1, highlighting high financial risk.
- Overall Score: Moderate at 3, reflecting an average overall financial standing.
Paycom Software, Inc. Rating
- Rating: A showing a very favorable assessment.
- Discounted Cash Flow Score: Very favorable at 5, indicating strong valuation accuracy.
- ROE Score: Very favorable at 5, showing top efficiency in equity use.
- ROA Score: Very favorable at 5, indicating excellent asset efficiency.
- Debt To Equity Score: Favorable at 4, suggesting solid balance sheet stability.
- Overall Score: Favorable at 4, indicating better overall financial health.
Which one is the best rated?
Based on the provided data, Paycom Software, Inc. is better rated with an overall score of 4 and higher marks in discounted cash flow, ROA, and debt-to-equity, compared to Autodesk’s moderate overall score of 3 and weaker debt-to-equity score.
Scores Comparison
The scores comparison for Autodesk, Inc. and Paycom Software, Inc. is as follows:
ADSK Scores
- Altman Z-Score: 5.05, indicating a safe zone status, low bankruptcy risk.
- Piotroski Score: 8, classified as very strong financial health.
PAYC Scores
- Altman Z-Score: 3.84, indicating a safe zone status, low bankruptcy risk.
- Piotroski Score: 5, classified as average financial health.
Which company has the best scores?
Based on the provided data, Autodesk has both a higher Altman Z-Score and a stronger Piotroski Score compared to Paycom, indicating stronger financial stability and health.
Grades Comparison
Here is a detailed comparison of the latest grades assigned to Autodesk, Inc. and Paycom Software, Inc.:
Autodesk, Inc. Grades
The table below summarizes recent grade updates from recognized financial institutions for Autodesk, Inc.:
| Grading Company | Action | New Grade | Date |
|---|---|---|---|
| Barclays | Maintain | Overweight | 2025-11-26 |
| Wells Fargo | Maintain | Overweight | 2025-11-26 |
| Deutsche Bank | Upgrade | Buy | 2025-11-26 |
| B of A Securities | Maintain | Neutral | 2025-11-26 |
| Rosenblatt | Maintain | Buy | 2025-11-26 |
| Macquarie | Maintain | Outperform | 2025-11-26 |
| BMO Capital | Maintain | Market Perform | 2025-11-26 |
| Baird | Maintain | Outperform | 2025-11-26 |
| Rosenblatt | Maintain | Buy | 2025-11-24 |
| Baird | Maintain | Outperform | 2025-11-18 |
The overall trend for Autodesk indicates a predominance of buy and outperform ratings, with several firms maintaining positive stances or upgrading their outlooks.
Paycom Software, Inc. Grades
The following table presents recent grades from established grading companies for Paycom Software, Inc.:
| Grading Company | Action | New Grade | Date |
|---|---|---|---|
| Barclays | Maintain | Equal Weight | 2026-01-12 |
| TD Cowen | Maintain | Buy | 2026-01-08 |
| Citigroup | Maintain | Neutral | 2025-12-23 |
| Keybanc | Maintain | Overweight | 2025-11-06 |
| TD Cowen | Maintain | Buy | 2025-11-06 |
| UBS | Maintain | Buy | 2025-11-06 |
| Jefferies | Maintain | Hold | 2025-11-06 |
| JP Morgan | Maintain | Neutral | 2025-11-06 |
| Mizuho | Maintain | Neutral | 2025-11-06 |
| Barclays | Maintain | Equal Weight | 2025-11-06 |
Paycom’s grades show a mixed consensus with several buy ratings but also a substantial number of neutral and hold recommendations.
Which company has the best grades?
Autodesk, Inc. has received stronger grades overall, with a clear consensus towards buy and outperform ratings, suggesting more optimistic analyst sentiment. Paycom Software, Inc. shows a more cautious outlook with a majority of hold and neutral ratings, potentially indicating more moderate expectations from investors.
Strengths and Weaknesses
Below is a comparison of key strengths and weaknesses for Autodesk, Inc. (ADSK) and Paycom Software, Inc. (PAYC) based on their most recent financial and operational data.
| Criterion | Autodesk, Inc. (ADSK) | Paycom Software, Inc. (PAYC) |
|---|---|---|
| Diversification | Highly diversified revenue streams across Architecture, Manufacturing, and Media sectors (largest: $2.94B in Architecture) | Less diversified, mainly dependent on recurring software revenue ($1.73B recurring) with small implementation segment ($24M) |
| Profitability | Strong profitability with net margin at 18.14%, ROIC 18.01%, and ROE 42.43% | Higher profitability; net margin at 26.66%, ROIC 24.86%, ROE 31.85% |
| Innovation | Consistent investment and growing ROIC (+15.4%) indicate durable competitive advantage | Very strong innovation indicated by rapidly growing ROIC (+54.4%) and high value creation |
| Global presence | Established global presence with diversified product lines serving multiple industries | More focused market, primarily US-based payroll and HR tech services |
| Market Share | Large market share in CAD and engineering software with steady revenue growth | Leading position in cloud-based payroll software, strong market penetration in its niche |
Key takeaways: Autodesk shows strength in diversification and global reach with solid profitability, but faces challenges in liquidity ratios. Paycom excels in profitability and innovation with a very favorable moat, though with less diversification. Both companies demonstrate durable competitive advantages suitable for growth-focused investors, with Paycom slightly stronger on profitability metrics.
Risk Analysis
Below is a comparative overview of key risks for Autodesk, Inc. (ADSK) and Paycom Software, Inc. (PAYC) based on the most recent data.
| Metric | Autodesk, Inc. (ADSK) | Paycom Software, Inc. (PAYC) |
|---|---|---|
| Market Risk | High beta 1.466 indicates higher volatility and sensitivity to market moves | Lower beta 0.824 suggests less market volatility exposure |
| Debt level | Moderate debt-to-equity 0.98; debt to assets 23.62% (favorable) | Very low debt-to-equity 0.05; debt to assets 1.42% (very favorable) |
| Regulatory Risk | Moderate, typical for software industry with evolving IP and data laws | Moderate, SaaS industry regulations and data privacy compliance required |
| Operational Risk | Medium, with 15.3K employees and diverse product lines | Medium, smaller workforce (7.3K), dependency on cloud infrastructure |
| Environmental Risk | Low, software business with limited direct environmental impact | Low, primarily cloud-based services with minimal environmental footprint |
| Geopolitical Risk | Moderate, global operations but US headquartered | Moderate, mainly US-focused but subject to global SaaS market shifts |
The most impactful risk for Autodesk is its higher market volatility and elevated valuation multiples, which may lead to price fluctuations. Paycom shows strength in financial stability with very low debt, reducing financial risk. However, both companies face operational and regulatory risks common in the technology and software sectors. Autodesk’s higher leverage and market beta warrant cautious risk management.
Which Stock to Choose?
Autodesk, Inc. (ADSK) shows a favorable income evolution with 12.7% revenue growth in 2025 and strong profitability metrics like an 18.14% net margin and 42.43% ROE. Its debt is moderate with a net debt to EBITDA of 0.62, and the overall rating is very favorable despite some unfavorable valuation ratios.
Paycom Software, Inc. (PAYC) exhibits robust income growth, including 11.19% revenue growth and a 26.66% net margin in 2024. Financial ratios are largely favorable, with low debt (debt-to-equity 0.05) and a strong ROIC of 24.86%. PAYC holds a very favorable rating and demonstrates solid financial stability.
Considering ratings and the comprehensive analysis of income statements and financial ratios, PAYC may appear more attractive for investors seeking growth and strong financial health, while ADSK might appeal to those valuing sustained profitability with moderate leverage. The choice could depend on the investor’s risk tolerance and investment strategy.
Disclaimer: Investment carries a risk of loss of initial capital. The past performance is not a reliable indicator of future results. Be sure to understand risks before making an investment decision.
Go Further
I encourage you to read the complete analyses of Autodesk, Inc. and Paycom Software, Inc. to enhance your investment decisions: