Autodesk, Inc. and PagerDuty, Inc. are two prominent players in the software application industry, each driving innovation in distinct yet overlapping tech sectors. Autodesk excels in 3D design and engineering software, while PagerDuty focuses on digital operations management with advanced machine learning. This comparison aims to help investors navigate their unique strengths and market positions to identify the most promising opportunity for a balanced and informed portfolio. Let’s explore which company stands out for your investment goals.
Table of contents
Companies Overview
I will begin the comparison between Autodesk and PagerDuty by providing an overview of these two companies and their main differences.
Autodesk Overview
Autodesk, Inc. is a leading provider of 3D design, engineering, and entertainment software worldwide. Its product suite includes AutoCAD, Fusion 360, and BIM 360, serving professionals in architecture, engineering, construction, manufacturing, and media industries. Headquartered in San Rafael, California, Autodesk leverages a broad portfolio to support complex design and visualization needs, maintaining a significant market presence with a market cap of approximately 56.6B USD.
PagerDuty Overview
PagerDuty, Inc. offers a digital operations management platform that uses machine learning to analyze data from software-enabled systems and devices. The company serves multiple sectors such as technology, telecommunications, retail, and financial services, focusing on operational efficiency and incident response. Founded in 2009 and based in San Francisco, PagerDuty has a market cap near 1.03B USD and a smaller workforce relative to Autodesk.
Key similarities and differences
Both Autodesk and PagerDuty operate in the software application industry within the technology sector, focusing on improving operational capabilities for their clients. Autodesk emphasizes design and engineering software for creative and industrial professionals, while PagerDuty concentrates on digital operations management and real-time incident response. Their market caps and employee counts differ significantly, reflecting Autodesk’s broader scale and product diversity versus PagerDuty’s specialized platform approach.
Income Statement Comparison
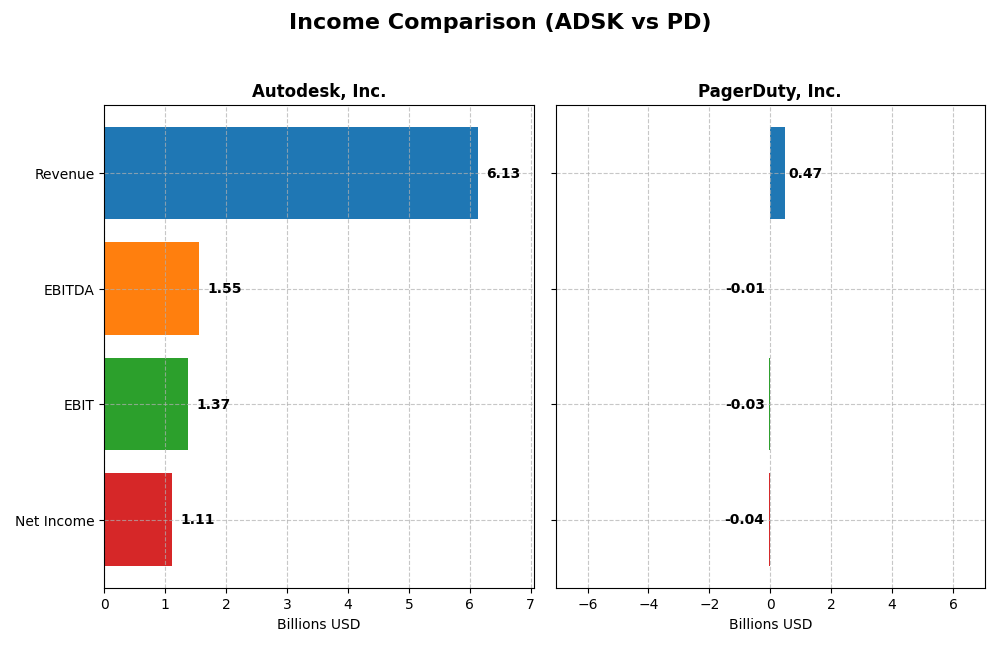
The table below compares the key income statement metrics for Autodesk, Inc. and PagerDuty, Inc. for the most recent fiscal year 2025.
| Metric | Autodesk, Inc. (ADSK) | PagerDuty, Inc. (PD) |
|---|---|---|
| Market Cap | 56.6B | 1.03B |
| Revenue | 6.13B | 467.5M |
| EBITDA | 1.55B | -11.9M |
| EBIT | 1.37B | -32.5M |
| Net Income | 1.11B | -42.7M |
| EPS | 5.17 | -0.59 |
| Fiscal Year | 2025 | 2025 |
Income Statement Interpretations
Autodesk, Inc.
Autodesk’s revenue grew steadily from $3.79B in 2021 to $6.13B in 2025, marking a 61.7% increase overall. Net income showed volatility, peaking in 2021 at $1.21B but declining to $1.11B in 2025. Margins remained strong with a gross margin of 90.6% and net margin of 18.1%. The latest year saw revenue growth of 12.7% and net margin improvement by 8.9%.
PagerDuty, Inc.
PagerDuty’s revenue nearly doubled from $214M in 2021 to $467M in 2025, achieving a 118.9% growth over five years. Net income remained negative but improved from a loss of $69M in 2021 to $-43M in 2025. Gross margin stayed favorable at 83%, though EBIT and net margins were negative. The most recent year showed 8.5% revenue growth and a significant 51.8% net margin improvement.
Which one has the stronger fundamentals?
Autodesk demonstrates stronger fundamentals with consistently positive net income, high margins, and robust growth in revenue and profitability metrics. PagerDuty shows strong revenue growth but continues to operate at a loss with negative margins despite recent improvements. Autodesk’s stable profitability and margin profile present a more favorable income statement picture compared to PagerDuty’s ongoing losses.
Financial Ratios Comparison
The table below compares key financial ratios for Autodesk, Inc. (ADSK) and PagerDuty, Inc. (PD) based on their most recent fiscal year data ending January 31, 2025.
| Ratios | Autodesk, Inc. (ADSK) | PagerDuty, Inc. (PD) |
|---|---|---|
| ROE | 42.4% | -32.9% |
| ROIC | 18.0% | -9.7% |
| P/E | 60.2 | -39.9 |
| P/B | 25.5 | 13.1 |
| Current Ratio | 0.68 | 1.87 |
| Quick Ratio | 0.68 | 1.87 |
| D/E | 0.98 | 3.57 |
| Debt-to-Assets | 23.6% | 50.0% |
| Interest Coverage | 0 | -6.46 |
| Asset Turnover | 0.57 | 0.50 |
| Fixed Asset Turnover | 21.4 | 16.6 |
| Payout ratio | 0 | 0 |
| Dividend yield | 0 | 0 |
Interpretation of the Ratios
Autodesk, Inc.
Autodesk shows strong profitability with a net margin of 18.14%, ROE at 42.43%, and ROIC of 18.01%, indicating efficient capital use. However, valuation ratios like P/E at 60.2 and P/B at 25.54 are high, suggesting premium pricing. Liquidity ratios are weak with a current ratio of 0.68. The company does not pay dividends, focusing on reinvestment and growth.
PagerDuty, Inc.
PagerDuty exhibits unfavorable profitability ratios, including a negative net margin (-9.14%) and ROE (-32.92%), reflecting ongoing losses. Liquidity is strong with a current ratio of 1.87, but high leverage (D/E of 3.57) and poor interest coverage (-3.51) raise concerns. No dividends are paid, consistent with its reinvestment strategy and high growth phase.
Which one has the best ratios?
Autodesk presents a more favorable profile overall, with superior profitability and manageable leverage despite weaker liquidity and high valuation. PagerDuty struggles with losses and high debt but maintains better liquidity. The evaluation favors Autodesk’s stronger operational efficiency and returns, while PagerDuty’s financial health remains less favorable.
Strategic Positioning
This section compares the strategic positioning of Autodesk and PagerDuty including market position, key segments, and exposure to technological disruption:
Autodesk
- Leading software application provider with significant market cap and moderate competitive pressure.
- Diversified revenue streams from Architecture, Engineering, Construction, Manufacturing, and Media.
- Exposure to ongoing tech advances through cloud-based construction management and 3D design tools.
PagerDuty
- Smaller market cap with lower beta, facing competitive pressure in digital operations management software.
- Focused on digital operations management platform serving multiple industries including tech and financial services.
- Uses machine learning for data correlation and prediction, integrating AI into digital operations management.
Autodesk vs PagerDuty Positioning
Autodesk adopts a diversified approach across multiple professional software markets, while PagerDuty focuses on a concentrated digital operations management niche. Autodesk’s scale offers broad market coverage; PagerDuty’s specialization targets rapid technological integration with smaller scale.
Which has the best competitive advantage?
Autodesk demonstrates a very favorable moat with ROIC well above WACC and growing profitability, indicating strong value creation. PagerDuty shows a slightly unfavorable moat, shedding value despite improving profitability trends.
Stock Comparison
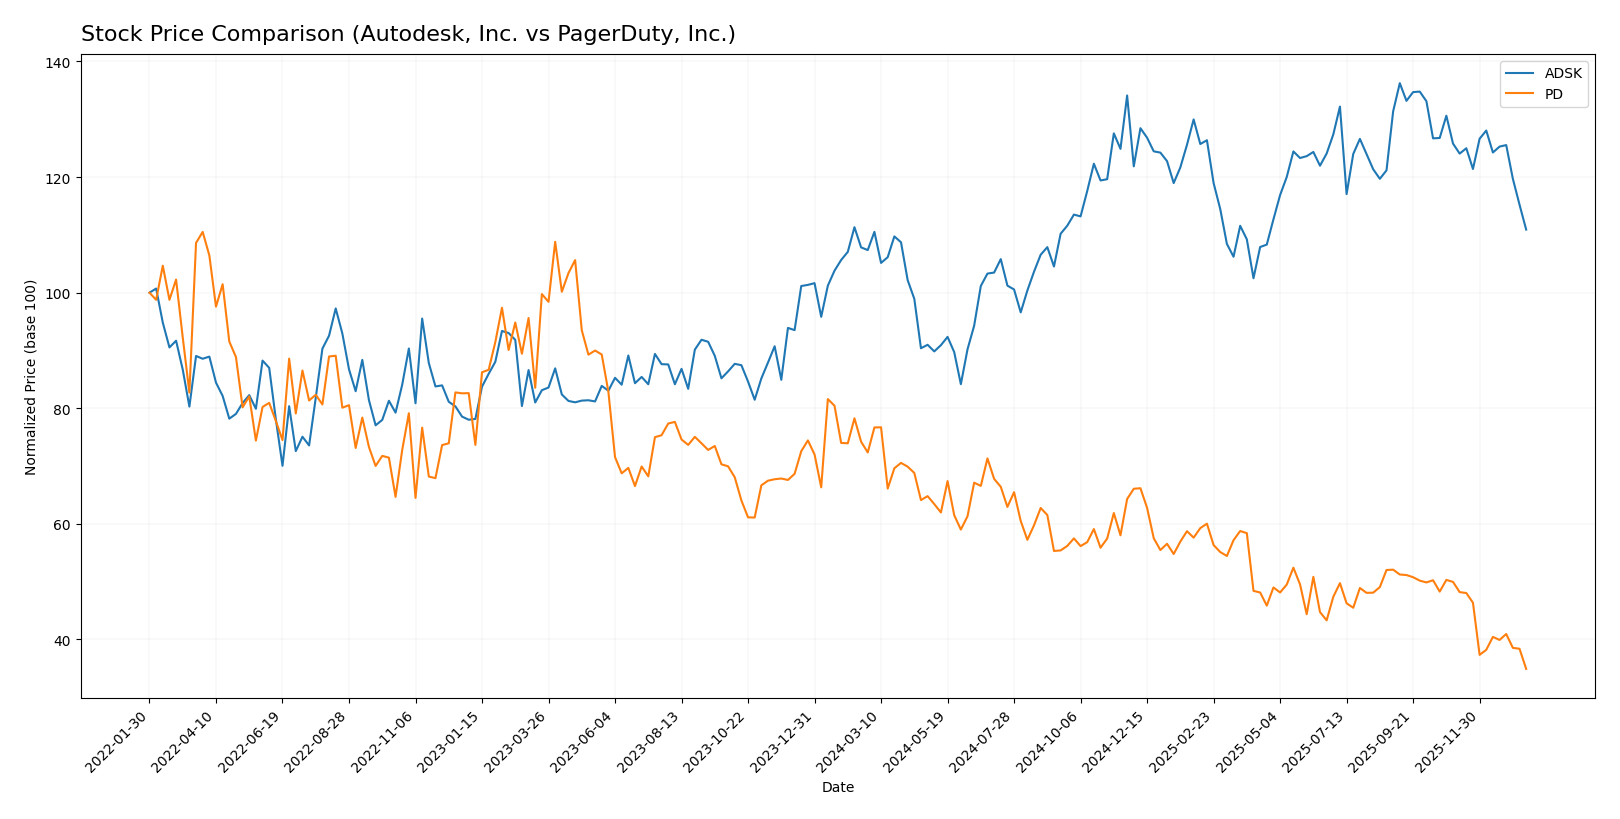
The stock prices of Autodesk, Inc. and PagerDuty, Inc. over the past year reveal contrasting dynamics, with Autodesk showing modest gains amid decelerating momentum, while PagerDuty experiences a pronounced decline and sustained bearish pressure.
Trend Analysis
Autodesk, Inc. (ADSK) recorded a 3.3% increase over the past 12 months, indicating a bullish trend with decelerating acceleration and high volatility, peaking at 326.37 and bottoming at 201.6. Recent weeks show a reversal with an 11.83% drop.
PagerDuty, Inc. (PD) faced a steep 51.76% decline over the same period, confirming a strong bearish trend with decelerating losses and low volatility, reaching a high of 24.66 and a low of 11.22. The recent trend worsened with a further 30.14% decrease.
Comparing both, Autodesk outperformed PagerDuty in market performance across the last year, maintaining positive growth while PagerDuty’s stock sharply deteriorated.
Target Prices
Here is the consensus target price outlook from verified analysts for Autodesk, Inc. and PagerDuty, Inc.
| Company | Target High | Target Low | Consensus |
|---|---|---|---|
| Autodesk, Inc. | 400 | 343 | 373 |
| PagerDuty, Inc. | 19 | 15 | 16.2 |
Analysts expect Autodesk shares to appreciate significantly from the current price of $265.69, while PagerDuty’s consensus target of $16.2 suggests moderate upside compared to its current price of $11.22.
Analyst Opinions Comparison
This section compares analysts’ ratings and grades for Autodesk, Inc. and PagerDuty, Inc.:
Rating Comparison
Autodesk, Inc. Rating
- Rating: B-, classified as Very Favorable.
- Discounted Cash Flow Score: 3, Moderate level.
- ROE Score: 5, Very Favorable.
- ROA Score: 4, Favorable.
- Debt To Equity Score: 1, Very Unfavorable.
- Overall Score: 3, Moderate level.
PagerDuty, Inc. Rating
- Rating: A-, classified as Very Favorable.
- Discounted Cash Flow Score: 5, Very Favorable.
- ROE Score: 5, Very Favorable.
- ROA Score: 5, Very Favorable.
- Debt To Equity Score: 1, Very Unfavorable.
- Overall Score: 4, Favorable.
Which one is the best rated?
Based strictly on the provided data, PagerDuty, Inc. holds a higher rating (A-) and a superior overall score (4) compared to Autodesk’s B- rating and overall score of 3. PagerDuty also outperforms Autodesk in discounted cash flow and return on assets scores.
Scores Comparison
Here is a comparison of the Altman Z-Score and Piotroski Score for Autodesk and PagerDuty:
Autodesk Scores
- Altman Z-Score: 5.05, indicating a safe zone, low bankruptcy risk.
- Piotroski Score: 8, classified as very strong financial health.
PagerDuty Scores
- Altman Z-Score: 1.26, indicating a distress zone, high bankruptcy risk.
- Piotroski Score: 7, classified as strong financial health.
Which company has the best scores?
Autodesk has the best scores with a significantly higher Altman Z-Score in the safe zone and a very strong Piotroski Score. PagerDuty’s scores indicate higher financial risk and slightly weaker financial health.
Grades Comparison
The following grades summarize analyst ratings and consensus for Autodesk, Inc. and PagerDuty, Inc.:
Autodesk, Inc. Grades
Below is a summary of recent analyst grades for Autodesk, Inc.
| Grading Company | Action | New Grade | Date |
|---|---|---|---|
| Barclays | Maintain | Overweight | 2025-11-26 |
| Wells Fargo | Maintain | Overweight | 2025-11-26 |
| Deutsche Bank | Upgrade | Buy | 2025-11-26 |
| B of A Securities | Maintain | Neutral | 2025-11-26 |
| Rosenblatt | Maintain | Buy | 2025-11-26 |
| Macquarie | Maintain | Outperform | 2025-11-26 |
| BMO Capital | Maintain | Market Perform | 2025-11-26 |
| Baird | Maintain | Outperform | 2025-11-26 |
| Rosenblatt | Maintain | Buy | 2025-11-24 |
| Baird | Maintain | Outperform | 2025-11-18 |
Autodesk’s grades show a strong bias toward buy-side ratings, with multiple analysts maintaining Overweight, Buy, and Outperform ratings.
PagerDuty, Inc. Grades
Below is a summary of recent analyst grades for PagerDuty, Inc.
| Grading Company | Action | New Grade | Date |
|---|---|---|---|
| Truist Securities | Maintain | Buy | 2026-01-07 |
| RBC Capital | Downgrade | Sector Perform | 2026-01-05 |
| TD Cowen | Maintain | Buy | 2025-11-26 |
| Craig-Hallum | Downgrade | Hold | 2025-11-26 |
| Morgan Stanley | Maintain | Equal Weight | 2025-11-26 |
| RBC Capital | Maintain | Outperform | 2025-11-26 |
| Truist Securities | Maintain | Buy | 2025-11-19 |
| Baird | Maintain | Neutral | 2025-09-04 |
| RBC Capital | Maintain | Outperform | 2025-09-04 |
| Canaccord Genuity | Maintain | Buy | 2025-09-04 |
PagerDuty’s ratings are mixed, featuring several downgrades and a consensus leaning toward Hold or Sector Perform, showing more caution among analysts.
Which company has the best grades?
Autodesk, Inc. exhibits stronger and more consistent buy-side grades compared to PagerDuty, Inc., which has a more mixed rating profile including downgrades. This disparity could affect investor sentiment by signaling greater confidence in Autodesk’s prospects.
Strengths and Weaknesses
Below is a comparative overview of the key strengths and weaknesses of Autodesk, Inc. (ADSK) and PagerDuty, Inc. (PD) based on the latest financial and strategic data for 2025.
| Criterion | Autodesk, Inc. (ADSK) | PagerDuty, Inc. (PD) |
|---|---|---|
| Diversification | Strongly diversified across Architecture, Manufacturing, AutoCAD, and Media segments with a robust revenue base (total exceeding $6B in 2025). | Limited diversification; primarily focused on digital operations management software. |
| Profitability | High profitability with 18.14% net margin and 42.43% ROE; creates significant value (ROIC 18.01% vs. WACC 10.42%). | Unprofitable with -9.14% net margin and negative ROE; ROIC -9.66%, below WACC of 5.85%, indicating value erosion. |
| Innovation | Consistent innovation in CAD and engineering software, supported by a durable competitive moat and growing ROIC trend (+15.4%). | Moderate innovation with growing ROIC trend (+3.3%) but still value-destroying; struggles with profitability. |
| Global presence | Well-established global footprint in multiple industries including AEC and manufacturing. | Primarily serves digital operations markets, with less broad global penetration. |
| Market Share | Leading market share in CAD and AEC software sectors, supported by large and growing revenues. | Smaller market share in incident response and operations software, facing stiff competition. |
Key takeaways: Autodesk demonstrates strong diversification, profitability, and a durable competitive advantage with growing returns, making it a more stable investment. PagerDuty, while showing improving profitability trends, remains unprofitable and less diversified, posing higher risk for investors.
Risk Analysis
Below is a comparative table of key risk metrics for Autodesk, Inc. (ADSK) and PagerDuty, Inc. (PD) based on the most recent 2025 fiscal data:
| Metric | Autodesk, Inc. (ADSK) | PagerDuty, Inc. (PD) |
|---|---|---|
| Market Risk (Beta) | 1.47 (high volatility) | 0.63 (lower volatility) |
| Debt Level (D/E) | 0.98 (moderate) | 3.57 (high leverage) |
| Regulatory Risk | Moderate (US tech sector) | Moderate (US & global tech) |
| Operational Risk | Moderate (complex software solutions) | Moderate (digital ops platform) |
| Environmental Risk | Low (software sector) | Low (software sector) |
| Geopolitical Risk | Moderate (global sales exposure) | Moderate (international operations) |
Autodesk carries higher market volatility risk but maintains moderate debt and strong financial health, with a safe Altman Z-score and very strong Piotroski score. PagerDuty, while less volatile, has significant leverage and a distress-level Altman Z-score, indicating higher bankruptcy risk. The most impactful risks for PagerDuty are its financial distress and debt burden, while Autodesk’s key concern lies in valuation multiples and liquidity ratios. Investors should weigh these factors cautiously considering their risk tolerance.
Which Stock to Choose?
Autodesk, Inc. (ADSK) shows a favorable income evolution with consistent revenue and profit growth, strong profitability metrics, manageable debt levels, and a very favorable overall rating. Its financial ratios reveal a balanced profile with some unfavorable valuation multiples but strong returns on equity and capital. The company has a very favorable moat, indicating durable competitive advantage and value creation.
PagerDuty, Inc. (PD) displays a positive income growth trajectory yet remains unprofitable with negative margins and returns. Its financial ratios are mostly unfavorable, reflecting challenges in debt management and profitability, although liquidity ratios are strong. The rating is very favorable overall, but the company is slightly unfavorable in moat evaluation, signaling value destruction despite improving profitability.
For investors, ADSK’s very favorable moat and neutral global ratios alongside solid income growth might appeal to those seeking quality and durable competitive advantage. Conversely, PD’s favorable rating yet unfavorable moat and weaker profitability could be seen as suitable for risk-tolerant or growth-focused profiles willing to accept volatility for potential earnings improvement.
Disclaimer: Investment carries a risk of loss of initial capital. The past performance is not a reliable indicator of future results. Be sure to understand risks before making an investment decision.
Go Further
I encourage you to read the complete analyses of Autodesk, Inc. and PagerDuty, Inc. to enhance your investment decisions: