Home > Comparison > Technology > ADSK vs MTCH
The strategic rivalry between Autodesk, Inc. and Match Group, Inc. shapes innovation within the technology sector. Autodesk operates as a capital-intensive software powerhouse focused on 3D design and engineering applications. In contrast, Match Group commands a high-margin, consumer-centric dating platform portfolio. This analysis pits Autodesk’s industrial software scale against Match’s digital community growth. I aim to reveal which company offers superior risk-adjusted potential for a balanced, diversified portfolio in today’s evolving tech landscape.

Table of contents
Companies Overview
Autodesk and Match Group command significant roles in their respective software niches, shaping distinct market dynamics.
Autodesk, Inc.: Leader in 3D Design and Engineering Software
Autodesk dominates the application software industry with a comprehensive suite for 3D design, engineering, and entertainment. Its revenue streams come from subscription sales of tools like AutoCAD and Fusion 360, targeting professionals in architecture, manufacturing, and media. In 2026, Autodesk emphasizes cloud-based collaboration and integrated design workflows to strengthen its competitive edge.
Match Group, Inc.: Powerhouse in Digital Dating Services
Match Group operates a broad portfolio of dating platforms including Tinder, Match, and Hinge. It generates revenue primarily through subscription fees and premium user services across global markets. The company’s 2026 strategy centers on expanding its user base and enhancing engagement through innovation in AI-driven matchmaking and personalized experiences.
Strategic Collision: Similarities & Divergences
Both companies excel in software but serve vastly different markets—Autodesk focuses on professional design ecosystems, while Match Group builds consumer-centric social platforms. Their primary competitive battle is for user retention in subscription models, yet Autodesk invests in complex technical software, whereas Match Group prioritizes user growth and engagement metrics. These distinctions create sharply contrasting investment profiles rooted in enterprise versus consumer technology dynamics.
Income Statement Comparison
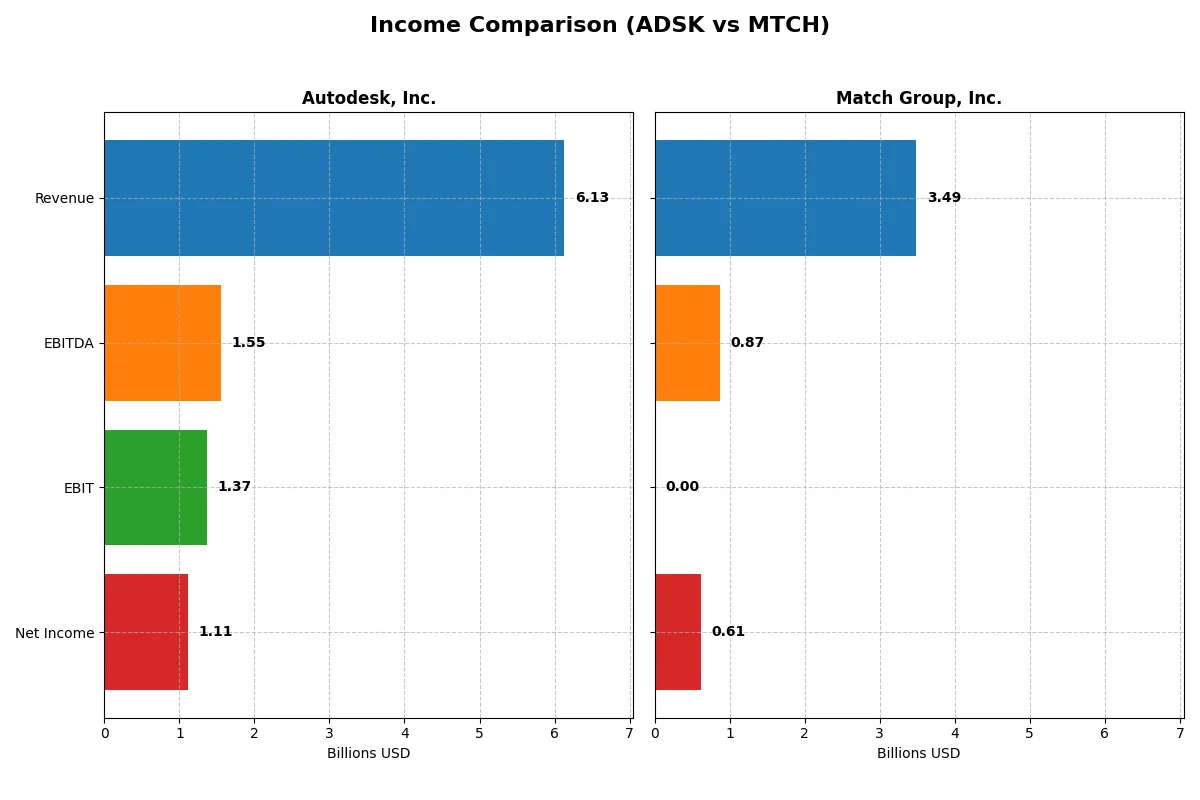
The following data dissects the core profitability and scalability of Autodesk, Inc. and Match Group, Inc. to reveal who dominates the bottom line:
| Metric | Autodesk (ADSK) | Match Group (MTCH) |
|---|---|---|
| Revenue | 6.13B | 3.49B |
| Cost of Revenue | 578M | 948M |
| Operating Expenses | 4.20B | 1.67B |
| Gross Profit | 5.55B | 2.54B |
| EBITDA | 1.55B | 873M |
| EBIT | 1.37B | 0 |
| Interest Expense | 0 | 148M |
| Net Income | 1.11B | 613M |
| EPS | 5.17 | 0 |
| Fiscal Year | 2025 | 2025 |
Income Statement Analysis: The Bottom-Line Duel
This income statement comparison reveals which company executes its business model with superior efficiency and profit generation.
Autodesk, Inc. Analysis
Autodesk’s revenue rose steadily from $3.79B in 2021 to $6.13B in 2025, reflecting a 12.7% growth in the last year alone. The company boasts a robust gross margin above 90%, signaling efficient cost control. Its net margin of 18.14% in 2025 and an 8.9% net margin growth indicate healthy profitability momentum and operational leverage.
Match Group, Inc. Analysis
Match Group’s revenue grew modestly from $2.98B in 2021 to $3.49B in 2025, showing only 0.22% growth last year. The firm maintains a solid gross margin near 73%, though EBIT margin collapsed to zero in 2025, indicating operational challenges. Despite this, its net margin improved to 17.59%, driven by effective cost management and interest expense reduction.
Margin Strength vs. Revenue Expansion
Autodesk outperforms with superior revenue growth and higher gross and net margins, demonstrating strong operational efficiency. Match Group shows slower top-line expansion and a concerning EBIT margin decline, though net margin remains competitive. For investors, Autodesk presents a more compelling profile of scalable profitability, while Match Group faces risks balancing growth with profitability.
Financial Ratios Comparison
These vital ratios act as a diagnostic tool to expose the underlying fiscal health, valuation premiums, and capital efficiency:
| Ratios | Autodesk, Inc. (ADSK) | Match Group, Inc. (MTCH) |
|---|---|---|
| ROE | 42.4% | -8.7% |
| ROIC | 18.0% | 16.4% |
| P/E | 60.2 | 15.4 |
| P/B | 25.5 | -133.7 |
| Current Ratio | 0.68 | 2.54 |
| Quick Ratio | 0.68 | 2.54 |
| D/E (Debt-to-Equity) | 0.98 | 0 |
| Debt-to-Assets | 23.6% | 0 |
| Interest Coverage | 0 | -5.91 |
| Asset Turnover | 0.57 | 0 |
| Fixed Asset Turnover | 21.4 | 0 |
| Payout Ratio | 0 | 30.4% |
| Dividend Yield | 0 | 0 |
| Fiscal Year | 2025 | 2025 |
Efficiency & Valuation Duel: The Vital Signs
Financial ratios serve as a company’s DNA, revealing hidden risks and operational excellence that guide investors through complexity.
Autodesk, Inc.
Autodesk boasts a strong 42.43% ROE and an 18.14% net margin, signaling robust profitability and efficient capital use. However, its elevated P/E of 60.2 and P/B of 25.54 mark the stock as expensive and stretched. The firm reinvests heavily in R&D, foregoing dividends to fuel growth and innovation.
Match Group, Inc.
Match Group posts a 17.59% net margin but shows a 0% ROE and ROIC, raising concerns about profitability sustainability. Its zero P/E and P/B ratios suggest data limitations or valuation challenges. Shareholder returns lack dividends and show weak operational efficiency, as indicated by unfavorable liquidity and coverage ratios.
Premium Valuation vs. Operational Safety
Autodesk offers a compelling mix of high profitability and aggressive investment, though at a premium valuation. Match Group’s metrics signal operational stress and valuation uncertainty. Investors seeking growth and innovation may prefer Autodesk’s profile, while those wary of stretched multiples should exercise caution.
Which one offers the Superior Shareholder Reward?
I observe Autodesk (ADSK) pays no dividends but generates robust free cash flow of 7/share in 2025, reinvesting heavily in growth. Match Group (MTCH) offers a dividend payout ratio of 30%, yet its dividend yield is zero, signaling limited cash returns. Autodesk lacks buybacks but sustains high operating margins and cash flow coverage, ensuring sustainable value creation. Match Group’s leverage and erratic cash ratios raise sustainability concerns despite modest dividends. I conclude Autodesk offers superior total shareholder reward in 2026 through reinvestment and free cash flow strength, outpacing Match’s riskier dividend model.
Comparative Score Analysis: The Strategic Profile
The radar chart reveals the fundamental DNA and trade-offs of Autodesk, Inc. and Match Group, Inc., highlighting their core financial strengths and vulnerabilities:
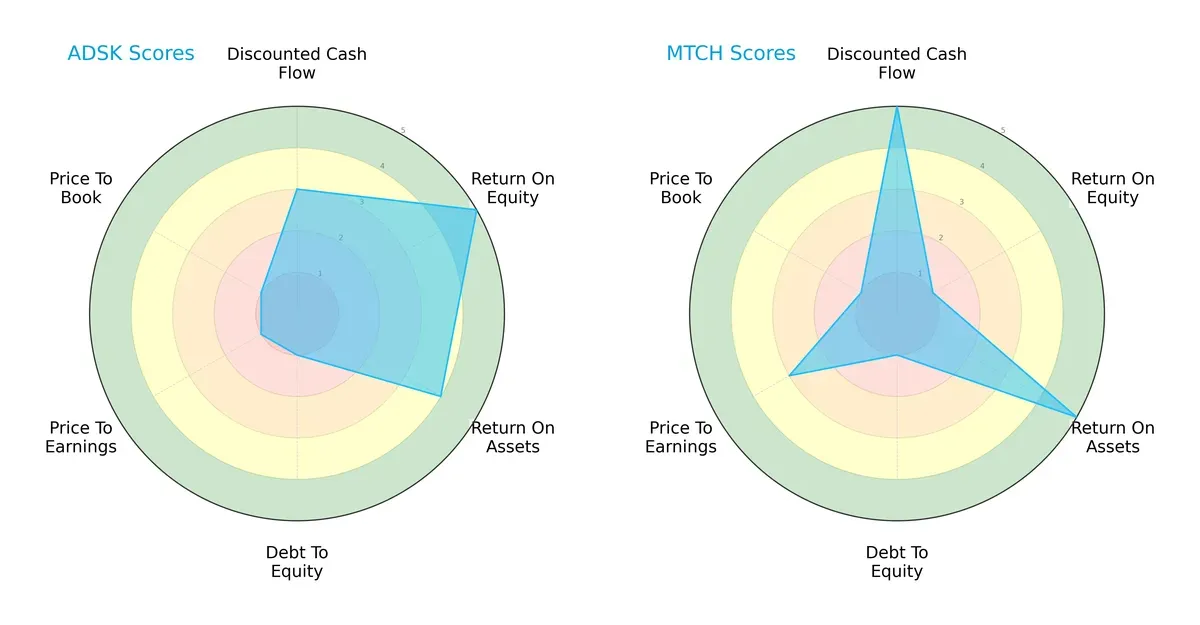
Autodesk shows strength in Return on Equity (5) and Return on Assets (4), signaling efficient profit generation and asset use. However, it struggles with debt and valuation, scoring 1 in Debt/Equity, P/E, and P/B ratios. Match Group excels in Discounted Cash Flow (5) and ROA (5), but its very low ROE (1) reveals weaker equity returns. Both suffer from high leverage risk (Debt/Equity 1). Autodesk’s profile is more balanced with operational efficiency, while Match relies heavily on cash flow valuation advantages.
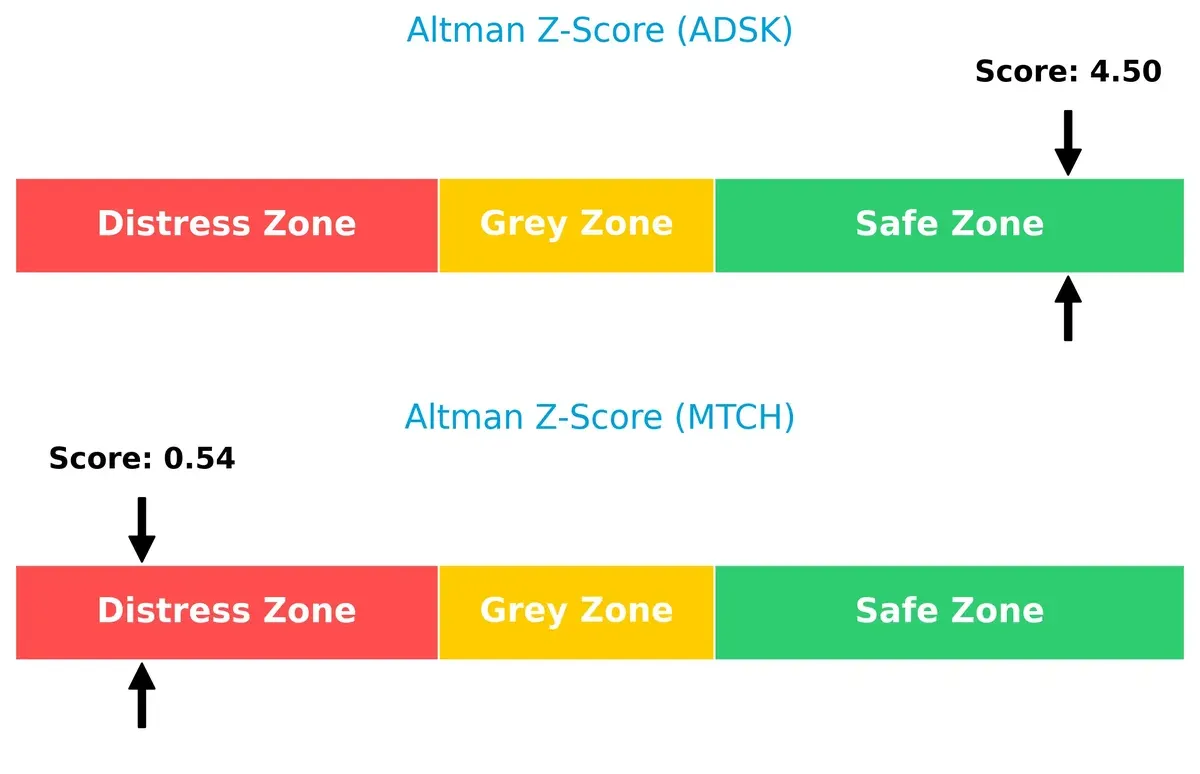
Bankruptcy Risk: Solvency Showdown
Autodesk’s Altman Z-Score of 4.5 places it securely in the safe zone, reflecting strong financial stability. Match’s score of 0.5 signals distress, implying heightened bankruptcy risk amid current market pressures:
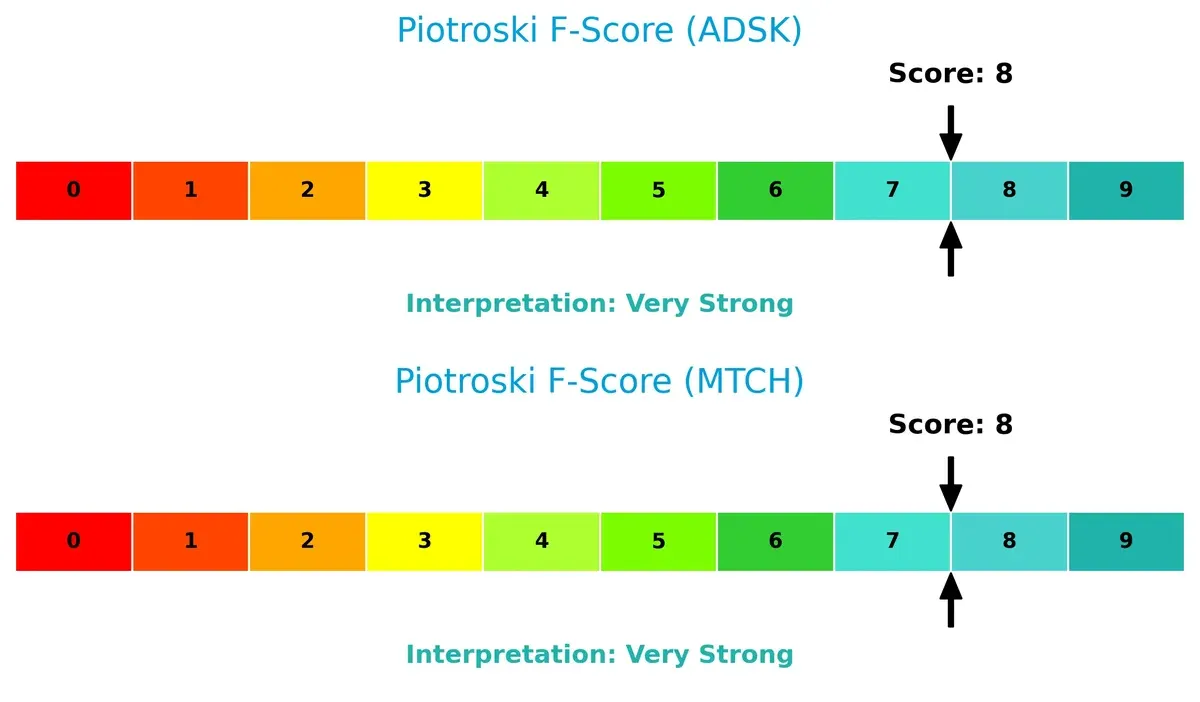
Financial Health: Quality of Operations
Both companies register a Piotroski F-Score of 8, indicating very strong financial health. They demonstrate solid profitability, liquidity, and operational efficiency, with no immediate red flags in internal metrics:
How are the two companies positioned?
This section dissects Autodesk and Match Group’s operational DNA by comparing revenue distribution and internal dynamics. The final goal is to confront their economic moats to identify which model delivers the most resilient, sustainable competitive advantage today.
Revenue Segmentation: The Strategic Mix
This visual comparison dissects how Autodesk, Inc. and Match Group, Inc. diversify their income streams and where their primary sector bets lie:
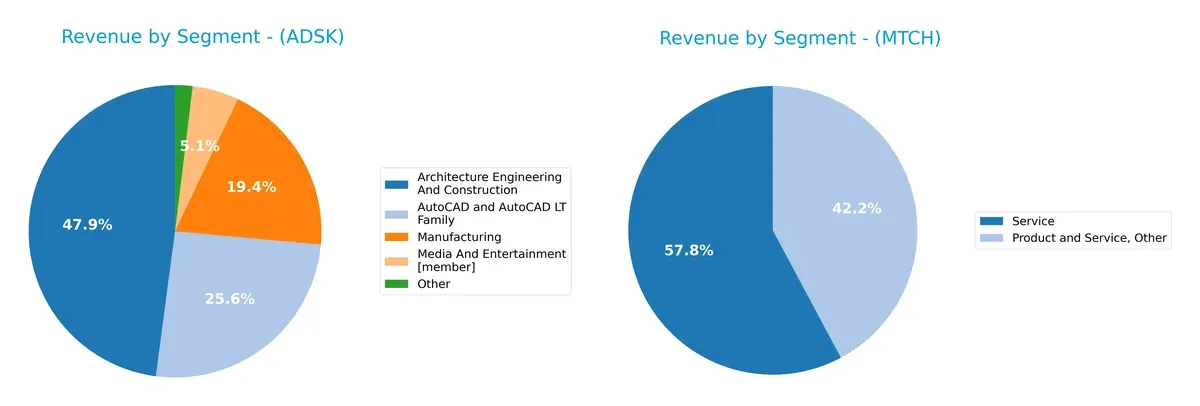
Autodesk anchors its revenue in Architecture Engineering And Construction at $2.94B, complemented by AutoCAD ($1.57B) and Manufacturing ($1.19B), showing a broad portfolio. Match Group relies heavily on its core dating services, with $2.01B in 2019, lacking the diversification Autodesk enjoys. Autodesk’s mix reduces concentration risk and strengthens ecosystem lock-in, while Match Group’s dependence on a single segment exposes it to market shifts in digital dating trends.
Strengths and Weaknesses Comparison
This table compares the strengths and weaknesses of Autodesk, Inc. and Match Group, Inc.:
Autodesk Strengths
- Diversified product portfolio across architecture, manufacturing, media sectors
- Strong profitability with 18.14% net margin and 42.43% ROE
- Favorable debt to assets at 23.62% and infinite interest coverage
- Significant global presence with revenues across Americas, EMEA, Asia Pacific
Match Group Strengths
- Favorable net margin at 17.59% despite limited profitability metrics
- Favorable price to earnings and price to book ratios
- Low debt levels with favorable debt to equity and debt to assets ratios
- Solid presence in US and non-US markets with revenues exceeding 1.5B in both
Autodesk Weaknesses
- High P/E ratio (60.2) and P/B ratio (25.54) indicating possible overvaluation
- Low liquidity ratios with current and quick ratio at 0.68
- Weighted average cost of capital (10.34%) unfavorable compared to ROIC
- No dividend yield, which may deter income-focused investors
Match Group Weaknesses
- Zero or unavailable ROE and ROIC indicating weak capital efficiency
- Unfavorable liquidity with zero current and quick ratios
- Negative interest coverage suggests financial stress
- Unfavorable asset turnover ratios and lack of dividend yield
Autodesk shows strength in profitability and diversified revenue streams but faces valuation and liquidity challenges. Match Group benefits from low leverage and solid market presence yet struggles with profitability, efficiency, and liquidity metrics, impacting its financial robustness.
The Moat Duel: Analyzing Competitive Defensibility
A true structural moat shields long-term profits from relentless competition erosion. Let’s dissect the core moats of two industry players:
Autodesk, Inc.: Intangible Assets and Network Effects Powerhouse
Autodesk leverages its vast software ecosystem and strong brand in 3D design, driving high ROIC above WACC by 7.7%. Its robust margins and rising profitability reflect a durable competitive advantage. Expansion into cloud-based construction and manufacturing software deepens this moat in 2026.
Match Group, Inc.: Network Effects in the Dating Arena
Match Group’s portfolio of brands builds network effects, yet its ROIC trend declines sharply, signaling pressure on capital efficiency. Unlike Autodesk’s robust margin profile, Match faces margin compression and stagnant revenue growth, though international market expansion offers some upside.
Intangible Assets vs. Network Effects: Who Holds the Deeper Moat?
Autodesk’s tangible financial strength and growing ROIC clearly signal a wider, more durable moat than Match’s eroding returns and weaker profitability. I see Autodesk better equipped to defend and grow its market share amid intensifying competition.
Which stock offers better returns?
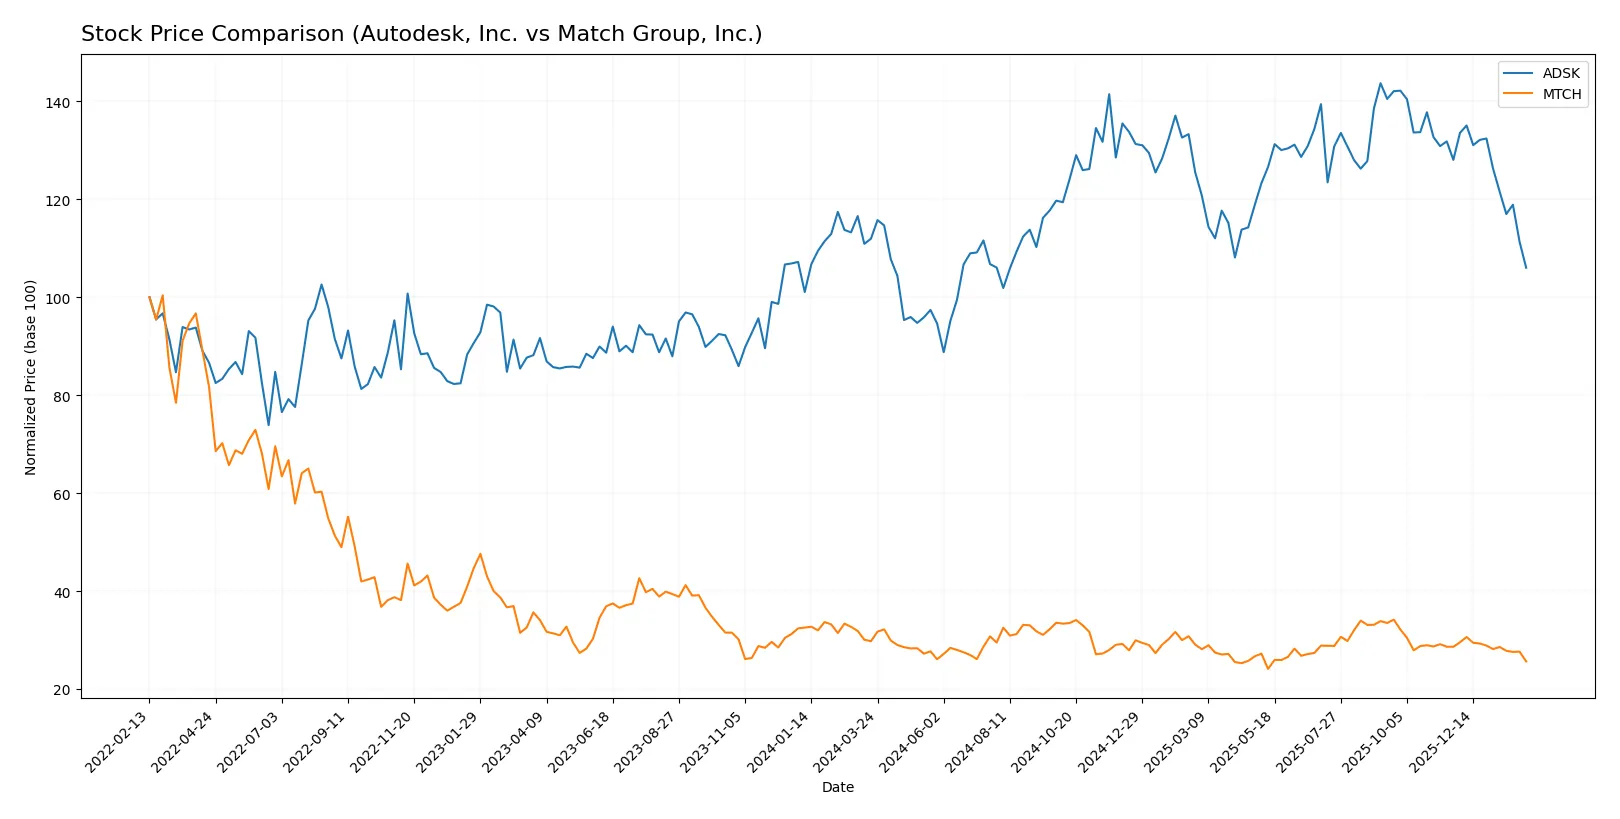
The past year shows Autodesk, Inc. and Match Group, Inc. both faced bearish trends, with Autodesk’s price decline slowing and Match Group’s more steady but sharper drop.
Trend Comparison
Autodesk’s stock fell 5.29% over the past year, showing a bearish trend with decelerating losses. Volatility is high, ranging from $201.6 to $326.37, signaling wide price swings.
Match Group’s stock declined 13.86% over the same period, also bearish with decelerating losses. Its price moved between $27.18 and $38.51, showing lower volatility than Autodesk.
Comparing trends, Autodesk’s smaller loss and higher volatility contrast with Match Group’s deeper decline and steadier trend. Autodesk delivered higher market performance.
Target Prices
The consensus target prices indicate solid upside potential for both Autodesk, Inc. and Match Group, Inc.
| Company | Target Low | Target High | Consensus |
|---|---|---|---|
| Autodesk, Inc. | 343 | 400 | 373 |
| Match Group, Inc. | 33 | 43 | 36.29 |
Analysts expect Autodesk’s shares to climb roughly 55% from the current $240.79, reflecting confidence in its software moat. Match Group’s target implies a 25% gain from $28.90, signaling optimism amid competitive dating platforms.

Don’t Let Luck Decide Your Entry Point
Optimize your entry points with our advanced ProRealTime indicators. You’ll get efficient buy signals with precise price targets for maximum performance. Start outperforming now!
How do institutions grade them?
Here is a comparison of the latest institutional grades for Autodesk, Inc. and Match Group, Inc.:
Autodesk, Inc. Grades
The table below shows recent grades assigned to Autodesk by reputable financial institutions.
| Grading Company | Action | New Grade | Date |
|---|---|---|---|
| JP Morgan | Upgrade | Overweight | 2026-02-02 |
| Barclays | Maintain | Overweight | 2025-11-26 |
| Macquarie | Maintain | Outperform | 2025-11-26 |
| Wells Fargo | Maintain | Overweight | 2025-11-26 |
| Deutsche Bank | Upgrade | Buy | 2025-11-26 |
| Rosenblatt | Maintain | Buy | 2025-11-26 |
| BMO Capital | Maintain | Market Perform | 2025-11-26 |
| Baird | Maintain | Outperform | 2025-11-26 |
| B of A Securities | Maintain | Neutral | 2025-11-26 |
| Rosenblatt | Maintain | Buy | 2025-11-24 |
Match Group, Inc. Grades
The table below summarizes recent grades from major financial firms for Match Group.
| Grading Company | Action | New Grade | Date |
|---|---|---|---|
| Morgan Stanley | Maintain | Equal Weight | 2026-01-13 |
| Evercore ISI Group | Maintain | In Line | 2025-11-05 |
| Wells Fargo | Maintain | Equal Weight | 2025-11-05 |
| Truist Securities | Maintain | Hold | 2025-11-05 |
| Morgan Stanley | Maintain | Equal Weight | 2025-10-20 |
| Susquehanna | Maintain | Positive | 2025-08-07 |
| Evercore ISI Group | Maintain | In Line | 2025-08-06 |
| JP Morgan | Maintain | Neutral | 2025-08-06 |
| UBS | Maintain | Neutral | 2025-07-23 |
| Wells Fargo | Maintain | Equal Weight | 2025-06-27 |
Which company has the best grades?
Autodesk consistently earns higher grades such as Overweight, Outperform, and Buy from multiple firms. Match Group’s grades mostly range from Hold to Equal Weight, indicating more cautious institutional sentiment. Investors may interpret Autodesk’s stronger grades as greater confidence in its growth prospects.
Risks specific to each company
The following categories identify critical pressure points and systemic threats facing Autodesk, Inc. and Match Group, Inc. in the 2026 market environment:
1. Market & Competition
Autodesk, Inc.
- Faces intense competition in software applications with pressure on innovation and pricing.
Match Group, Inc.
- Operates in a crowded dating app market with rapid technology shifts and changing user preferences.
2. Capital Structure & Debt
Autodesk, Inc.
- Moderate debt-to-assets at 23.62% with nearly 1:1 debt-to-equity; interest coverage is strong.
Match Group, Inc.
- Virtually no reported debt, but weak financial ratios and negative interest coverage raise concerns.
3. Stock Volatility
Autodesk, Inc.
- Beta of 1.453 indicates above-average market volatility; share price recently declined 5.8%.
Match Group, Inc.
- Beta of 1.315 shows notable volatility; stock dropped 8.4% recently, reflecting investor uncertainty.
4. Regulatory & Legal
Autodesk, Inc.
- Subject to evolving data privacy and intellectual property regulations impacting software licensing.
Match Group, Inc.
- Faces regulatory scrutiny on user data privacy and content moderation in multiple jurisdictions.
5. Supply Chain & Operations
Autodesk, Inc.
- Primarily software with cloud delivery reduces supply chain risks; operational scale supports stability.
Match Group, Inc.
- Relies on digital infrastructure; potential risks in platform uptime and cybersecurity threats.
6. ESG & Climate Transition
Autodesk, Inc.
- Growing focus on sustainable software solutions and corporate governance amid tech sector ESG trends.
Match Group, Inc.
- ESG risks linked to data ethics and social impact of dating platforms; climate transition less direct.
7. Geopolitical Exposure
Autodesk, Inc.
- Global customer base exposes it to trade tensions and regulatory variability worldwide.
Match Group, Inc.
- International operations subject to geopolitical risks, especially in data regulation and market access.
Which company shows a better risk-adjusted profile?
Autodesk’s key risk is its weak liquidity ratios, which may challenge short-term financial flexibility despite solid profitability. Match Group struggles with financial distress signals, notably a low Altman Z-Score indicating bankruptcy risk. Autodesk’s strong Altman Z-Score and operational scale give it a safer risk-adjusted profile. The steep recent stock decline for Match Group signals heightened market concern about its financial stability and competitive pressures.
Final Verdict: Which stock to choose?
Autodesk’s superpower lies in its robust and growing return on invested capital, signaling a durable competitive advantage and efficient capital use. Its main point of vigilance is the weak liquidity position, which could pressure short-term operations. This stock suits investors aiming for aggressive growth with a tolerance for balance sheet risks.
Match Group’s strategic moat is its entrenched market position in the online dating space, backed by steady recurring revenues. It offers a safer financial profile than Autodesk, with a stronger liquidity buffer but lacks clarity on capital efficiency. This makes it more appealing for Growth at a Reasonable Price (GARP) investors seeking stability amid moderate growth.
If you prioritize durable profitability and capital efficiency, Autodesk outshines due to its very favorable moat and strong returns despite liquidity concerns. However, if you seek better short-term financial stability with a resilient revenue base, Match Group offers better safety, though at the cost of less visible value creation. Each fits distinct investor profiles with differing risk appetites.
Disclaimer: Investment carries a risk of loss of initial capital. The past performance is not a reliable indicator of future results. Be sure to understand risks before making an investment decision.
Go Further
I encourage you to read the complete analyses of Autodesk, Inc. and Match Group, Inc. to enhance your investment decisions: