In the dynamic world of software applications, Intuit Inc. and Autodesk, Inc. stand out as pioneering forces shaping distinct yet overlapping markets. Intuit excels in financial management solutions for businesses and consumers, while Autodesk leads in 3D design and engineering software. Both companies emphasize innovation to maintain competitive edges. This article will explore their strengths and challenges to help you identify the most compelling investment opportunity.

Table of contents
Companies Overview
I will begin the comparison between Intuit and Autodesk by providing an overview of these two companies and their main differences.
Intuit Overview
Intuit Inc. focuses on financial management and compliance products for consumers, small businesses, and accounting professionals across the US, Canada, and internationally. It operates four segments including Small Business & Self-Employed, Consumer, Credit Karma, and ProConnect, offering solutions such as QuickBooks, TurboTax, and personal finance platforms. Founded in 1983, Intuit is headquartered in Mountain View, California, with a market cap of approximately 152B USD.
Autodesk Overview
Autodesk, Inc. specializes in 3D design, engineering, and entertainment software worldwide. Its portfolio includes AutoCAD, BIM 360, Fusion 360, and Maya, serving professionals in architecture, engineering, manufacturing, and media industries. Founded in 1982, Autodesk is based in San Rafael, California, and has a market cap near 56B USD. The company distributes its products through direct sales and reseller networks.
Key similarities and differences
Both Intuit and Autodesk operate in the application software industry, focusing on professional and business users. Intuit centers on financial and tax software with a broad consumer and small business base, while Autodesk provides specialized 3D design and engineering solutions primarily for professionals in construction, manufacturing, and media. Their business models differ in product scope and target markets, though both leverage cloud-based services and software subscriptions.
Income Statement Comparison
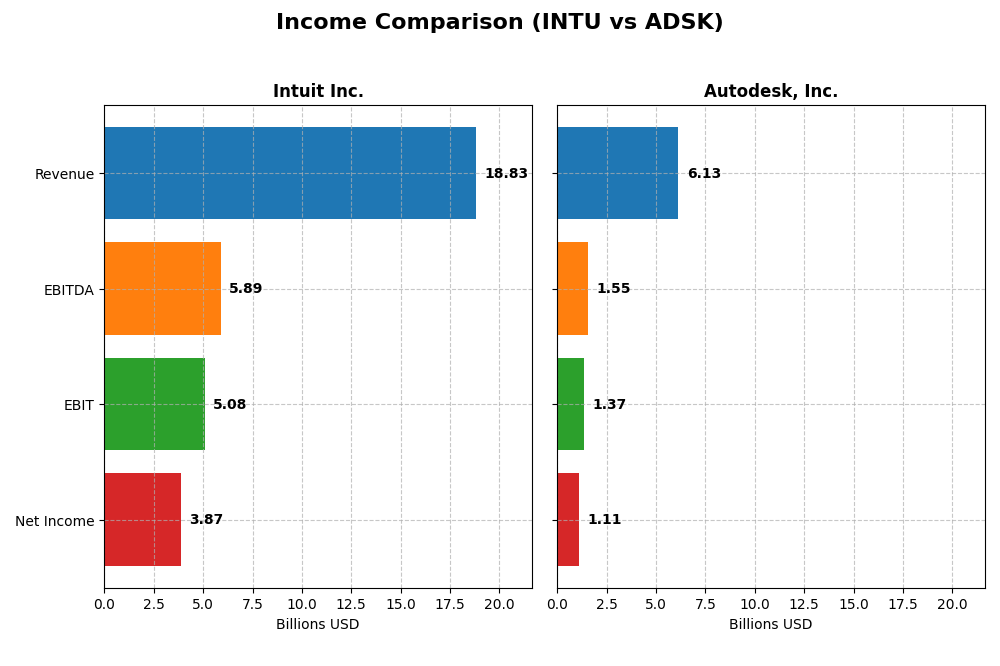
This table presents a side-by-side comparison of key income statement metrics for Intuit Inc. and Autodesk, Inc. for their most recent fiscal year, highlighting their financial performance.
| Metric | Intuit Inc. (INTU) | Autodesk, Inc. (ADSK) |
|---|---|---|
| Market Cap | 152B | 56.3B |
| Revenue | 18.8B | 6.13B |
| EBITDA | 5.89B | 1.55B |
| EBIT | 5.08B | 1.37B |
| Net Income | 3.87B | 1.11B |
| EPS | 13.82 | 5.17 |
| Fiscal Year | 2025 | 2025 |
Income Statement Interpretations
Intuit Inc.
Intuit’s revenue and net income showed strong growth from 2021 to 2025, with revenue nearly doubling to $18.8B and net income rising to $3.87B in 2025. Margins remained robust, with a gross margin of 80.76% and net margin at 20.55%. The 2025 fiscal year saw a 15.6% revenue increase and a 12.9% net margin improvement, indicating solid operational efficiency.
Autodesk, Inc.
Autodesk’s revenue increased steadily, reaching $6.13B in 2025 from $3.79B in 2021, while net income showed volatility, finishing at $1.11B in 2025. Gross margin was very strong at 90.57%, with a net margin of 18.14%. Despite a 12.7% revenue growth in 2025, net income declined over the overall period, reflecting margin contraction and EPS decrease.
Which one has the stronger fundamentals?
Intuit displays stronger fundamentals with higher sustained growth in revenue and net income, supported by favorable margin trends and consistent EPS gains. Autodesk, while maintaining excellent gross margins, shows less stable net income and declining margins over the period. Intuit’s superior margin stability and growth metrics suggest a more favorable income statement profile.
Financial Ratios Comparison
The table below presents a side-by-side comparison of key financial ratios for Intuit Inc. and Autodesk, Inc. for their most recent fiscal years, providing insight into profitability, liquidity, valuation, and leverage.
| Ratios | Intuit Inc. (2025) | Autodesk, Inc. (2025) |
|---|---|---|
| ROE | 19.6% | 42.4% |
| ROIC | 14.8% | 18.0% |
| P/E | 56.8 | 60.2 |
| P/B | 11.2 | 25.5 |
| Current Ratio | 1.36 | 0.68 |
| Quick Ratio | 1.36 | 0.68 |
| D/E (Debt-to-Equity) | 0.34 | 0.98 |
| Debt-to-Assets | 18.0% | 23.6% |
| Interest Coverage | 19.9 | 0 |
| Asset Turnover | 0.51 | 0.57 |
| Fixed Asset Turnover | 12.5 | 21.4 |
| Payout Ratio | 30.7% | 0 |
| Dividend Yield | 0.54% | 0 |
Interpretation of the Ratios
Intuit Inc.
Intuit’s financial ratios present a generally favorable picture with strong profitability, reflected in a 20.55% net margin and a 19.63% return on equity. Debt levels are well managed with a debt-to-equity of 0.34 and solid interest coverage. However, valuation multiples like a PE of 56.82 and PB of 11.15 are less attractive. The company pays dividends, but with a relatively low 0.54% yield, indicating modest shareholder returns.
Autodesk, Inc.
Autodesk shows favorable profitability ratios including an 18.14% net margin and an impressive 42.43% return on equity, though the weighted average cost of capital is unfavorable at 10.37%. Liquidity ratios are weak, with a current ratio of 0.68. Autodesk does not pay dividends, likely prioritizing reinvestment and growth, supported by moderate debt levels and sound interest coverage.
Which one has the best ratios?
Intuit holds a more favorable overall ratio profile, balancing profitability, liquidity, and debt management better than Autodesk. While Autodesk excelled in return on equity, its weaker liquidity and higher valuation multiples present concerns. Intuit’s consistent dividend payments add a layer of shareholder returns absent in Autodesk’s reinvestment approach, making Intuit’s ratios comparatively stronger.
Strategic Positioning
This section compares the strategic positioning of Intuit Inc. and Autodesk, Inc., focusing on market position, key segments, and exposure to technological disruption:
Intuit Inc.
- Leading in financial management software with significant market cap of 152B; faces moderate competitive pressure.
- Diverse revenue streams: Small Business & Self-Employed, Consumer, Credit Karma, and ProConnect segments driving growth.
- Exposure to cloud-based financial solutions and payment processing technologies, adapting to evolving fintech trends.
Autodesk, Inc.
- Strong presence in 3D design and engineering software; market cap at 56B; operates in competitive software application industry.
- Concentrated on Architecture, Engineering, Manufacturing, and Media segments with flagship AutoCAD and BIM 360 products.
- Focused on cloud-based construction management and 3D CAD tools, leveraging innovation in design and manufacturing software.
Intuit Inc. vs Autodesk, Inc. Positioning
Intuit adopts a diversified approach across financial management and consumer finance, offering multiple revenue streams, while Autodesk concentrates on specialized 3D design and engineering software. Intuit’s breadth may reduce segment risk, whereas Autodesk’s focus could drive deep expertise.
Which has the best competitive advantage?
Autodesk shows a very favorable moat with growing ROIC, indicating a durable competitive advantage and increasing profitability. Intuit also creates value but has a slightly favorable moat with declining ROIC, suggesting less stable profitability.
Stock Comparison
The stock price movements over the past 12 months reveal contrasting trends for Intuit Inc. and Autodesk, Inc., with Intuit showing a sustained decline while Autodesk experienced moderate gains followed by a recent pullback.

Trend Analysis
Intuit Inc. exhibited a bearish trend over the past year, with a price decline of -17.17% and decelerating downward momentum. Its price ranged from a high of 785.95 to a low of 546.5, supported by high volatility (51.48 std deviation).
Autodesk, Inc. posted a bullish trend over the same period, gaining 2.71% despite deceleration. The stock showed lower volatility (29.88 std deviation) and traded between 201.6 and 326.37. However, recent weeks reflect a short-term bearish correction.
Comparing both, Autodesk delivered the highest market performance with a positive overall return, while Intuit faced a significant downturn, marking divergent investor sentiment and market dynamics.
Target Prices
Analysts present a positive consensus on target prices for Intuit Inc. and Autodesk, Inc.
| Company | Target High | Target Low | Consensus |
|---|---|---|---|
| Intuit Inc. | 880 | 700 | 798.4 |
| Autodesk, Inc. | 400 | 343 | 373 |
The target consensus for Intuit suggests a strong upside potential from the current price of 546.44 USD, while Autodesk’s consensus target of 373 USD also indicates considerable growth above its current price of 264.16 USD.
Analyst Opinions Comparison
This section compares analysts’ ratings and grades for Intuit Inc. and Autodesk, Inc.:
Rating Comparison
Intuit Inc. Rating
- Rating: B, considered Very Favorable
- Discounted Cash Flow Score: 4, Favorable
- ROE Score: 4, Favorable
- ROA Score: 5, Very Favorable
- Debt To Equity Score: 2, Moderate
- Overall Score: 3, Moderate
Autodesk, Inc. Rating
- Rating: B-, considered Very Favorable
- Discounted Cash Flow Score: 3, Moderate
- ROE Score: 5, Very Favorable
- ROA Score: 4, Favorable
- Debt To Equity Score: 1, Very Unfavorable
- Overall Score: 3, Moderate
Which one is the best rated?
Based on the provided data, Intuit and Autodesk share the same overall score and very favorable rating status. Intuit scores higher on discounted cash flow and debt-to-equity metrics, while Autodesk excels in return on equity.
Scores Comparison
Here is a comparison of the financial health scores for Intuit Inc. and Autodesk, Inc.:
Intuit Inc. Scores
- Altman Z-Score: 9.35, indicating a safe zone.
- Piotroski Score: 9, categorized as very strong.
Autodesk, Inc. Scores
- Altman Z-Score: 5.05, indicating a safe zone.
- Piotroski Score: 8, categorized as very strong.
Which company has the best scores?
Intuit Inc. has higher Altman Z-Score and Piotroski Score values compared to Autodesk, Inc. Both are in the safe and very strong categories, but Intuit’s scores are superior based on the provided data.
Grades Comparison
Here is a comparison of the latest reliable grades from recognized financial institutions for Intuit Inc. and Autodesk, Inc.:
Intuit Inc. Grades
The table below summarizes recent grades assigned by reputable analysts for Intuit Inc.:
| Grading Company | Action | New Grade | Date |
|---|---|---|---|
| Wells Fargo | Downgrade | Equal Weight | 2026-01-08 |
| Wells Fargo | Maintain | Overweight | 2025-11-21 |
| RBC Capital | Maintain | Outperform | 2025-11-21 |
| BMO Capital | Maintain | Outperform | 2025-11-21 |
| Evercore ISI Group | Maintain | Outperform | 2025-11-18 |
| RBC Capital | Maintain | Outperform | 2025-09-02 |
| RBC Capital | Maintain | Outperform | 2025-08-22 |
| UBS | Maintain | Neutral | 2025-08-22 |
| Morgan Stanley | Maintain | Overweight | 2025-08-22 |
| Barclays | Maintain | Overweight | 2025-08-22 |
Intuit’s grades mostly reflect a strong buy sentiment with multiple “Outperform” and “Overweight” ratings, though Wells Fargo recently downgraded it to “Equal Weight.”
Autodesk, Inc. Grades
The table below summarizes recent grades assigned by reputable analysts for Autodesk, Inc.:
| Grading Company | Action | New Grade | Date |
|---|---|---|---|
| Barclays | Maintain | Overweight | 2025-11-26 |
| Wells Fargo | Maintain | Overweight | 2025-11-26 |
| Deutsche Bank | Upgrade | Buy | 2025-11-26 |
| B of A Securities | Maintain | Neutral | 2025-11-26 |
| Rosenblatt | Maintain | Buy | 2025-11-26 |
| Macquarie | Maintain | Outperform | 2025-11-26 |
| BMO Capital | Maintain | Market Perform | 2025-11-26 |
| Baird | Maintain | Outperform | 2025-11-26 |
| Rosenblatt | Maintain | Buy | 2025-11-24 |
| Baird | Maintain | Outperform | 2025-11-18 |
Autodesk’s grades indicate a generally positive outlook with multiple “Buy,” “Overweight,” and “Outperform” ratings, alongside some “Neutral” and “Market Perform” standings.
Which company has the best grades?
Both Intuit and Autodesk hold predominantly positive grades with consensus ratings of “Buy.” Autodesk has a slightly higher number of “Buy” ratings and recent upgrades, indicating a marginally stronger analyst enthusiasm that could influence investor confidence. Intuit’s strong presence of “Outperform” ratings signals solid performance expectations, though the recent downgrade by Wells Fargo suggests some caution.
Strengths and Weaknesses
Below is a comparison of key strengths and weaknesses for Intuit Inc. (INTU) and Autodesk, Inc. (ADSK) based on recent financial and operational data.
| Criterion | Intuit Inc. (INTU) | Autodesk, Inc. (ADSK) |
|---|---|---|
| Diversification | Broad revenue streams across Consumer, Business, Credit Karma, and Professional Tax segments provide resilience. | Strong focus on Architecture, Manufacturing, Media, and AutoCAD products, with less diversification but specialized markets. |
| Profitability | High net margin (20.55%) and ROIC (14.78%), though ROIC trend is declining. | Robust profitability with ROE at 42.43% and growing ROIC trend at 18.01%. |
| Innovation | Solid product suite with steady updates but slower ROIC growth suggests some challenges in maintaining innovation pace. | Demonstrates durable competitive advantage with increasing profitability, indicating strong innovation and market adaptation. |
| Global presence | Significant global business solutions segment, supporting international reach. | Global presence focused on engineering and design, expanding through key industry verticals. |
| Market Share | Large share in financial software with strong consumer and small business penetration. | Leading position in CAD and engineering software with dominance in architecture and manufacturing sectors. |
Key takeaways: Intuit offers a well-diversified portfolio with strong profitability but faces a declining ROIC trend indicating caution. Autodesk shows stronger innovation and profitability growth, though with less diversification and some liquidity concerns. Investors should weigh Intuit’s stability against Autodesk’s growth potential.
Risk Analysis
Below is a comparative table highlighting key risks for Intuit Inc. and Autodesk, Inc. based on the latest 2025 data:
| Metric | Intuit Inc. (INTU) | Autodesk, Inc. (ADSK) |
|---|---|---|
| Market Risk | Beta 1.25, moderate volatility | Beta 1.47, higher volatility |
| Debt Level | Low leverage, D/E 0.34 (favorable) | Moderate leverage, D/E 0.98 (neutral) |
| Regulatory Risk | Moderate, financial services regulations | Moderate, software compliance and export controls |
| Operational Risk | Medium, reliance on cloud and SaaS platforms | Medium, dependency on product innovation and subscription model |
| Environmental Risk | Low, limited direct impact | Low, limited direct impact |
| Geopolitical Risk | Moderate, exposure to US, Canada, and international markets | Moderate, global supply chain and market exposure |
Intuit’s risks are mitigated by low debt and strong financial health, but valuation remains stretched. Autodesk faces higher market volatility and leverage risk, with operational reliance on continuous innovation. Both operate in regulated environments with moderate geopolitical exposure.
Which Stock to Choose?
Intuit Inc. (INTU) shows strong income growth with a 95.48% revenue increase over 2021–2025 and favorable profitability metrics, including a 20.55% net margin and 19.63% ROE. Its debt levels are moderate with a favorable debt-to-equity of 0.34, supported by a very favorable B rating. Despite a declining ROIC trend, it remains above WACC, indicating value creation.
Autodesk, Inc. (ADSK) exhibits solid income growth but with a 7.95% net income decline over the overall period. Profitability is high with a 42.43% ROE and 18.14% net margin, though debt is higher with a less favorable debt-to-equity score of 0.98. Its B- rating reflects strengths in equity returns but challenges in valuation and liquidity. The company shows a very favorable and increasing ROIC trend.
For investors prioritizing stable income growth and consistent value creation, Intuit’s profile might appear more favorable, while those focused on high equity returns and a durable competitive advantage could find Autodesk’s improving profitability more appealing. Risk tolerance and investment strategy will likely influence which stock may better align with individual goals.
Disclaimer: Investment carries a risk of loss of initial capital. The past performance is not a reliable indicator of future results. Be sure to understand risks before making an investment decision.
Go Further
I encourage you to read the complete analyses of Intuit Inc. and Autodesk, Inc. to enhance your investment decisions: