In the fast-evolving world of software applications, Autodesk, Inc. (ADSK) and Figma, Inc. (FIG) stand out as pioneers driving innovation in design and collaboration tools. Autodesk, a long-established leader in 3D design and engineering software, competes with Figma, a younger company revolutionizing browser-based UI design through real-time collaboration. This comparison explores their market positions and strategies to help you, the investor, identify which company offers the most compelling growth potential.
Table of contents
Companies Overview
I will begin the comparison between Autodesk and Figma by providing an overview of these two companies and their main differences.
Autodesk Overview
Autodesk, Inc. is a leading provider of 3D design, engineering, and entertainment software globally. Its products serve professionals in architecture, engineering, construction, manufacturing, and media industries. Autodesk offers a range of software including AutoCAD, BIM 360, Fusion 360, and Maya, targeting complex design and production processes. Headquartered in San Rafael, California, Autodesk employs around 15,300 people and trades on NASDAQ with a market cap of $56.6B.
Figma Overview
Figma, Inc. develops a browser-based collaborative design tool focused on user interface and product design. Its offerings include Figma Design, Dev Mode, FigJam, and AI-powered Figma Make, enabling teams to prototype, inspect code, and align workflows. The company is based in San Francisco and has about 1,646 employees. Figma went public in 2025 on the NYSE and holds a market cap of $14.4B, emphasizing streamlined digital product development.
Key similarities and differences
Both Autodesk and Figma operate in the software application industry and focus on design solutions, but Autodesk’s suite covers 3D engineering and manufacturing extensively, while Figma specializes in UI/UX and collaborative digital design. Autodesk’s larger workforce and longer market presence contrast with Figma’s more recent IPO and smaller scale. Their business models differ mainly in product scope and target user base, with Autodesk serving multiple professional sectors and Figma concentrating on design teams.
Income Statement Comparison
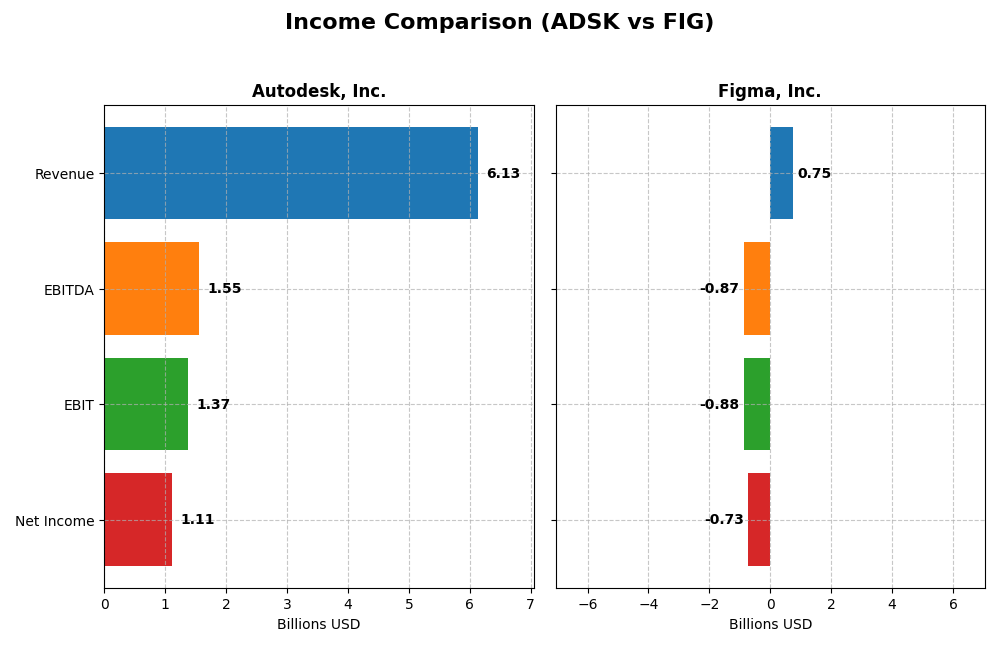
This table provides a side-by-side comparison of the most recent fiscal year income statement metrics for Autodesk, Inc. and Figma, Inc., highlighting scale and profitability differences.
| Metric | Autodesk, Inc. (ADSK) | Figma, Inc. (FIG) |
|---|---|---|
| Market Cap | 56.6B | 14.4B |
| Revenue | 6.13B | 749M |
| EBITDA | 1.55B | -870M |
| EBIT | 1.37B | -877M |
| Net Income | 1.11B | -732M |
| EPS | 5.17 | -3.11 |
| Fiscal Year | 2025 | 2024 |
Income Statement Interpretations
Autodesk, Inc.
Autodesk’s revenue steadily increased from 3.79B in 2021 to 6.13B in 2025, reflecting strong growth, though net income showed volatility, peaking at 1.21B in 2021 and dipping to 906M in 2024 before rebounding to 1.11B in 2025. Margins remained robust with a favorable gross margin above 90%. The latest year saw a 12.7% revenue rise and an 8.9% net margin improvement, signaling operational efficiency gains.
Figma, Inc.
Figma experienced rapid revenue growth from 505M in 2023 to 749M in 2024, a 48.4% increase. However, net income was negative both years, worsening from a 286M profit in 2023 to a loss of 732M in 2024. Despite a strong gross margin near 88%, EBIT and net margins were deeply negative, reflecting high operating expenses and declining profitability. The recent year showed deteriorating margins and EPS.
Which one has the stronger fundamentals?
Autodesk exhibits stronger fundamentals with consistent revenue growth, solid profitability, and favorable margin trends over five years. In contrast, Figma’s impressive top-line growth is offset by substantial net losses and unfavorable margin trajectories. Autodesk’s stable and positive earnings contrast with Figma’s volatility and negative income, indicating Autodesk’s more favorable income statement profile.
Financial Ratios Comparison
The table below presents a side-by-side comparison of key financial ratios for Autodesk, Inc. and Figma, Inc. based on their most recent fiscal year data, aiding in an objective evaluation of their financial health and performance.
| Ratios | Autodesk, Inc. (2025) | Figma, Inc. (2024) |
|---|---|---|
| ROE | 42.4% | -55.3% |
| ROIC | 18.0% | -59.7% |
| P/E | 60.2 | -70.7 |
| P/B | 25.5 | 39.1 |
| Current Ratio | 0.68 | 3.66 |
| Quick Ratio | 0.68 | 3.66 |
| D/E | 0.98 | 0.02 |
| Debt-to-Assets | 23.6% | 1.6% |
| Interest Coverage | 0 | 0 |
| Asset Turnover | 0.57 | 0.42 |
| Fixed Asset Turnover | 21.4 | 17.1 |
| Payout ratio | 0 | 0 |
| Dividend yield | 0 | 0 |
Interpretation of the Ratios
Autodesk, Inc.
Autodesk shows strong profitability with a net margin of 18.14% and an impressive ROE of 42.43%, supported by a solid ROIC of 18.01%. However, it faces concerns such as a high price-to-earnings ratio of 60.2 and low liquidity with a current ratio of 0.68. The company does not pay dividends, reflecting a likely reinvestment strategy to sustain growth.
Figma, Inc.
Figma’s financial ratios are weaker, showing a negative net margin of -97.74% and a negative ROE of -55.29%, indicating losses. Despite a low debt ratio (debt to assets at 1.6%) and a strong quick ratio of 3.66, the company does not pay dividends, consistent with its high growth phase and reinvestment in R&D. Some efficiency ratios and interest coverage remain unfavorable.
Which one has the best ratios?
Autodesk demonstrates more favorable profitability and return ratios, despite some concerns over valuation and liquidity. Figma’s ratios reflect its early-stage challenges with significant losses and negative returns, though it maintains low leverage and good liquidity. Overall, Autodesk’s ratios appear stronger, while Figma’s remain unfavorable.
Strategic Positioning
This section compares the strategic positioning of Autodesk, Inc. and Figma, Inc., focusing on market position, key segments, and exposure to technological disruption:
Autodesk, Inc.
- Leading in diverse software applications with strong market presence and moderate competitive pressure.
- Broad segments including Architecture, Engineering, Construction, Manufacturing, and Media & Entertainment.
- Leveraging cloud-based solutions with moderate risk from technological shifts in software development.
Figma, Inc.
- Emerging player focused on collaborative UI design tools facing high competitive volatility.
- Concentrated on browser-based UI design and collaboration tools for product development teams.
- Highly exposed to rapid innovation and disruption in collaborative design and AI-assisted prototyping.
Autodesk, Inc. vs Figma, Inc. Positioning
Autodesk pursues a diversified strategy across multiple industries, offering stable revenue streams, while Figma focuses on a specialized niche in collaborative UI design. Autodesk’s broad footprint provides resilience, whereas Figma’s concentrated approach entails higher volatility and innovation dependency.
Which has the best competitive advantage?
Autodesk exhibits a very favorable moat with growing ROIC above WACC, indicating durable competitive advantage and efficient capital use. Figma shows a very unfavorable moat with declining ROIC, reflecting value destruction and weak profitability sustainability.
Stock Comparison
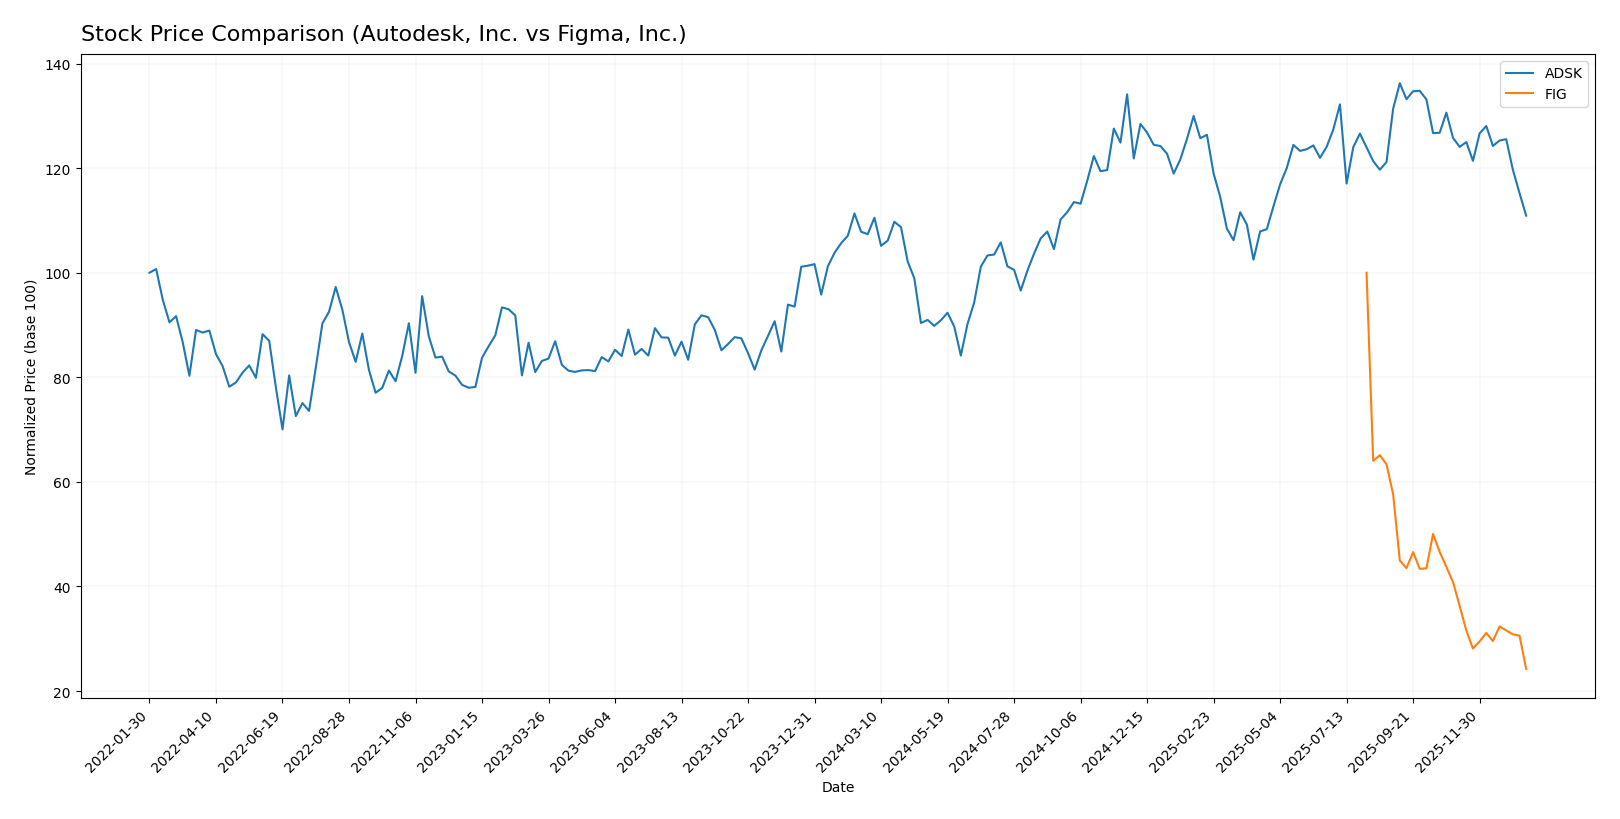
The stock prices of Autodesk, Inc. and Figma, Inc. have shown contrasting dynamics over the past 12 months, with Autodesk exhibiting a moderate bullish trend and Figma facing a pronounced bearish trajectory.
Trend Analysis
Autodesk, Inc. (ADSK) experienced a 3.3% price increase over the past year, indicating a bullish trend with deceleration. The stock ranged from a low of 201.6 to a high of 326.37, with notable volatility (std deviation 29.87).
Figma, Inc. (FIG) showed a significant bearish trend with a -75.76% price drop over the same period, accelerating downward. The stock fluctuated between 29.57 and 122.0, with volatility measured at 19.95 std deviation.
Comparing both, Autodesk delivered the highest market performance, maintaining a bullish stance, whereas Figma’s stock declined sharply, reflecting weaker market sentiment.
Target Prices
Analysts present a clear target price consensus for both Autodesk, Inc. and Figma, Inc.
| Company | Target High | Target Low | Consensus |
|---|---|---|---|
| Autodesk, Inc. | 400 | 343 | 373 |
| Figma, Inc. | 52 | 38 | 43.6 |
The consensus target prices for Autodesk and Figma indicate strong upside potential compared to their current prices of $265.69 and $29.57, respectively, reflecting optimistic analyst expectations.
Analyst Opinions Comparison
This section compares analysts’ ratings and grades for Autodesk, Inc. and Figma, Inc.:
Rating Comparison
ADSK Rating
- Rating: B- indicating a very favorable overall evaluation.
- Discounted Cash Flow Score: Moderate score of 3, showing balanced valuation.
- ROE Score: Very favorable high score of 5, reflecting strong profit generation.
- ROA Score: Favorable score of 4, showing effective asset utilization.
- Debt To Equity Score: Very unfavorable score of 1, implying high financial risk.
- Overall Score: Moderate score of 3, reflecting average financial standing.
FIG Rating
- Rating: C+ also indicating a very favorable overall evaluation.
- Discounted Cash Flow Score: Favorable score of 4, suggesting undervaluation.
- ROE Score: Very unfavorable low score of 1, indicating weak profit efficiency.
- ROA Score: Very unfavorable score of 1, indicating poor asset utilization.
- Debt To Equity Score: Favorable score of 4, indicating lower financial risk.
- Overall Score: Moderate score of 2, indicating slightly lower financial standing.
Which one is the best rated?
Autodesk holds a better overall rating (B-) compared to Figma’s C+, driven by stronger ROE and ROA scores despite Autodesk’s higher financial risk. Figma shows better valuation and debt metrics but lags in profitability measures.
Scores Comparison
Here is a comparison of the financial scores for Autodesk, Inc. and Figma, Inc.:
Autodesk, Inc. Scores
- Altman Z-Score: 5.05, indicating a safe zone with low bankruptcy risk.
- Piotroski Score: 8, classified as very strong financial health.
Figma, Inc. Scores
- Altman Z-Score: 14.34, indicating a safe zone with very low bankruptcy risk.
- Piotroski Score: 4, classified as average financial health.
Which company has the best scores?
Figma has a higher Altman Z-Score, indicating stronger bankruptcy safety, while Autodesk shows a much stronger Piotroski Score, reflecting better overall financial health. The best scores depend on which metric is prioritized.
Grades Comparison
Here is a summary of the most recent grades from reputable financial institutions for Autodesk, Inc. and Figma, Inc.:
Autodesk, Inc. Grades
This table lists recent grades and actions from major grading companies on Autodesk, Inc.:
| Grading Company | Action | New Grade | Date |
|---|---|---|---|
| Barclays | Maintain | Overweight | 2025-11-26 |
| Wells Fargo | Maintain | Overweight | 2025-11-26 |
| Deutsche Bank | Upgrade | Buy | 2025-11-26 |
| B of A Securities | Maintain | Neutral | 2025-11-26 |
| Rosenblatt | Maintain | Buy | 2025-11-26 |
| Macquarie | Maintain | Outperform | 2025-11-26 |
| BMO Capital | Maintain | Market Perform | 2025-11-26 |
| Baird | Maintain | Outperform | 2025-11-26 |
| Rosenblatt | Maintain | Buy | 2025-11-24 |
| Baird | Maintain | Outperform | 2025-11-18 |
Overall, Autodesk’s grades trend positively with multiple “Buy,” “Outperform,” and “Overweight” ratings, indicating a generally favorable outlook from analysts.
Figma, Inc. Grades
This table shows recent grades and their respective actions for Figma, Inc.:
| Grading Company | Action | New Grade | Date |
|---|---|---|---|
| Morgan Stanley | Maintain | Equal Weight | 2026-01-15 |
| Wells Fargo | Upgrade | Overweight | 2026-01-08 |
| RBC Capital | Maintain | Sector Perform | 2026-01-05 |
| Goldman Sachs | Maintain | Neutral | 2025-11-07 |
| JP Morgan | Maintain | Neutral | 2025-11-06 |
| Piper Sandler | Maintain | Overweight | 2025-11-06 |
| Wells Fargo | Maintain | Equal Weight | 2025-11-05 |
| Wells Fargo | Maintain | Equal Weight | 2025-09-04 |
| Morgan Stanley | Maintain | Equal Weight | 2025-09-04 |
| RBC Capital | Maintain | Sector Perform | 2025-09-04 |
Figma’s grades mostly cluster around “Equal Weight,” “Neutral,” and “Sector Perform,” with a recent upgrade from Wells Fargo to “Overweight,” reflecting a more cautious but slightly improving sentiment.
Which company has the best grades?
Autodesk, Inc. holds stronger grades overall, with a solid majority of “Buy” and “Outperform” ratings, compared to Figma, Inc.’s more moderate “Hold” and “Equal Weight” consensus. This disparity could influence investors’ perceptions of growth potential and risk profiles for each stock.
Strengths and Weaknesses
Below is a comparative overview of the strengths and weaknesses of Autodesk, Inc. (ADSK) and Figma, Inc. (FIG) based on their recent financial performance and strategic positioning.
| Criterion | Autodesk, Inc. (ADSK) | Figma, Inc. (FIG) |
|---|---|---|
| Diversification | Strong diversification across sectors: Architecture, Manufacturing, Media, etc. with $2.94B in Architecture segment revenue (2025). | Limited diversification; primarily focused on design collaboration software. |
| Profitability | High profitability with an 18.14% net margin and 42.43% ROE in 2025. | Negative profitability: -97.74% net margin and -55.29% ROE in 2024. |
| Innovation | Consistent investment and strong innovation in software solutions for multiple industries. | High innovation but struggling to convert into profitability. |
| Global presence | Established global footprint with diverse product lines and customer base. | Growing presence but limited compared to ADSK’s scale. |
| Market Share | Leading market share in CAD and design software markets. | Smaller market share, competing in niche collaborative design tools. |
Autodesk exhibits a durable competitive advantage with strong profitability and diversification, while Figma struggles with profitability and scale despite innovation. Caution is advised when considering Figma due to its current value destruction.
Risk Analysis
Below is a comparative table highlighting key risks for Autodesk, Inc. (ADSK) and Figma, Inc. (FIG) based on the most recent data available for 2025 and 2024 respectively:
| Metric | Autodesk, Inc. (ADSK) | Figma, Inc. (FIG) |
|---|---|---|
| Market Risk | Moderate (Beta 1.47) | High volatility (Beta -3.80) |
| Debt level | Moderate (Debt/Equity 0.98) | Very low (Debt/Equity 0.02) |
| Regulatory Risk | Moderate (US tech sector) | Moderate (US tech sector) |
| Operational Risk | Moderate (Large scale ops) | Higher (smaller, growth-stage) |
| Environmental Risk | Low (Software industry) | Low (Software industry) |
| Geopolitical Risk | Moderate (Global operations) | Moderate (Global operations) |
The most impactful and likely risks center on market volatility and operational execution. Autodesk faces moderate market risk with a beta above 1, indicating sensitivity to market cycles, while Figma shows extreme beta volatility, suggesting higher price swings and investor uncertainty. Autodesk’s moderate debt level contrasts with Figma’s minimal leverage, but Figma’s negative profitability metrics reflect operational challenges that could increase risk. Both operate in the US tech sector, exposing them to regulatory scrutiny and geopolitical factors influencing global supply chains and data privacy regulations.
Which Stock to Choose?
Autodesk, Inc. (ADSK) shows a favorable income evolution with 12.7% revenue growth in 2025, strong profitability metrics including an 18.14% net margin and 42.43% ROE, moderate debt levels, and a very favorable overall rating of B-. Its financial ratios present a balanced profile with strengths in return on invested capital and interest coverage, though some valuation ratios are less favorable.
Figma, Inc. (FIG) exhibits significant revenue growth of 48.36% in 2024 but suffers from negative profitability indicators such as a -97.74% net margin and -55.29% ROE. The company maintains low debt levels and a very favorable rating of C+, but overall its financial ratios and income statements are unfavorable, with a declining ROIC trend signaling value destruction.
Considering the ratings and comprehensive evaluation of income statements and financial ratios, Autodesk might appear more suitable for investors prioritizing quality and profitability, while Figma could be interpreted as aligning with risk-tolerant profiles focused on high growth despite current financial challenges.
Disclaimer: Investment carries a risk of loss of initial capital. The past performance is not a reliable indicator of future results. Be sure to understand risks before making an investment decision.
Go Further
I encourage you to read the complete analyses of Autodesk, Inc. and Figma, Inc. to enhance your investment decisions: