In today’s dynamic tech landscape, Autodesk, Inc. and Elastic N.V. stand out as innovative leaders within the software application industry. Autodesk specializes in 3D design and engineering software, while Elastic focuses on advanced data search and analytics solutions. Both companies drive digital transformation but serve distinct market needs, making their comparison valuable. In this article, I will help you identify which company offers the most compelling investment opportunity for your portfolio.

Table of contents
Companies Overview
I will begin the comparison between Autodesk and Elastic by providing an overview of these two companies and their main differences.
Autodesk Overview
Autodesk, Inc. focuses on providing 3D design, engineering, and entertainment software and services worldwide. The company offers a broad portfolio including AutoCAD, BIM 360, and Fusion 360, targeting professionals in architecture, engineering, construction, manufacturing, and media industries. Established in 1982 and headquartered in San Rafael, California, Autodesk holds a strong market position with a market cap of approximately 56.6B USD and employs about 15,300 full-time staff.
Elastic Overview
Elastic N.V. specializes in search technology designed for multi-cloud environments, offering the Elastic Stack suite that includes Elasticsearch, Kibana, Beats, and Logstash. These tools support data ingestion, search, analysis, and visualization for various data types. Founded in 2012 and based in Mountain View, California, Elastic serves a growing market with a market cap near 7.5B USD and about 3,400 employees, emphasizing cloud-native search solutions.
Key similarities and differences
Both Autodesk and Elastic operate in the technology sector with a focus on software applications, but their core offerings differ significantly. Autodesk concentrates on design and engineering software across various industries, while Elastic provides search and data analytics platforms primarily for cloud-based environments. Autodesk’s larger scale and broader industry reach contrast with Elastic’s specialized focus on search technology and data management. Both companies are publicly traded and actively invest in cloud capabilities.
Income Statement Comparison
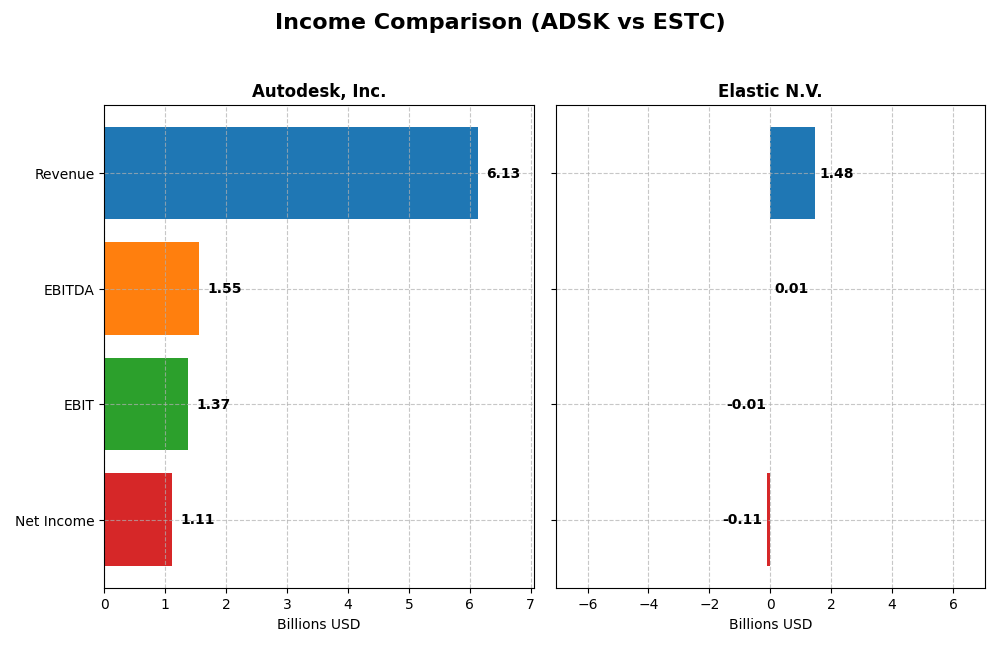
The table below presents a side-by-side comparison of key income statement metrics for Autodesk, Inc. and Elastic N.V. based on their most recent fiscal year data.
| Metric | Autodesk, Inc. (ADSK) | Elastic N.V. (ESTC) |
|---|---|---|
| Market Cap | 56.6B | 7.5B |
| Revenue | 6.13B | 1.48B |
| EBITDA | 1.55B | 6.1M |
| EBIT | 1.37B | -6.3M |
| Net Income | 1.11B | -108M |
| EPS | 5.17 | -1.04 |
| Fiscal Year | 2025 | 2025 |
Income Statement Interpretations
Autodesk, Inc.
Autodesk’s revenue rose steadily from $3.79B in 2021 to $6.13B in 2025, with net income growing to $1.11B in 2025 after fluctuations. Margins remain strong, with a gross margin above 90% and net margin around 18%. In 2025, revenue growth accelerated to 12.7%, while net margin improved, highlighting operational efficiency gains.
Elastic N.V.
Elastic’s revenue increased significantly from $608M in 2021 to $1.48B in 2025, with net income recovering to a loss of $108M in 2025 after prior volatility. Gross margin stayed favorable near 74%, but net margin remained negative at -7.29%. The latest year showed strong revenue growth of 17%, yet net margin and EPS deteriorated, reflecting ongoing profitability challenges.
Which one has the stronger fundamentals?
Autodesk demonstrates stronger fundamentals with consistent revenue growth, high and stable gross and net margins, and positive net income despite slight overall net income decline over five years. Elastic shows impressive top-line expansion but struggles with profitability, negative net margins, and earnings volatility, which temper its fundamental strength compared to Autodesk.
Financial Ratios Comparison
The table below presents the most recent key financial ratios for Autodesk, Inc. and Elastic N.V., providing a side-by-side view for comparison as of their latest fiscal years.
| Ratios | Autodesk, Inc. (2025 FY) | Elastic N.V. (2025 FY) |
|---|---|---|
| ROE | 42.4% | -11.7% |
| ROIC | 18.0% | -3.4% |
| P/E | 60.2 | -82.7 |
| P/B | 25.5 | 9.6 |
| Current Ratio | 0.68 | 1.92 |
| Quick Ratio | 0.68 | 1.92 |
| D/E (Debt-to-Equity) | 0.98 | 0.64 |
| Debt-to-Assets | 23.6% | 22.9% |
| Interest Coverage | 0 (not available) | -2.17 |
| Asset Turnover | 0.57 | 0.57 |
| Fixed Asset Turnover | 21.4 | 51.3 |
| Payout Ratio | 0 | 0 |
| Dividend Yield | 0 | 0 |
Interpretation of the Ratios
Autodesk, Inc.
Autodesk shows strong profitability with favorable net margin (18.14%), ROE (42.43%), and ROIC (18.01%), though valuation ratios like PE (60.2) and PB (25.54) appear stretched. Liquidity ratios are weak, with a current ratio of 0.68, indicating potential short-term cash concerns. The company does not pay dividends, likely focusing on reinvestment and growth.
Elastic N.V.
Elastic reports unfavorable profitability metrics, including negative net margin (-7.29%), ROE (-11.66%), and ROIC (-3.45%). Liquidity ratios are strong, with a current ratio of 1.92, suggesting adequate short-term financial health. Elastic also does not pay dividends, reflecting its ongoing investment in R&D and growth, consistent with its negative earnings profile.
Which one has the best ratios?
Both Autodesk and Elastic present a mixed ratio profile, each with 42.86% favorable and unfavorable ratios, resulting in a neutral overall assessment. Autodesk excels in profitability but struggles with valuation and liquidity. Elastic shows better liquidity but suffers from negative profitability. Neither company currently offers dividend returns to shareholders.
Strategic Positioning
This section compares the strategic positioning of Autodesk, Inc. and Elastic N.V., focusing on Market position, Key segments, and Exposure to technological disruption:
Autodesk, Inc.
- Leading software application firm with strong competitive presence in multiple industries.
- Diverse segments: architecture, engineering, construction, manufacturing, media, and entertainment.
- Moderate exposure through cloud-based services and evolving software tools across industries.
Elastic N.V.
- Smaller market cap with competitive pressure in cloud-based search and analytics software.
- Concentrated on Elastic Stack platform and subscription services in search and data analytics.
- High exposure via cloud-native, multi-cloud search technology with continuous innovation.
Autodesk, Inc. vs Elastic N.V. Positioning
Autodesk shows a diversified business model across several professional sectors, offering broad revenue streams, while Elastic focuses on a concentrated product portfolio centered on Elastic Stack and subscription services. Autodesk benefits from sector diversity; Elastic leverages specialized cloud technology.
Which has the best competitive advantage?
Autodesk holds a very favorable moat with growing ROIC above WACC, indicating durable competitive advantage and value creation. Elastic’s moat is slightly unfavorable due to ROIC below WACC, but improving profitability suggests potential future gains.
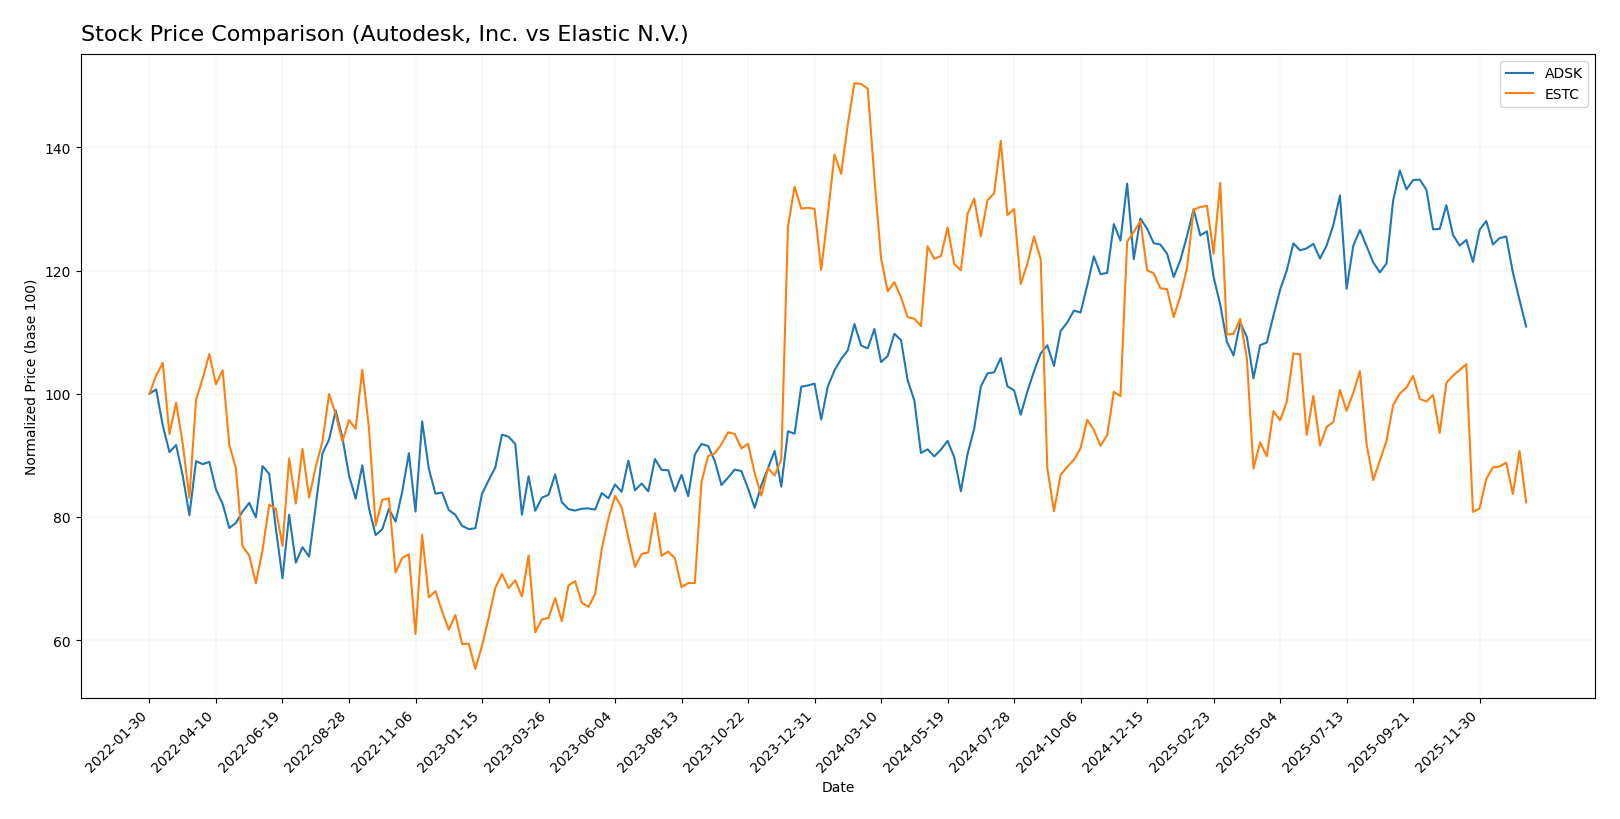
Stock Comparison
The past year’s stock prices reveal Autodesk, Inc. (ADSK) exhibiting a moderate bullish trend with decelerating momentum, while Elastic N.V. (ESTC) faces a pronounced bearish trend marked by significant price declines.
Trend Analysis
Autodesk, Inc. (ADSK) experienced a 3.3% price increase over the past 12 months, indicating a bullish trend with decelerating acceleration and a high volatility level (std deviation 29.87). Recent months show a reversal to an 11.83% decline.
Elastic N.V. (ESTC) recorded a 44.93% price drop during the same period, confirming a bearish trend with deceleration and moderate volatility (std deviation 14.08). Recent losses accelerated with a 20.0% decline.
Comparing both, ADSK delivered the highest market performance over the past year, maintaining a positive overall trend despite recent setbacks, unlike ESTC’s sustained bearish trajectory.
Target Prices
The current analyst consensus for target prices indicates a positive outlook for both Autodesk, Inc. and Elastic N.V.
| Company | Target High | Target Low | Consensus |
|---|---|---|---|
| Autodesk, Inc. | 400 | 343 | 373 |
| Elastic N.V. | 134 | 76 | 108 |
Analysts expect Autodesk’s stock price to rise significantly from its current 265.69 USD, while Elastic’s consensus target of 108 USD suggests potential upside from its current 71.38 USD price.
Analyst Opinions Comparison
This section compares analysts’ ratings and grades for Autodesk, Inc. and Elastic N.V.:
Rating Comparison
Autodesk, Inc. Rating
- Rating: B- indicating a very favorable overall status
- Discounted Cash Flow Score: Moderate at 3
- ROE Score: Very favorable at 5
- ROA Score: Favorable at 4
- Debt To Equity Score: Very unfavorable at 1
- Overall Score: Moderate at 3
Elastic N.V. Rating
- Rating: C- with a very favorable overall status
- Discounted Cash Flow Score: Moderate at 3
- ROE Score: Very unfavorable at 1
- ROA Score: Very unfavorable at 1
- Debt To Equity Score: Very unfavorable at 1
- Overall Score: Very unfavorable at 1
Which one is the best rated?
Based strictly on the data, Autodesk, Inc. is better rated with a B- rating and stronger scores in ROE, ROA, and overall assessment. Elastic N.V. has a lower C- rating and weaker financial scores overall.
Scores Comparison
Here is the comparison of the financial health scores for Autodesk, Inc. and Elastic N.V.:
Autodesk, Inc. Scores
- Altman Z-Score: 5.05, indicating a safe zone, low bankruptcy risk.
- Piotroski Score: 8, very strong financial strength.
Elastic N.V. Scores
- Altman Z-Score: 3.51, indicating a safe zone, moderate bankruptcy risk.
- Piotroski Score: 4, average financial strength.
Which company has the best scores?
Autodesk, Inc. shows stronger financial health with a higher Altman Z-Score and a much better Piotroski Score compared to Elastic N.V., which holds a safe but lower Altman Z-Score and average Piotroski Score.
Grades Comparison
Here is a comparison of the latest available grades from reputable financial institutions for both companies:
Autodesk, Inc. Grades
The table below summarizes the recent analyst grades for Autodesk, Inc.:
| Grading Company | Action | New Grade | Date |
|---|---|---|---|
| Barclays | Maintain | Overweight | 2025-11-26 |
| Wells Fargo | Maintain | Overweight | 2025-11-26 |
| Deutsche Bank | Upgrade | Buy | 2025-11-26 |
| B of A Securities | Maintain | Neutral | 2025-11-26 |
| Rosenblatt | Maintain | Buy | 2025-11-26 |
| Macquarie | Maintain | Outperform | 2025-11-26 |
| BMO Capital | Maintain | Market Perform | 2025-11-26 |
| Baird | Maintain | Outperform | 2025-11-26 |
| Rosenblatt | Maintain | Buy | 2025-11-24 |
| Baird | Maintain | Outperform | 2025-11-18 |
Autodesk, Inc. shows consistently positive analyst grades, with many maintaining Buy, Outperform, or Overweight ratings as of late 2025.
Elastic N.V. Grades
The table below presents the recent analyst grades for Elastic N.V.:
| Grading Company | Action | New Grade | Date |
|---|---|---|---|
| Barclays | Maintain | Overweight | 2026-01-12 |
| RBC Capital | Maintain | Outperform | 2026-01-05 |
| Jefferies | Maintain | Buy | 2026-01-05 |
| Citigroup | Maintain | Buy | 2025-11-24 |
| Wedbush | Maintain | Outperform | 2025-11-21 |
| B of A Securities | Maintain | Neutral | 2025-11-21 |
| Guggenheim | Maintain | Buy | 2025-11-21 |
| Wells Fargo | Maintain | Equal Weight | 2025-11-21 |
| RBC Capital | Maintain | Outperform | 2025-11-21 |
| Canaccord Genuity | Maintain | Buy | 2025-11-21 |
Elastic N.V. also exhibits predominantly positive grades, with a strong presence of Buy and Outperform ratings across several notable firms.
Which company has the best grades?
Both Autodesk, Inc. and Elastic N.V. have received predominantly positive grades with consensus ratings of “Buy.” Autodesk has more Overweight and Outperform ratings, while Elastic shows consistent Buy and Outperform grades. Investors might interpret these strong grades as indicative of confidence from analysts, potentially reflecting favorable growth or value prospects for both companies.
Strengths and Weaknesses
Below is a summary table comparing key strengths and weaknesses of Autodesk, Inc. (ADSK) and Elastic N.V. (ESTC) based on recent financial and strategic data.
| Criterion | Autodesk, Inc. (ADSK) | Elastic N.V. (ESTC) |
|---|---|---|
| Diversification | Highly diversified across Architecture, Engineering, Manufacturing, Media, and AutoCAD segments with large revenue streams (e.g., $2.9B in Architecture). | Less diversified, primarily focused on Subscription services ($1.38B) and Professional Services ($98.8M). |
| Profitability | Strong profitability with net margin 18.14%, ROIC 18.01%, and ROE 42.43%. | Negative profitability: net margin -7.29%, ROIC -3.45%, and ROE -11.66%. |
| Innovation | Demonstrates durable competitive advantage with growing ROIC (+15.4%) and value creation (ROIC > WACC by 7.6%). | Innovation improving as indicated by rapid ROIC growth (+85.8%), but still destroying value (ROIC < WACC by -11.3%). |
| Global presence | Extensive global presence supported by large market share in multiple sectors and strong fixed asset turnover (21.44). | Growing presence with high fixed asset turnover (51.28), but smaller scale and less market penetration. |
| Market Share | Strong market position in CAD and AEC software markets, supported by sustained revenue growth. | Smaller market share, focused in niche areas of cloud search and data analytics subscription services. |
Key takeaways: Autodesk is a mature, diversified company with strong profitability and a durable competitive moat, making it a relatively safer investment. Elastic shows promising growth and innovation but remains unprofitable and riskier due to its value-destroying status. Investors should weigh stability against growth potential carefully.
Risk Analysis
Below is a risk comparison table for Autodesk, Inc. (ADSK) and Elastic N.V. (ESTC) based on the most recent data from 2025.
| Metric | Autodesk, Inc. (ADSK) | Elastic N.V. (ESTC) |
|---|---|---|
| Market Risk | Beta 1.47, relatively volatile | Beta 0.93, less volatile |
| Debt level | Debt-to-Equity 0.98 (neutral) | Debt-to-Equity 0.64 (neutral) |
| Regulatory Risk | Moderate, US tech sector exposure | Moderate, US and multi-cloud markets exposure |
| Operational Risk | Moderate, complex software ecosystem | Moderate, dependency on cloud infrastructure |
| Environmental Risk | Moderate, some exposure via project-based clients | Low, primarily software-based with low environmental footprint |
| Geopolitical Risk | Moderate, US-based with global clients | Moderate, global cloud presence with US base |
The most impactful risks are market volatility for Autodesk due to its higher beta and operational risks tied to software complexity. Elastic faces profitability challenges with negative margins and moderate geopolitical exposure from its cloud infrastructure. Both show manageable debt levels, but Autodesk’s valuation metrics suggest caution.
Which Stock to Choose?
Autodesk, Inc. (ADSK) shows a favorable income evolution with 12.7% revenue growth in 2025 and strong profitability metrics including an 18.14% net margin and 42.43% ROE. Its debt levels are moderate with a net debt to EBITDA near 0.62 and the company holds a very favorable B- rating overall.
Elastic N.V. (ESTC) displays a higher revenue growth rate of 17.04% in 2025 but suffers from negative profitability, with a -7.29% net margin and -11.66% ROE. It maintains a healthier current ratio above 1.9 and holds a very favorable C- rating despite unfavorable returns and elevated debt risks.
For investors prioritizing durable competitive advantages and consistent profitability, Autodesk’s very favorable moat and stable income statement might appear more attractive. Conversely, growth-focused or risk-tolerant investors may find Elastic’s improving income trends and lower valuation metrics as potential for future value creation.
Disclaimer: Investment carries a risk of loss of initial capital. The past performance is not a reliable indicator of future results. Be sure to understand risks before making an investment decision.
Go Further
I encourage you to read the complete analyses of Autodesk, Inc. and Elastic N.V. to enhance your investment decisions: