In the fast-evolving software industry, Autodesk, Inc. and Domo, Inc. stand out as innovators with distinct yet overlapping market focuses. Autodesk leads in 3D design and engineering software, while Domo specializes in cloud-based business intelligence platforms. Both companies leverage cutting-edge technology to transform how businesses operate. This article will analyze their strengths and risks to help you decide which company presents the most compelling investment opportunity in 2026.
Table of contents
Companies Overview
I will begin the comparison between Autodesk and Domo by providing an overview of these two companies and their main differences.
Autodesk Overview
Autodesk, Inc. is a leading provider of 3D design, engineering, and entertainment software worldwide. The company offers a broad portfolio of applications such as AutoCAD, BIM 360, and Fusion 360, catering to professionals in architecture, engineering, construction, manufacturing, and media industries. Headquartered in San Rafael, California, Autodesk leverages its extensive product suite to maintain a strong market position in software applications for design and manufacturing.
Domo Overview
Domo, Inc. operates a cloud-based business intelligence platform that connects all levels of an organization to real-time data and insights via smartphones. Founded in 2010 and based in American Fork, Utah, the company serves customers internationally, focusing on enhancing business management through data accessibility. Domo’s platform aims to streamline decision-making processes by digitally integrating people, data, and systems across enterprises.
Key similarities and differences
Both Autodesk and Domo operate within the technology sector focusing on software applications, but their business models differ. Autodesk specializes in design and engineering software products tailored to professional industries, while Domo provides a cloud-based business intelligence platform aimed at data connectivity and real-time insights. Autodesk is a more established company with a significantly larger market capitalization and workforce compared to Domo, which is smaller and focuses on data-driven business management solutions.
Income Statement Comparison
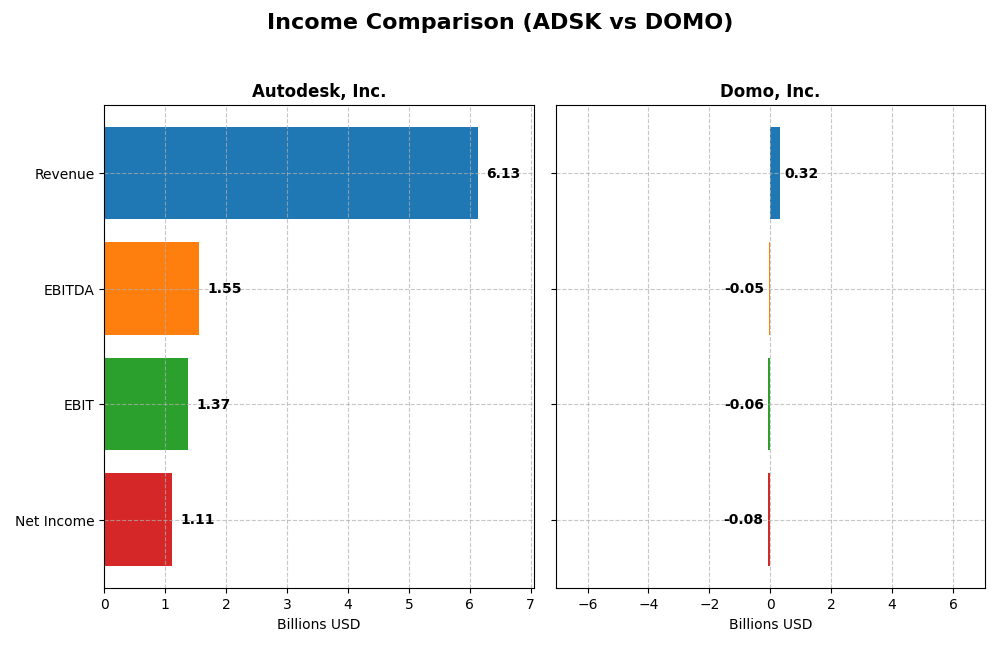
The table below compares key income statement metrics for Autodesk, Inc. and Domo, Inc. for the fiscal year 2025, illustrating their financial performance and profitability.
| Metric | Autodesk, Inc. (ADSK) | Domo, Inc. (DOMO) |
|---|---|---|
| Market Cap | 56.6B | 257M |
| Revenue | 6.13B | 317M |
| EBITDA | 1.55B | -50M |
| EBIT | 1.37B | -59M |
| Net Income | 1.11B | -82M |
| EPS | 5.17 | -2.13 |
| Fiscal Year | 2025 | 2025 |
Income Statement Interpretations
Autodesk, Inc.
Autodesk’s revenue grew steadily from $3.79B in 2021 to $6.13B in 2025, marking a 61.7% increase over five years. Net income showed volatility, peaking at $1.21B in 2021 but declining overall by 7.95%. Margins remain strong, with a gross margin of 90.57% and a net margin of 18.14% in 2025. The latest year saw a solid 12.7% revenue growth and an 8.9% improvement in net margin, reflecting healthy operational leverage.
Domo, Inc.
Domo’s revenue expanded from $210M in 2021 to $317M in 2025, a 50.8% increase, but net income remained negative throughout, with a loss of $82M in 2025. The gross margin held favorably at 74.45%, yet EBIT and net margins were deeply negative at -18.7% and -25.8%, respectively. Recent performance showed a slight revenue decline of 0.6% and worsening net margin by 9.1%, indicating persistent profitability challenges.
Which one has the stronger fundamentals?
Autodesk demonstrates stronger fundamentals with consistent revenue growth, positive net income, and robust margins, including a favorable EBIT margin of 22.3%. In contrast, Domo struggles with ongoing net losses and negative EBIT margins, despite revenue growth. Autodesk’s financial metrics suggest better operational efficiency and profitability compared to Domo’s continued unprofitability and margin weaknesses.
Financial Ratios Comparison
The table below presents a side-by-side comparison of key financial ratios for Autodesk, Inc. and Domo, Inc. based on their most recent fiscal year data as of 2025.
| Ratios | Autodesk, Inc. (ADSK) | Domo, Inc. (DOMO) |
|---|---|---|
| ROE | 42.4% | 46.2% |
| ROIC | 18.0% | 194.7% |
| P/E | 60.2 | -3.98 |
| P/B | 25.5 | -1.84 |
| Current Ratio | 0.68 | 0.56 |
| Quick Ratio | 0.68 | 0.56 |
| D/E | 0.98 | -0.76 |
| Debt-to-Assets | 23.6% | 63.2% |
| Interest Coverage | 0 | -2.99 |
| Asset Turnover | 0.57 | 1.48 |
| Fixed Asset Turnover | 21.4 | 8.17 |
| Payout Ratio | 0 | 0 |
| Dividend Yield | 0 | 0 |
Interpretation of the Ratios
Autodesk, Inc.
Autodesk demonstrates several strong financial ratios, including a favorable net margin of 18.14% and impressive returns on equity (42.43%) and invested capital (18.01%). However, its valuation metrics like PE (60.2) and PB (25.54) ratios are unfavorable, alongside a weak liquidity position with a current ratio of 0.68. The company does not pay dividends, reflecting a focus on reinvestment and growth.
Domo, Inc.
Domo’s ratios present a mixed picture with negative net margin (-25.84%) and high debt to assets (63.23%), signaling profitability and leverage concerns. In contrast, its returns on equity (46.23%) and invested capital (194.73%) are favorable, though valuation metrics such as a negative PE ratio imply caution. Domo does not pay dividends, consistent with a high-growth strategy emphasizing reinvestment.
Which one has the best ratios?
Both Autodesk and Domo have balanced favorable and unfavorable ratios, leading to a neutral overall assessment. Autodesk shows strength in profitability and capital returns but is hindered by valuation and liquidity issues. Domo displays high returns but suffers from losses and leverage, resulting in no clear superiority in their financial metrics.
Strategic Positioning
This section compares the strategic positioning of Autodesk, Inc. and Domo, Inc., including their market position, key segments, and exposure to technological disruption:
Autodesk, Inc.
- Large market cap of $56.6B with established NASDAQ presence; faces competitive pressure in software applications.
- Diversified revenue streams: Architecture, Engineering, Construction, AutoCAD products, Manufacturing, Media, and Entertainment.
- Engages in cloud-based construction and design software; faces ongoing digital transformation but no explicit disruption details.
Domo, Inc.
- Smaller market cap of $257M; operates on NASDAQ Global Market with higher beta, indicating higher volatility.
- Concentrated revenue mainly from Subscription services and Professional Services within business intelligence.
- Cloud-based BI platform focusing on real-time data access; potential exposure to rapid tech changes in data analytics.
Autodesk, Inc. vs Domo, Inc. Positioning
Autodesk displays a diversified business model serving multiple industries, providing stability through varied revenue sources. Domo concentrates on cloud BI subscriptions, enabling focused innovation but with less revenue diversification and higher operational risk.
Which has the best competitive advantage?
Both companies show a very favorable moat with growing ROIC above WACC, indicating durable competitive advantages. However, Domo’s exceptionally high ROIC growth suggests a stronger current value creation despite its smaller scale.
Stock Comparison
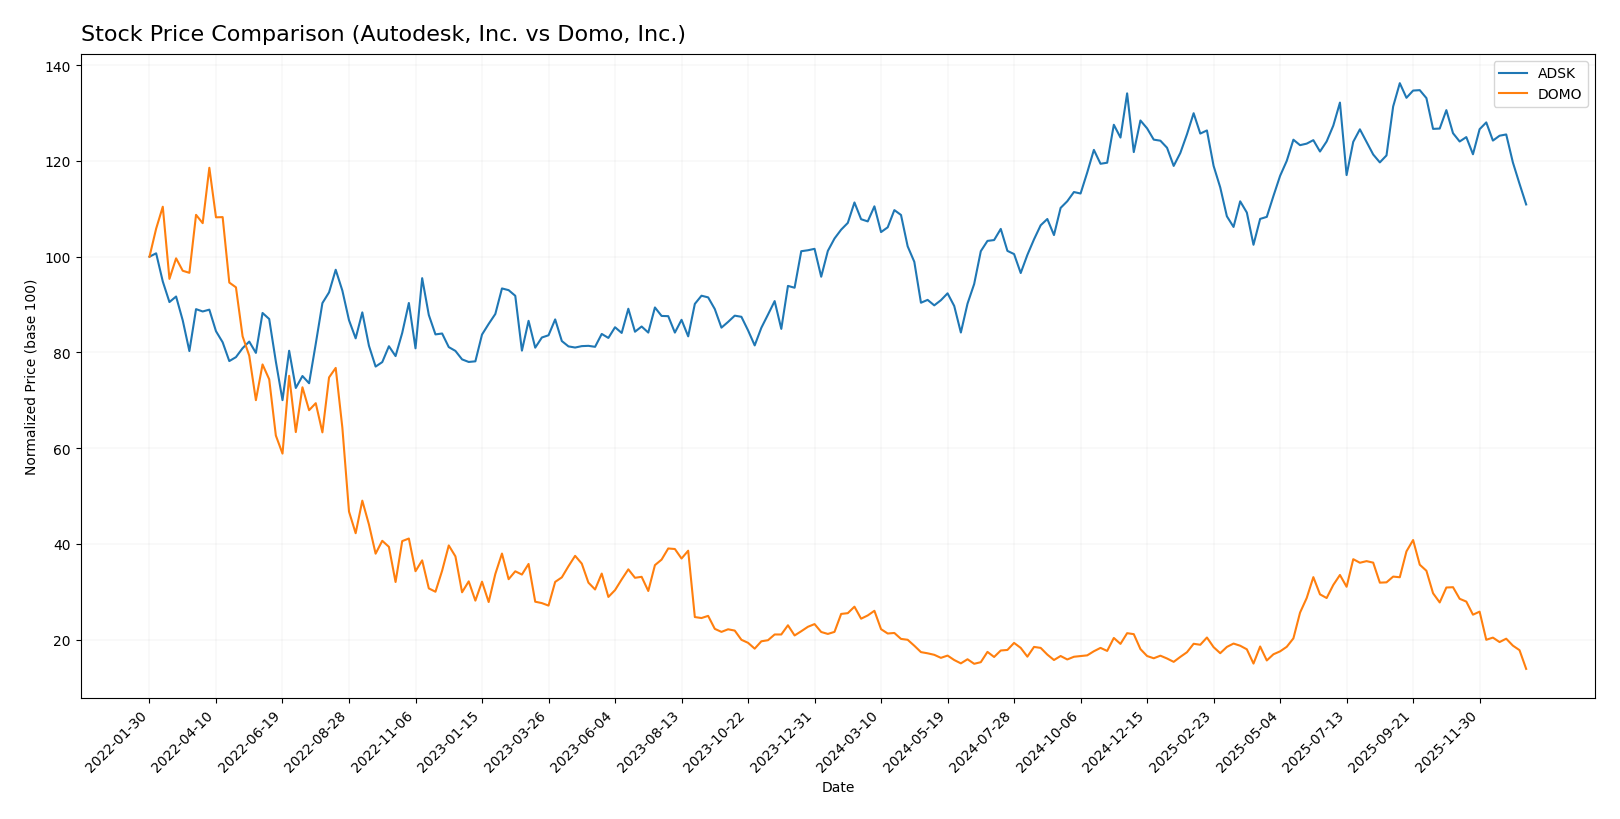
The stock price movements of Autodesk, Inc. (ADSK) and Domo, Inc. (DOMO) over the past 12 months reveal contrasting trading dynamics, with ADSK showing a mild bullish trend decelerating recently, while DOMO experiences a sustained bearish trend with sharper declines.
Trend Analysis
Autodesk, Inc. (ADSK) recorded a 3.3% price increase over the past year, indicating a bullish trend with deceleration. The stock peaked at 326.37 and found support at 201.6, showing moderate volatility (std. dev. 29.87). Recent months reflect a short-term decline of -11.83%.
Domo, Inc. (DOMO) faced a -44.54% price drop over the past year, confirming a bearish trend with deceleration. Its price fluctuated between 6.15 and 18.06, with low volatility (std. dev. 3.01). The recent period shows an accelerated decline of -55.11%.
Comparing both stocks, Autodesk delivered the highest market performance with a positive price change, while Domo experienced significant losses and a stronger downward momentum over the same period.
Target Prices
Analysts present a clear target price consensus for Autodesk, Inc. and Domo, Inc.
| Company | Target High | Target Low | Consensus |
|---|---|---|---|
| Autodesk, Inc. | 400 | 343 | 373 |
| Domo, Inc. | 13 | 10 | 11.5 |
The consensus target prices for Autodesk and Domo suggest potential upside from current prices of $265.69 and $6.15 respectively, indicating overall positive analyst expectations.
Analyst Opinions Comparison
This section compares analysts’ ratings and grades for Autodesk, Inc. and Domo, Inc.:
Rating Comparison
Autodesk, Inc. Rating
- Rating: B-, considered Very Favorable by analysts.
- Discounted Cash Flow Score: Moderate at 3 out of 5.
- ROE Score: Very Favorable, highest score of 5 out of 5.
- ROA Score: Favorable at 4 out of 5.
- Debt To Equity Score: Very Unfavorable at 1 out of 5.
- Overall Score: Moderate at 3 out of 5.
Domo, Inc. Rating
- Rating: C, also considered Very Favorable by analysts.
- Discounted Cash Flow Score: Very Unfavorable at 1 out of 5.
- ROE Score: Very Favorable, also 5 out of 5.
- ROA Score: Very Unfavorable at 1 out of 5.
- Debt To Equity Score: Very Unfavorable at 1 out of 5.
- Overall Score: Moderate at 2 out of 5.
Which one is the best rated?
Autodesk holds a better overall rating (B-) compared to Domo’s C, supported by stronger Discounted Cash Flow and Return on Assets scores, while both share very favorable ROE but unfavorable debt scores.
Scores Comparison
Here is a comparison of the Altman Z-Score and Piotroski Score for Autodesk and Domo:
Autodesk Scores
- Altman Z-Score: 5.05, indicating a safe zone, low bankruptcy risk.
- Piotroski Score: 8, classified as very strong financial health.
Domo Scores
- Altman Z-Score: -10.10, indicating distress zone, high bankruptcy risk.
- Piotroski Score: 3, classified as very weak financial health.
Which company has the best scores?
Autodesk shows significantly stronger financial health with a safe zone Altman Z-Score and a very strong Piotroski Score. Domo’s scores indicate financial distress and very weak financial strength based on the provided data.
Grades Comparison
The grades comparison for Autodesk, Inc. and Domo, Inc. from verified grading companies is as follows:
Autodesk, Inc. Grades
The table below shows recent grades given by recognized grading companies to Autodesk, Inc.:
| Grading Company | Action | New Grade | Date |
|---|---|---|---|
| Barclays | Maintain | Overweight | 2025-11-26 |
| Wells Fargo | Maintain | Overweight | 2025-11-26 |
| Deutsche Bank | Upgrade | Buy | 2025-11-26 |
| B of A Securities | Maintain | Neutral | 2025-11-26 |
| Rosenblatt | Maintain | Buy | 2025-11-26 |
| Macquarie | Maintain | Outperform | 2025-11-26 |
| BMO Capital | Maintain | Market Perform | 2025-11-26 |
| Baird | Maintain | Outperform | 2025-11-26 |
| Rosenblatt | Maintain | Buy | 2025-11-24 |
| Baird | Maintain | Outperform | 2025-11-18 |
Autodesk’s grades show a consistent positive bias, with multiple firms maintaining Buy, Outperform, or Overweight ratings, and only a few Neutral or Market Perform ratings.
Domo, Inc. Grades
The table below summarizes grading actions from reputable companies for Domo, Inc.:
| Grading Company | Action | New Grade | Date |
|---|---|---|---|
| DA Davidson | Maintain | Neutral | 2025-12-05 |
| TD Cowen | Maintain | Buy | 2025-12-05 |
| Lake Street | Maintain | Hold | 2025-12-05 |
| DA Davidson | Maintain | Neutral | 2025-12-01 |
| JMP Securities | Maintain | Market Outperform | 2025-09-10 |
| DA Davidson | Maintain | Neutral | 2025-08-28 |
| Cantor Fitzgerald | Maintain | Overweight | 2025-08-28 |
| TD Cowen | Upgrade | Buy | 2025-08-26 |
| JMP Securities | Maintain | Market Outperform | 2025-06-25 |
| Cantor Fitzgerald | Maintain | Overweight | 2025-06-25 |
Domo’s ratings exhibit a mix of Neutral, Hold, Buy, Market Outperform, and Overweight, with fewer upgrades and a more cautious overall stance compared to Autodesk.
Which company has the best grades?
Autodesk, Inc. has received more consistent Buy and Outperform grades from multiple firms, while Domo, Inc. shows a more mixed rating profile including Neutral and Hold. This suggests Autodesk currently enjoys stronger analyst confidence, potentially influencing investor perception of stability and growth prospects.
Strengths and Weaknesses
The table below summarizes the key strengths and weaknesses of Autodesk, Inc. (ADSK) and Domo, Inc. (DOMO) based on their recent financial performance, market presence, and strategic positioning.
| Criterion | Autodesk, Inc. (ADSK) | Domo, Inc. (DOMO) |
|---|---|---|
| Diversification | Broad product portfolio across Architecture, Manufacturing, Media, and AutoCAD segments with steady revenue growth (2025 revenue: $7.2B) | Narrower focus on subscription and professional services with smaller scale (2025 revenue: $317M) |
| Profitability | Strong net margin (18.14%) and ROIC (18.01%), consistently creating value with growing ROIC | Mixed signals: negative net margin (-25.84%) but very high ROIC (194.73%) indicating efficient capital use despite losses |
| Innovation | Established leader with durable competitive advantage and increasing profitability | Highly innovative with very favorable ROIC trend but profitability challenges persist |
| Global presence | Extensive global reach in engineering, manufacturing, and design industries | Limited global footprint, primarily focused on subscription services |
| Market Share | Significant market share in CAD and engineering software markets | Smaller market presence, emerging player in business intelligence and analytics |
Autodesk’s diversified product base and strong profitability indicate a stable and growing business with a durable moat. Domo shows exceptional capital efficiency and innovation potential but faces challenges in profitability and scale. Investors should weigh Autodesk’s stability against Domo’s growth prospects and risk profile.
Risk Analysis
Below is a comparison of key risks for Autodesk, Inc. (ADSK) and Domo, Inc. (DOMO) based on the most recent 2025 data:
| Metric | Autodesk, Inc. (ADSK) | Domo, Inc. (DOMO) |
|---|---|---|
| Market Risk | Beta 1.47: moderate volatility | Beta 1.65: higher volatility |
| Debt level | Debt/Equity 0.98: moderate | Negative debt/equity (-0.76): unusual, high financial complexity |
| Regulatory Risk | Moderate, due to global operations | Moderate, focused on cloud software compliance |
| Operational Risk | Low, stable business model | High, negative margins and operational losses |
| Environmental Risk | Moderate, software sector impact | Moderate, data center energy use concerns |
| Geopolitical Risk | Moderate, exposure to global markets | Moderate, international presence with US focus |
The most impactful risks are operational and financial for Domo, with negative margins and distress-level Altman Z-Score indicating high bankruptcy risk. Autodesk shows moderate market volatility but strong financial health, positioning it as lower risk overall.
Which Stock to Choose?
Autodesk, Inc. (ADSK) shows a generally favorable income evolution with 12.7% revenue growth in 2025 and strong profitability metrics, including an 18.14% net margin and 42.43% ROE. Its debt levels are moderate with a debt-to-assets ratio of 23.62%, and the company holds a very favorable B- rating, despite some unfavorable valuation ratios.
Domo, Inc. (DOMO) experiences an unfavorable income trend in 2025, marked by a -0.61% revenue decline and a -25.84% net margin. While it has a high ROE of 46.23%, its financial ratios are split evenly between favorable and unfavorable, with significant debt concerns reflected in a 63.23% debt-to-assets ratio and a very favorable C rating overshadowed by weak liquidity and valuation.
For investors, Autodesk might appear more suitable for those prioritizing stable income growth and strong profitability with a durable competitive advantage, while Domo could be seen as more fitting for risk-tolerant investors interested in potential value creation despite financial challenges. The contrasting ratings and income profiles suggest the choice depends on the investor’s risk appetite and investment strategy.
Disclaimer: Investment carries a risk of loss of initial capital. The past performance is not a reliable indicator of future results. Be sure to understand risks before making an investment decision.
Go Further
I encourage you to read the complete analyses of Autodesk, Inc. and Domo, Inc. to enhance your investment decisions: