In the dynamic software industry, Autodesk, Inc. (ADSK) and DocuSign, Inc. (DOCU) stand out as leaders with distinct yet overlapping market focuses. Autodesk specializes in 3D design and engineering software, while DocuSign innovates in electronic signature and agreement management solutions. Both companies drive digital transformation with cutting-edge technology, making them compelling options for investors seeking growth in software applications. This article will help you decide which company presents the most attractive investment opportunity in 2026.

Table of contents
Companies Overview
I will begin the comparison between Autodesk and DocuSign by providing an overview of these two companies and their main differences.
Autodesk Overview
Autodesk, Inc. specializes in 3D design, engineering, and entertainment software and services worldwide. The company offers a broad portfolio including AutoCAD, Fusion 360, and BIM 360, targeting professionals in architecture, engineering, construction, manufacturing, and media industries. Headquartered in San Rafael, California, Autodesk is a key player in the software application industry with a market cap of $56.6B and a workforce of 15,300 employees.
DocuSign Overview
DocuSign, Inc. provides electronic signature software and related agreement management solutions globally. Its offerings include e-signature platforms, AI-driven contract lifecycle management, and industry-specific cloud products for real estate, mortgage, and government sectors. Based in San Francisco, California, DocuSign operates in the software application industry with a market cap of $11.4B and employs 6,838 people.
Key similarities and differences
Both Autodesk and DocuSign operate in the software application sector, focusing on cloud-based solutions to enhance business workflows. Autodesk emphasizes 3D design and engineering software across multiple industries, while DocuSign centers on digital agreement management and e-signature technology. Autodesk has a significantly larger market capitalization and workforce compared to DocuSign, reflecting different scales and market focuses within the technology sector.
Income Statement Comparison
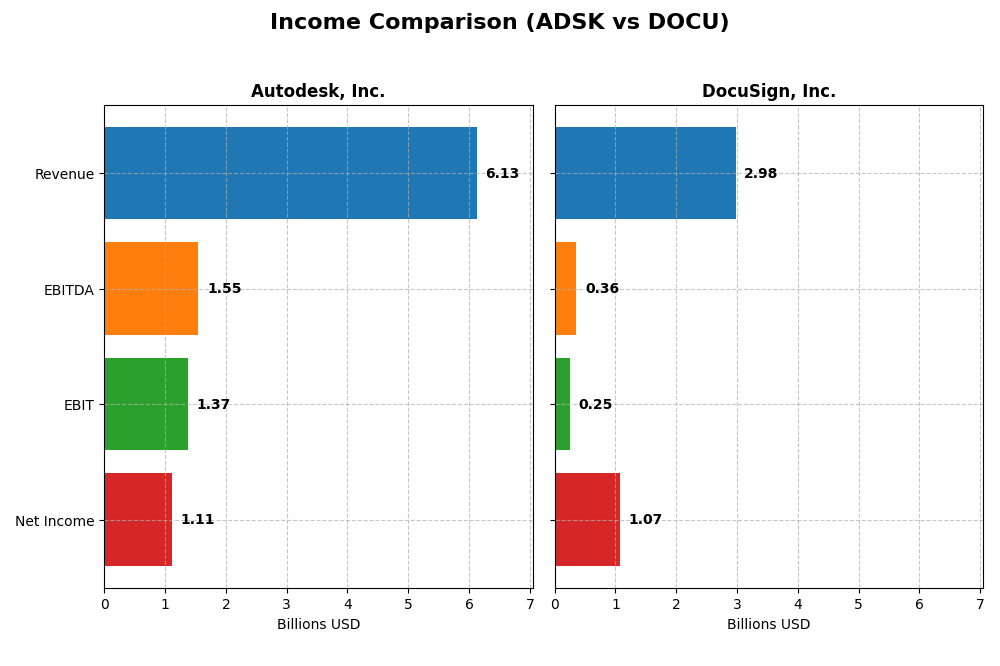
The table below presents a side-by-side comparison of key income statement metrics for Autodesk, Inc. and DocuSign, Inc. for the fiscal year 2025.
| Metric | Autodesk, Inc. (ADSK) | DocuSign, Inc. (DOCU) |
|---|---|---|
| Market Cap | 56.6B | 11.4B |
| Revenue | 6.13B | 2.98B |
| EBITDA | 1.55B | 357M |
| EBIT | 1.37B | 249M |
| Net Income | 1.11B | 1.07B |
| EPS | 5.17 | 5.23 |
| Fiscal Year | 2025 | 2025 |
Income Statement Interpretations
Autodesk, Inc.
Autodesk’s revenue showed a steady increase from $3.79B in 2021 to $6.13B in 2025, marking a favorable 61.74% growth over the period. Net income fluctuated, peaking at $1.21B in 2021 before dipping to $906M in 2024 and rising again to $1.11B in 2025. Margins were generally stable with a strong gross margin of 90.57% in 2025, while net margin slightly declined overall. The latest fiscal year showed robust revenue growth of 12.7% and improved EBIT margin at 22.33%.
DocuSign, Inc.
DocuSign experienced significant revenue growth from $1.45B in 2021 to approximately $2.98B in 2025, a favorable 104.86% increase. Net income improved dramatically from a loss of $243M in 2021 to a net profit of $1.07B in 2025. Gross margin remained favorable at 79.12%, though EBIT margin was moderate at 8.38%. The recent fiscal year showed a solid 7.78% revenue growth, with notable jumps in net margin and EPS, reflecting operational improvements.
Which one has the stronger fundamentals?
Both companies present favorable income statement evaluations, but DocuSign’s overall growth in revenue, net income, and margins is more pronounced, showing strong turnaround capabilities and margin expansion. Autodesk maintains higher margins and consistent revenue growth but with some net income volatility. DocuSign’s rapid improvement in profitability contrasts with Autodesk’s steadier but slower net income progress, highlighting different strengths in fundamentals.
Financial Ratios Comparison
The table below presents a side-by-side comparison of key financial ratios for Autodesk, Inc. and DocuSign, Inc. based on their most recent fiscal year data (2025).
| Ratios | Autodesk, Inc. (ADSK) | DocuSign, Inc. (DOCU) |
|---|---|---|
| ROE | 42.4% | 53.3% |
| ROIC | 18.0% | 9.1% |
| P/E | 60.2 | 18.5 |
| P/B | 25.5 | 9.9 |
| Current Ratio | 0.68 | 0.81 |
| Quick Ratio | 0.68 | 0.81 |
| D/E | 0.98 | 0.06 |
| Debt-to-Assets | 23.6% | 3.1% |
| Interest Coverage | 0 | 129 |
| Asset Turnover | 0.57 | 0.74 |
| Fixed Asset Turnover | 21.4 | 7.3 |
| Payout Ratio | 0 | 0 |
| Dividend Yield | 0 | 0 |
Interpretation of the Ratios
Autodesk, Inc.
Autodesk displays strong profitability with a net margin of 18.14% and a high return on equity of 42.43%, supported by a solid return on invested capital at 18.01%. However, concerns arise from its high price-to-earnings ratio of 60.2, low liquidity with a current ratio of 0.68, and a price-to-book of 25.54. The company does not pay dividends, likely focusing on reinvestment and growth.
DocuSign, Inc.
DocuSign shows excellent profitability metrics, including a net margin of 35.87% and return on equity of 53.32%, with a moderate return on invested capital of 9.09%. It benefits from low debt levels and strong interest coverage, but its price-to-book ratio of 9.87 and current ratio of 0.81 indicate some caution. DocuSign also does not distribute dividends, possibly prioritizing expansion and R&D.
Which one has the best ratios?
Both companies present strengths in profitability and leverage metrics, with Autodesk excelling in return on invested capital and DocuSign in net margin and conservative debt levels. Autodesk’s elevated valuation multiples and weaker liquidity contrast with DocuSign’s slightly more favorable overall ratio profile. DocuSign’s ratios lean toward a slightly favorable stance compared to Autodesk’s neutral evaluation.
Strategic Positioning
This section compares the strategic positioning of Autodesk and DocuSign, focusing on market position, key segments, and exposure to technological disruption:
Autodesk, Inc.
- Leading software application provider facing competitive pressure in 3D design and engineering markets.
- Diversified key segments: architecture, engineering, construction, manufacturing, media, and entertainment software.
- Exposure to technological disruption through cloud-based construction management and advanced 3D CAD/CAM tools.
DocuSign, Inc.
- Electronic signature software provider with moderate competition in digital agreement management.
- Concentrated on subscription-based electronic signature solutions and professional services.
- Focused on AI-driven contract lifecycle management and digital transaction technologies.
Autodesk vs DocuSign Positioning
Autodesk shows a diversified business model across multiple professional software segments, providing broader market exposure. DocuSign concentrates on digital agreement and signature solutions, offering specialization but narrower market focus. Autodesk’s scale supports resilience, while DocuSign emphasizes innovation in AI-driven contract management.
Which has the best competitive advantage?
Based on MOAT evaluation, Autodesk holds a very favorable competitive advantage with significant value creation and growing ROIC. DocuSign is slightly favorable, showing increasing profitability but currently shedding value, indicating a less durable competitive moat.
Stock Comparison
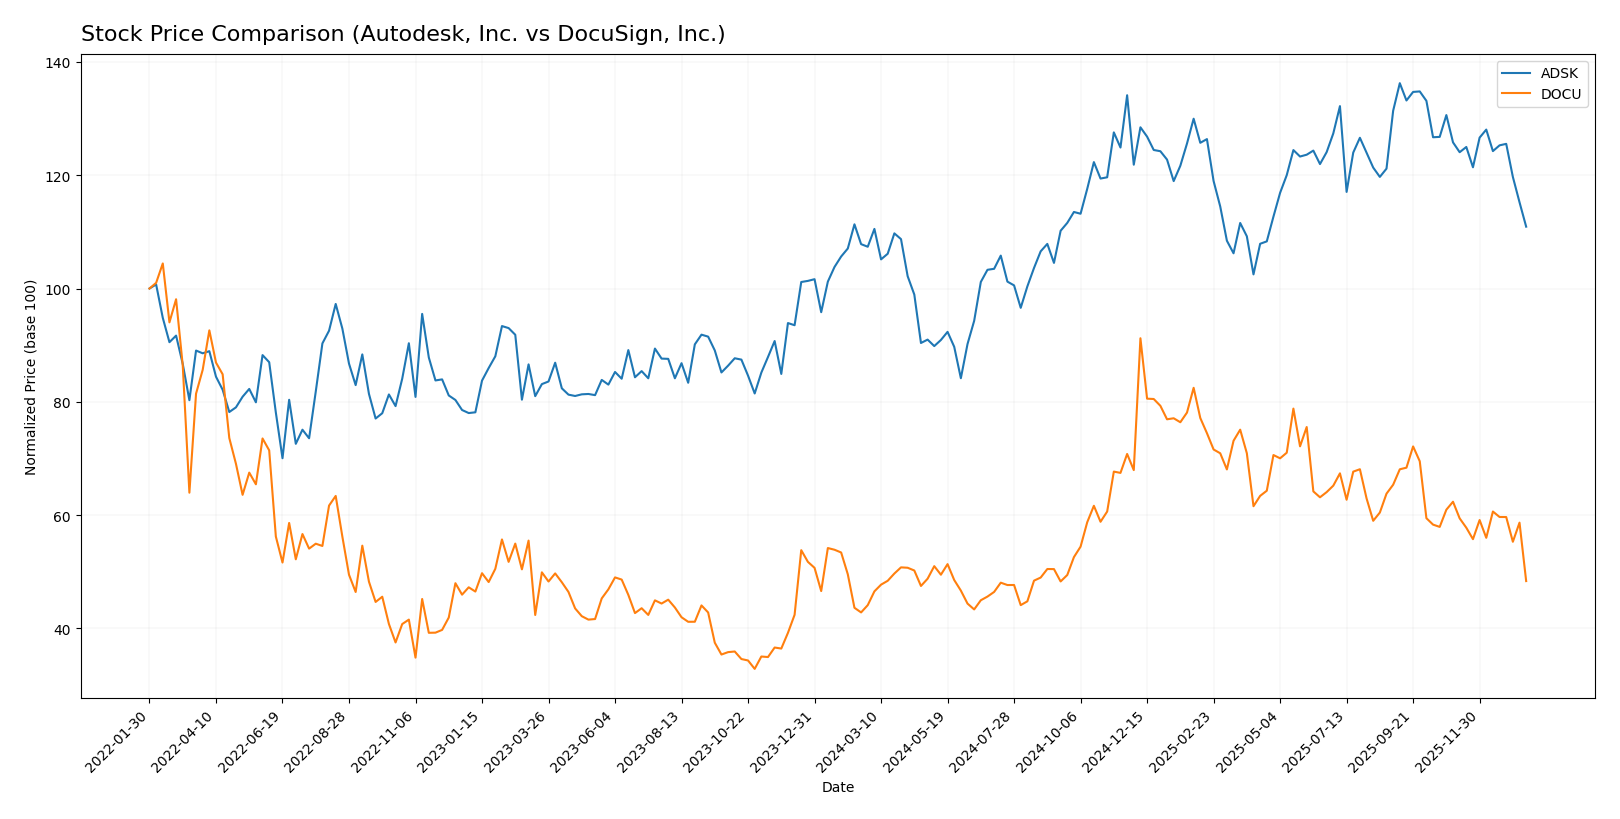
The past year’s stock price movements for Autodesk, Inc. (ADSK) and DocuSign, Inc. (DOCU) reveal distinct bullish trends with notable deceleration and recent declines in both equities.
Trend Analysis
Autodesk, Inc. showed a 3.3% price increase over the past 12 months, indicating a bullish trend with deceleration. The stock reached a high of 326.37 and a low of 201.6, with recent weeks showing a -11.83% decline.
DocuSign, Inc. posted a 9.63% gain over the same period, also bullish with deceleration. It experienced a high of 106.99 and a low of 50.84, but recent trading saw a sharper drop of -22.46%.
Comparing the two, DocuSign delivered the highest market performance over the past year despite both stocks suffering recent downward pressure.
Target Prices
Here is the target price consensus from verified analysts for Autodesk, Inc. and DocuSign, Inc.:
| Company | Target High | Target Low | Consensus |
|---|---|---|---|
| Autodesk, Inc. | 400 | 343 | 373 |
| DocuSign, Inc. | 88 | 70 | 76.86 |
Analysts expect Autodesk’s stock to trade significantly higher than its current price of $265.69, indicating strong growth potential. DocuSign’s consensus target also suggests a notable upside from its present price of $56.71.
Analyst Opinions Comparison
This section compares analysts’ ratings and grades for Autodesk, Inc. and DocuSign, Inc.:
Rating Comparison
Autodesk, Inc. Rating
- Rating: B-, considered very favorable overall.
- Discounted Cash Flow Score: Moderate at 3 out of 5.
- ROE Score: Very favorable at 5 out of 5, indicating strong profitability from equity.
- ROA Score: Favorable at 4 out of 5, showing efficient asset use.
- Debt To Equity Score: Very unfavorable at 1 out of 5, indicating high financial risk.
- Overall Score: Moderate at 3 out of 5.
DocuSign, Inc. Rating
- Rating: B+, also considered very favorable overall.
- Discounted Cash Flow Score: Very favorable at 5 out of 5.
- ROE Score: Favorable at 4 out of 5, showing good profitability.
- ROA Score: Favorable at 4 out of 5, similarly efficient asset use.
- Debt To Equity Score: Moderate at 3 out of 5, indicating moderate financial risk.
- Overall Score: Moderate at 3 out of 5.
Which one is the best rated?
DocuSign holds a higher rating (B+) compared to Autodesk (B-), with stronger discounted cash flow and better debt-to-equity scores. Autodesk has a better ROE score but suffers from a weak debt position. Overall, DocuSign is rated more favorably on key financial risk and valuation metrics.
Scores Comparison
Here is a comparison of the Altman Z-Score and Piotroski Score for Autodesk, Inc. and DocuSign, Inc.:
Autodesk, Inc. Scores
- Altman Z-Score: 5.05, indicating a safe zone with low bankruptcy risk.
- Piotroski Score: 8, classified as very strong financial health.
DocuSign, Inc. Scores
- Altman Z-Score: 4.43, indicating a safe zone with low bankruptcy risk.
- Piotroski Score: 5, classified as average financial health.
Which company has the best scores?
Autodesk shows both a higher Altman Z-Score and a significantly stronger Piotroski Score compared to DocuSign. This suggests Autodesk has better financial stability and strength based on the provided data.
Grades Comparison
Here is a comparison of recent reliable grades from established grading companies for Autodesk, Inc. and DocuSign, Inc.:
Autodesk, Inc. Grades
The following table summarizes recent grades and actions by recognized financial institutions for Autodesk, Inc.:
| Grading Company | Action | New Grade | Date |
|---|---|---|---|
| Barclays | Maintain | Overweight | 2025-11-26 |
| Wells Fargo | Maintain | Overweight | 2025-11-26 |
| Deutsche Bank | Upgrade | Buy | 2025-11-26 |
| B of A Securities | Maintain | Neutral | 2025-11-26 |
| Rosenblatt | Maintain | Buy | 2025-11-26 |
| Macquarie | Maintain | Outperform | 2025-11-26 |
| BMO Capital | Maintain | Market Perform | 2025-11-26 |
| Baird | Maintain | Outperform | 2025-11-26 |
| Rosenblatt | Maintain | Buy | 2025-11-24 |
| Baird | Maintain | Outperform | 2025-11-18 |
Autodesk’s grades show a generally positive trend with multiple “Buy,” “Outperform,” and “Overweight” ratings, indicating confidence among analysts.
DocuSign, Inc. Grades
The table below shows recent grades and actions by reputable firms for DocuSign, Inc.:
| Grading Company | Action | New Grade | Date |
|---|---|---|---|
| RBC Capital | Maintain | Sector Perform | 2026-01-05 |
| Evercore ISI Group | Maintain | In Line | 2025-12-05 |
| UBS | Maintain | Neutral | 2025-12-05 |
| Wells Fargo | Maintain | Equal Weight | 2025-12-05 |
| Piper Sandler | Maintain | Neutral | 2025-12-05 |
| RBC Capital | Maintain | Sector Perform | 2025-12-05 |
| JP Morgan | Maintain | Neutral | 2025-12-05 |
| B of A Securities | Maintain | Neutral | 2025-12-05 |
| Needham | Maintain | Hold | 2025-12-05 |
| Baird | Maintain | Neutral | 2025-12-05 |
DocuSign’s ratings predominantly consist of “Neutral,” “Hold,” and “Sector Perform,” reflecting a cautious or balanced market outlook.
Which company has the best grades?
Autodesk, Inc. has received notably stronger grades than DocuSign, Inc., with multiple “Buy” and “Outperform” ratings compared to DocuSign’s largely neutral and hold positions. This suggests greater analyst confidence in Autodesk’s prospects, which may influence investor sentiment and portfolio decisions.
Strengths and Weaknesses
The table below compares Autodesk, Inc. (ADSK) and DocuSign, Inc. (DOCU) across key criteria based on the most recent data available for 2025 and the 2021-2025 period.
| Criterion | Autodesk, Inc. (ADSK) | DocuSign, Inc. (DOCU) |
|---|---|---|
| Diversification | Highly diversified revenue streams: Architecture Engineering & Construction (2.94B), AutoCAD (1.57B), Manufacturing (1.19B), Media & Entertainment (315M) | Less diversified, mainly Subscription & Circulation (2.9B) with small Professional Services (75M) |
| Profitability | Strong profitability with 18.14% net margin and 42.43% ROE; ROIC at 18.01% (favorable) | High net margin at 35.87% and ROE 53.32%, but ROIC neutral at 9.09%; value shedding overall |
| Innovation | Demonstrates durable competitive advantage with growing ROIC (+15.4%) indicating successful innovation | Growing ROIC trend (+167.8%) but still shedding value; innovation improving profitability but not yet a moat |
| Global presence | Global footprint in multiple sectors with strong market adoption | Global digital document market presence, but less diversified geographically and sector-wise |
| Market Share | Leading in CAD and design software with growing revenue streams | Strong market share in e-signature and digital transaction management, growing rapidly |
Key takeaways: Autodesk shows a robust and diversified business model with a very favorable moat and consistent profitability, making it a more stable investment. DocuSign has strong profitability and rapid growth in returns but still lacks a durable competitive advantage, signaling higher risk but potential upside.
Risk Analysis
Below is a risk comparison table for Autodesk, Inc. (ADSK) and DocuSign, Inc. (DOCU) based on the most recent 2025 data.
| Metric | Autodesk, Inc. (ADSK) | DocuSign, Inc. (DOCU) |
|---|---|---|
| Market Risk | Beta 1.47 indicates higher volatility versus market | Beta 0.99 shows market risk close to average |
| Debt level | Debt to equity ~0.98 (neutral); debt/assets 23.6% | Low debt to equity 0.06; debt/assets 3.1% (favorable) |
| Regulatory Risk | Moderate, in software sector with evolving standards | Moderate, with focus on digital contracts and privacy |
| Operational Risk | Medium: complex product suite and global operations | Medium: cloud services reliant on uptime and security |
| Environmental Risk | Low: software company with limited direct impact | Low: primarily digital services |
| Geopolitical Risk | Moderate: global supply chains and customer base | Moderate: US-based but international exposure |
In summary, Autodesk’s higher leverage and market volatility present notable financial and market risks, though it has strong operational resilience. DocuSign benefits from low debt and stable market risk but faces challenges in maintaining competitive edge in a fast-evolving digital agreements market. Both are financially stable with Altman Z-scores in the safe zone, but Autodesk’s higher beta and debt level make risk management more critical.
Which Stock to Choose?
Autodesk, Inc. (ADSK) shows favorable income growth with a 12.7% revenue increase in 2025 and strong profitability metrics, including an 18.14% net margin and 42.43% ROE. Its debt level is moderate with a debt-to-assets ratio of 23.62%, and the company holds a very favorable B- rating, supported by a very strong Piotroski score and a very favorable moat.
DocuSign, Inc. (DOCU) exhibits solid income growth overall, with a 7.78% revenue increase in 2025 and an impressive 35.87% net margin. It maintains low debt with a 3.1% debt-to-assets ratio and a very favorable B+ rating. The company benefits from a slightly favorable moat status and a safe-zone Altman Z-score, though its Piotroski score is average.
For investors prioritizing durable competitive advantages and strong capital efficiency, Autodesk’s very favorable moat and robust profitability ratios might signal potential. Conversely, those focused on higher net margins and lower leverage might find DocuSign’s slightly favorable moat and conservative debt position more appealing. These interpretations could vary depending on individual risk tolerance and investment strategy.
Disclaimer: Investment carries a risk of loss of initial capital. The past performance is not a reliable indicator of future results. Be sure to understand risks before making an investment decision.
Go Further
I encourage you to read the complete analyses of Autodesk, Inc. and DocuSign, Inc. to enhance your investment decisions: