Autodesk, Inc. and Cadence Design Systems, Inc. are two prominent players in the software application industry, each driving innovation in design and engineering solutions. Autodesk excels in 3D design and construction software, while Cadence specializes in integrated circuit design and verification tools. Their market overlap and technological advancements make them compelling candidates for comparison. In this article, I will help you identify which company holds the most promise for your investment portfolio.
Table of contents
Companies Overview
I will begin the comparison between Autodesk and Cadence Design Systems by providing an overview of these two companies and their main differences.
Autodesk Overview
Autodesk, Inc. specializes in 3D design, engineering, and entertainment software and services worldwide. Its products include AutoCAD, BIM 360, and Fusion 360, catering to architecture, engineering, construction, manufacturing, and media industries. Headquartered in San Rafael, California, Autodesk focuses on software that enhances design, drafting, simulation, and collaboration processes for professionals across multiple sectors.
Cadence Design Systems Overview
Cadence Design Systems, Inc. offers software, hardware, and services primarily for integrated circuit (IC) design and verification. The company provides platforms for functional verification, digital IC design, physical implementation, and system analysis aimed at markets such as 5G communications, aerospace, automotive, and healthcare. Based in San Jose, California, Cadence emphasizes advanced solutions for chip design, verification, and IP integration.
Key similarities and differences
Both Autodesk and Cadence operate in the technology sector, focusing on software application solutions. Autodesk centers on 3D design and engineering software for a broad range of industries, while Cadence specializes in electronic design automation for semiconductor and system design. Each company provides tools to improve design efficiency and accuracy, but they serve distinct markets with different technical requirements.
Income Statement Comparison
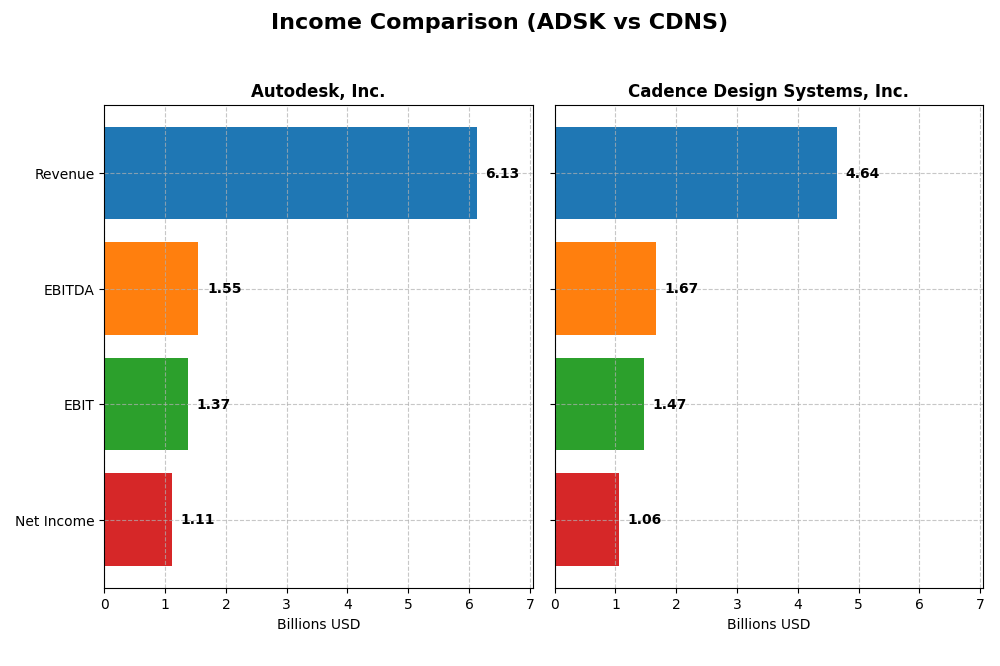
The table below compares the key income statement metrics for Autodesk, Inc. and Cadence Design Systems, Inc. for their most recent fiscal years, providing a clear snapshot of their financial performance.
| Metric | Autodesk, Inc. (ADSK) | Cadence Design Systems, Inc. (CDNS) |
|---|---|---|
| Market Cap | 61.2B | 84.5B |
| Revenue | 6.13B | 4.64B |
| EBITDA | 1.55B | 1.67B |
| EBIT | 1.37B | 1.47B |
| Net Income | 1.11B | 1.06B |
| EPS | 5.17 | 3.89 |
| Fiscal Year | 2025 | 2024 |
Income Statement Interpretations
Autodesk, Inc.
From 2021 to 2025, Autodesk’s revenue showed a steady increase, reaching $6.13B in 2025, with net income fluctuating but ending at $1.11B. Margins remained strong, with a gross margin of 90.57% and a net margin of 18.14% in 2025. The latest year saw revenue growth at 12.7%, EBIT margin improvements, and EPS growth of 22.2%, signaling solid operational efficiency.
Cadence Design Systems, Inc.
Cadence’s revenue rose consistently over 2020-2024, hitting $4.64B in 2024, with net income growing to $1.06B. Its gross margin stood at 86.05%, and net margin at 22.74% in 2024. Though revenue and EBIT grew favorably, net margin declined slightly by 10.66% in the last year, while EPS growth was marginally positive at 0.79%, indicating near stability in profitability.
Which one has the stronger fundamentals?
Both companies exhibit favorable income statement trends, with Autodesk showing impressive margin stability and growth in EPS over one year but a slight decline over the entire period. Cadence demonstrates stronger overall net income growth and higher net margin, despite a recent net margin dip. Autodesk’s zero interest expense is favorable, while Cadence maintains a low but positive interest expense. The choice depends on prioritizing margin consistency or long-term net income expansion.
Financial Ratios Comparison
The table below presents a side-by-side comparison of key financial ratios for Autodesk, Inc. and Cadence Design Systems, Inc. based on their latest available fiscal year data.
| Ratios | Autodesk, Inc. (2025) | Cadence Design Systems, Inc. (2024) |
|---|---|---|
| ROE | 42.4% | 22.6% |
| ROIC | 18.0% | 13.4% |
| P/E | 60.2 | 77.2 |
| P/B | 25.5 | 17.4 |
| Current Ratio | 0.68 | 2.93 |
| Quick Ratio | 0.68 | 2.74 |
| D/E (Debt-to-Equity) | 0.98 | 0.55 |
| Debt-to-Assets | 23.6% | 28.8% |
| Interest Coverage | 0 | 17.8 |
| Asset Turnover | 0.57 | 0.52 |
| Fixed Asset Turnover | 21.4 | 7.68 |
| Payout ratio | 0 | 0 |
| Dividend yield | 0 | 0 |
Interpretation of the Ratios
Autodesk, Inc.
Autodesk shows a mix of strong and weak ratios. It has favorable net margin (18.14%), high ROE (42.43%), and ROIC (18.01%), but its valuation multiples like PE (60.2) and PB (25.54) are high, indicating expensive pricing. Liquidity ratios are weak with a current ratio of 0.68. Autodesk does not pay dividends, likely due to reinvestment in R&D and growth initiatives.
Cadence Design Systems, Inc.
Cadence presents generally strong ratios, including a favorable net margin of 22.74%, ROE of 22.58%, and ROIC of 13.43%. Its liquidity is excellent with a current ratio of 2.93. However, its PE ratio at 77.2 suggests overvaluation risks. Like Autodesk, Cadence does not pay dividends, probably focusing on growth and innovation instead of shareholder payouts.
Which one has the best ratios?
Cadence has a more favorable overall ratio profile, with a higher proportion of strong metrics and better liquidity compared to Autodesk. Autodesk exhibits higher profitability ratios but weaker liquidity and more valuation concerns. Both companies do not distribute dividends, reflecting a growth-oriented capital allocation strategy.
Strategic Positioning
This section compares the strategic positioning of Autodesk, Inc. and Cadence Design Systems, Inc., focusing on Market position, Key segments, and Exposure to technological disruption:
Autodesk, Inc.
- Market position and competitive pressure
- Key segments and business drivers
- Exposure to technological disruption
Cadence Design Systems, Inc.
- $61B market cap; operates in software with moderate beta 1.48
- Diverse segments: architecture, manufacturing, media, CAD tools
- Provides cloud-based design and engineering software solutions
Autodesk, Inc. vs Cadence Design Systems, Inc. Positioning
Autodesk shows diversified business across architecture, manufacturing, and media, supporting resilience but potential complexity. Cadence concentrates on IC design and verification, enabling specialization but less diversification. Both face sector-specific competitive pressures and evolving technology demands.
Which has the best competitive advantage?
Both companies create value with ROIC above WACC but show declining profitability trends. Autodesk’s slightly higher ROIC advantage is offset by a sharper ROIC decline, while Cadence’s steadier ROIC suggests marginally more stable economic moat conditions.
Stock Comparison
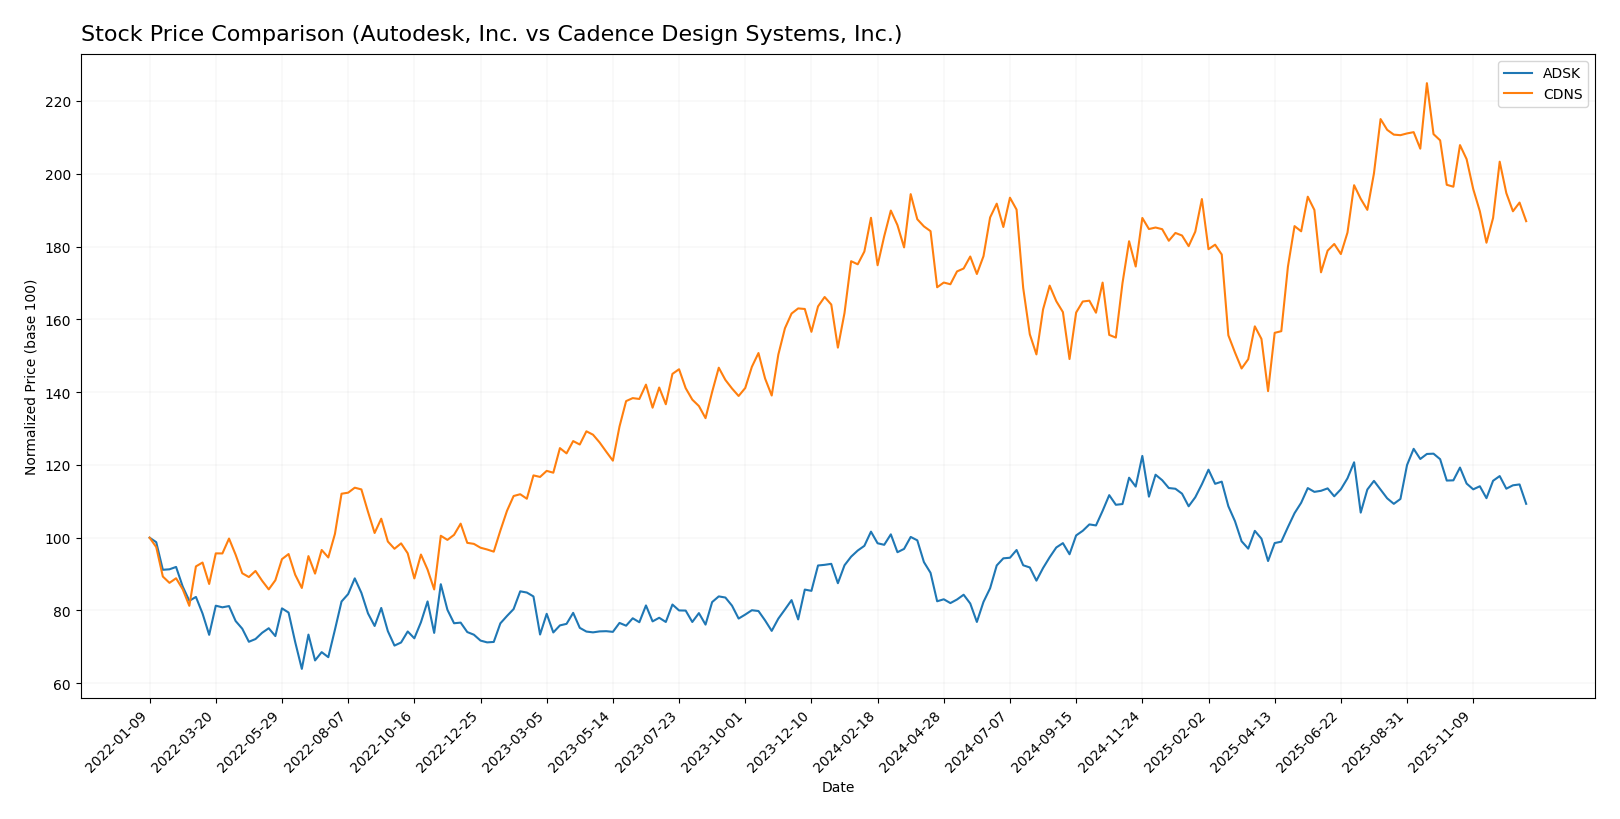
The stock price movements of Autodesk, Inc. and Cadence Design Systems, Inc. over the past year reveal contrasting trends, with Autodesk showing overall gains amid decelerating momentum while Cadence exhibits a marginal decline with subdued performance dynamics.
Trend Analysis
Autodesk, Inc. (ADSK) recorded a bullish trend over the last 12 months with a 7.52% price increase, though momentum has decelerated. The stock reached a high of 326.37 and a low of 201.6, showing significant volatility with a 29.92 std deviation.
Cadence Design Systems, Inc. (CDNS) showed a bearish trend with a slight 0.49% decrease over the same period, accompanied by decelerating momentum. It experienced a high of 373.35 and a low of 232.88, with a volatility close to 29.0 std deviation.
Comparing these trends, Autodesk outperformed Cadence in market performance, achieving positive price appreciation while Cadence’s stock price remained nearly flat with a slight decline.
Target Prices
The consensus target prices from verified analysts indicate positive upside potential for both Autodesk, Inc. and Cadence Design Systems, Inc.
| Company | Target High | Target Low | Consensus |
|---|---|---|---|
| Autodesk, Inc. | 400 | 343 | 372.88 |
| Cadence Design Systems, Inc. | 418 | 275 | 381 |
Analysts expect Autodesk’s stock to rise significantly above its current price of $286.73, while Cadence’s consensus target of $381 also suggests notable upside from its current $310.40 share price.
Analyst Opinions Comparison
This section compares analysts’ ratings and grades for Autodesk, Inc. and Cadence Design Systems, Inc.:
Rating Comparison
Autodesk, Inc. Rating
- Rating: B- with a very favorable status.
- Discounted Cash Flow Score: 3, indicating a moderate level.
- ROE Score: 5, classified as very favorable.
- ROA Score: 4, considered favorable.
- Debt To Equity Score: 1, rated very unfavorable.
- Overall Score: 3, showing a moderate standing.
Cadence Design Systems, Inc. Rating
- Rating: B with a very favorable status.
- Discounted Cash Flow Score: 3, indicating a moderate level.
- ROE Score: 4, classified as favorable.
- ROA Score: 5, considered very favorable.
- Debt To Equity Score: 2, rated moderate.
- Overall Score: 3, showing a moderate standing.
Which one is the best rated?
Based strictly on the data, Cadence Design Systems has a higher overall rating (B vs. B-) and stronger ROA and debt-to-equity scores, while Autodesk excels in ROE but has a weaker debt position.
Scores Comparison
Here is a comparison of the Altman Z-Score and Piotroski Score for Autodesk and Cadence Design Systems:
ADSK Scores
- Altman Z-Score of 5.45 indicating a safe zone status.
- Piotroski Score of 8 reflecting very strong financial health.
CDNS Scores
- Altman Z-Score of 14.10 indicating a safe zone status.
- Piotroski Score of 7 indicating strong financial health.
Which company has the best scores?
Cadence Design Systems has a higher Altman Z-Score, suggesting stronger bankruptcy safety, while Autodesk holds a higher Piotroski Score, indicating slightly stronger financial health based on the provided data.
Grades Comparison
Here is a summary of the recent grades assigned to Autodesk, Inc. and Cadence Design Systems, Inc.:
Autodesk, Inc. Grades
The following table shows recent grades from recognized financial institutions for Autodesk, Inc.:
| Grading Company | Action | New Grade | Date |
|---|---|---|---|
| Barclays | Maintain | Overweight | 2025-11-26 |
| BMO Capital | Maintain | Market Perform | 2025-11-26 |
| Wells Fargo | Maintain | Overweight | 2025-11-26 |
| Deutsche Bank | Upgrade | Buy | 2025-11-26 |
| Rosenblatt | Maintain | Buy | 2025-11-26 |
| Macquarie | Maintain | Outperform | 2025-11-26 |
| Baird | Maintain | Outperform | 2025-11-26 |
| B of A Securities | Maintain | Neutral | 2025-11-26 |
| Rosenblatt | Maintain | Buy | 2025-11-24 |
| Baird | Maintain | Outperform | 2025-11-18 |
Grades for Autodesk, Inc. generally indicate a positive outlook, with several upgrades and consistent “Overweight,” “Buy,” and “Outperform” ratings.
Cadence Design Systems, Inc. Grades
The following table presents recent grades from established grading firms for Cadence Design Systems, Inc.:
| Grading Company | Action | New Grade | Date |
|---|---|---|---|
| Needham | Maintain | Buy | 2025-12-22 |
| Oppenheimer | Maintain | Underperform | 2025-10-28 |
| Needham | Maintain | Buy | 2025-10-28 |
| Wells Fargo | Maintain | Overweight | 2025-10-28 |
| Baird | Maintain | Outperform | 2025-10-28 |
| JP Morgan | Maintain | Overweight | 2025-10-28 |
| Rosenblatt | Maintain | Neutral | 2025-10-28 |
| Rosenblatt | Maintain | Neutral | 2025-10-22 |
| Loop Capital | Maintain | Buy | 2025-07-29 |
| Mizuho | Maintain | Outperform | 2025-07-29 |
Cadence Design Systems, Inc. shows a mixed to positive consensus, with several “Buy,” “Overweight,” and “Outperform” ratings, but also an “Underperform” from Oppenheimer.
Which company has the best grades?
Autodesk, Inc. has received more consistent positive grades, including upgrades and multiple “Buy” and “Outperform” ratings, while Cadence Design Systems, Inc. shows more variation with one notable “Underperform.” This suggests a stronger analyst confidence in Autodesk’s near-term prospects, which may influence investor sentiment and portfolio allocation decisions.
Strengths and Weaknesses
Below is a comparison of key strengths and weaknesses of Autodesk, Inc. (ADSK) and Cadence Design Systems, Inc. (CDNS) based on recent financial and operational data:
| Criterion | Autodesk, Inc. (ADSK) | Cadence Design Systems, Inc. (CDNS) |
|---|---|---|
| Diversification | High diversification across Architecture, Manufacturing, Media sectors with steady revenue growth. | Moderate diversification focused on Product & Maintenance and Technology Services segments. |
| Profitability | Strong profitability with net margin 18.14%, ROIC 18.01%, but declining ROIC trend. | Higher net margin at 22.74%, solid ROIC 13.43%, also facing declining ROIC trend. |
| Innovation | Leading software solutions with continuous product updates, but ROIC decline signals caution. | Consistent innovation in design software, favorable ratio evaluations indicate effective management. |
| Global presence | Extensive global footprint in architecture and manufacturing industries. | Strong global presence in electronic design automation markets. |
| Market Share | Large market share in CAD and AEC sectors, supported by robust revenue growth. | Significant share in electronic design software, growing revenues in product and services. |
Key takeaways: Both companies create value with favorable profitability, but Autodesk shows more diversification and higher ROIC despite a declining trend. Cadence offers stronger current profitability ratios and liquidity but also faces a declining ROIC. Investors should weigh diversification against profitability trends and market position.
Risk Analysis
Below is a risk comparison table for Autodesk, Inc. (ADSK) and Cadence Design Systems, Inc. (CDNS) based on the most recent data available in 2026:
| Metric | Autodesk, Inc. (ADSK) | Cadence Design Systems, Inc. (CDNS) |
|---|---|---|
| Market Risk | High (Beta 1.475) | Moderate (Beta 1.051) |
| Debt Level | Moderate (D/E 0.98, Debt/Assets 23.62%) | Moderate (D/E 0.55, Debt/Assets 28.8%) |
| Regulatory Risk | Moderate (US tech sector regulations) | Moderate (US tech sector regulations) |
| Operational Risk | Moderate (Cloud transition & innovation demands) | Moderate (R&D intensity and tech changes) |
| Environmental Risk | Low (Software industry, limited direct impact) | Low (Software industry, limited direct impact) |
| Geopolitical Risk | Moderate (Global software market exposure) | Moderate (Global semiconductor design exposure) |
The most likely and impactful risks for both companies stem from market volatility and operational challenges tied to rapid innovation cycles. Autodesk’s higher beta indicates greater sensitivity to market swings. Both maintain manageable debt levels but face pressure from valuation metrics. Regulatory and geopolitical factors remain moderate but could influence tech sector dynamics broadly.
Which Stock to Choose?
Autodesk, Inc. (ADSK) shows a favorable income evolution with 12.7% revenue growth in 2025 and strong profitability metrics, including a 42.43% ROE and 18.14% net margin. Its debt level is moderate, with a 0.98 debt-to-equity ratio, and the overall rating is very favorable (B-), despite some unfavorable valuation ratios.
Cadence Design Systems, Inc. (CDNS) presents favorable income growth, notably 13.48% revenue increase in 2024 and robust profitability with a 22.58% ROE and 22.74% net margin. It maintains a healthier liquidity position and lower debt risk, reflected in a very favorable rating (B) and a stronger global financial ratios evaluation.
Considering ratings and financial evaluations, ADSK might appeal to investors seeking higher returns amid moderate risk, while CDNS could be more suitable for those valuing financial stability and liquidity. Both companies create value with declining ROIC trends but differ in risk and growth profiles.
Disclaimer: Investment carries a risk of loss of initial capital. The past performance is not a reliable indicator of future results. Be sure to understand risks before making an investment decision.
Go Further
I encourage you to read the complete analyses of Autodesk, Inc. and Cadence Design Systems, Inc. to enhance your investment decisions: