Choosing the right software company for your investment portfolio requires a keen understanding of market leaders. Autodesk, Inc. and Bentley Systems, Incorporated both operate in the application software industry, focusing on design and engineering solutions with overlapping infrastructure and construction sectors. Autodesk’s broad 3D design tools and Bentley’s specialized infrastructure software offer distinct innovation approaches. In this article, I will help you navigate their strengths to identify the most promising investment opportunity.

Table of contents
Companies Overview
I will begin the comparison between Autodesk, Inc. and Bentley Systems, Incorporated by providing an overview of these two companies and their main differences.
Autodesk Overview
Autodesk, Inc. is a leading provider of 3D design, engineering, and entertainment software and services worldwide. The company offers a broad portfolio including AutoCAD Civil 3D, BIM 360, Fusion 360, and industry-specific collections for architecture, engineering, construction, manufacturing, and media. Headquartered in San Rafael, California, Autodesk operates with 15,300 employees and has a market cap of $61.2B.
Bentley Systems Overview
Bentley Systems, Incorporated specializes in infrastructure engineering software solutions across multiple regions including the Americas, Europe, and Asia-Pacific. Its product suite features open modeling and simulation applications, project delivery systems, and asset performance tools tailored for civil, structural, geotechnical, and geospatial professionals. Bentley is based in Exton, Pennsylvania, employs 5,500 people, and holds a market cap of $11.1B.
Key similarities and differences
Both Autodesk and Bentley operate in the software application industry with a focus on engineering and design solutions. Autodesk has a larger market cap and employee base, providing a wider array of software products across multiple sectors including media and manufacturing. Bentley concentrates on infrastructure engineering and project delivery systems with a more specialized product lineup and smaller scale. Both companies serve engineering professionals but differ in geographic reach and product breadth.
Income Statement Comparison
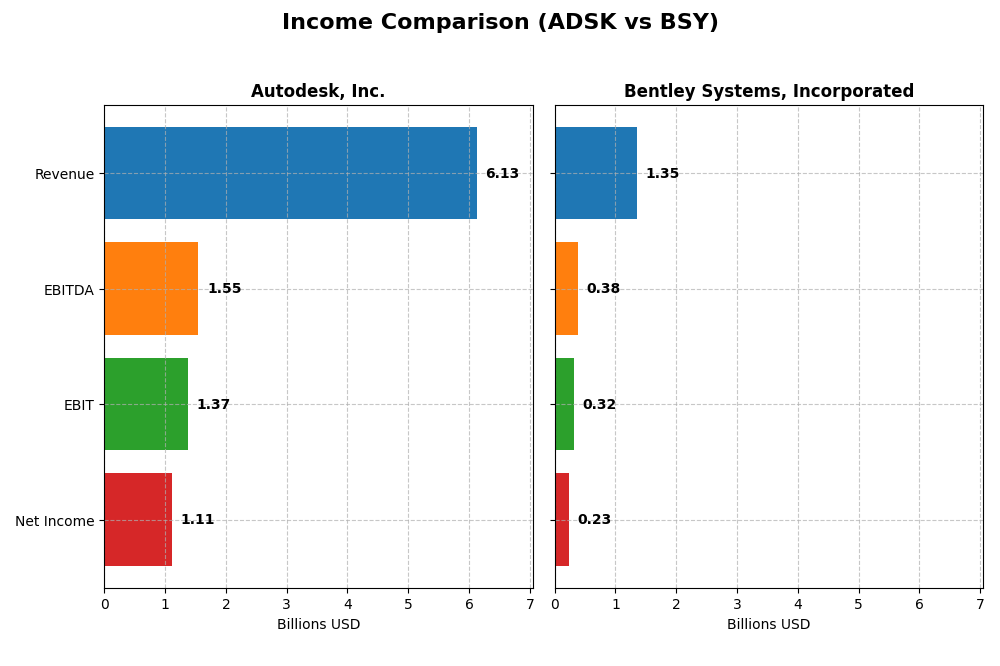
The table below provides a side-by-side comparison of key income statement metrics for Autodesk, Inc. and Bentley Systems, Incorporated for their most recent fiscal years.
| Metric | Autodesk, Inc. (ADSK) | Bentley Systems, Incorporated (BSY) |
|---|---|---|
| Market Cap | 61.2B | 11.1B |
| Revenue | 6.13B | 1.35B |
| EBITDA | 1.55B | 382M |
| EBIT | 1.37B | 318M |
| Net Income | 1.11B | 242M |
| EPS | 5.17 | 0.75 |
| Fiscal Year | 2025 | 2024 |
Income Statement Interpretations
Autodesk, Inc.
Autodesk’s revenue displayed a robust growth of 61.7% from 2021 to 2025, reaching $6.13B in 2025. Net income, however, declined by 7.95% over the same period to $1.11B. Margins remain strong with a gross margin of 90.6% and a net margin of 18.1%, both favorable. In 2025, revenue growth accelerated by 12.7%, accompanied by an 8.9% net margin improvement, indicating solid profitability enhancement.
Bentley Systems, Incorporated
Bentley’s revenue increased steadily by 68.8% from 2020 to 2024, reaching $1.35B. Net income rose significantly by 85.6% over the period to $242M. Gross margin stood at 81.0% and net margin at 17.4%, both favorable. The latest fiscal year showed a 10.2% revenue growth, but net margin declined by 34.8% and EPS fell by 28%, reflecting margin pressure despite higher top-line growth.
Which one has the stronger fundamentals?
Both companies show favorable income statement evaluations with strong revenue growth and solid gross and EBIT margins. Autodesk leads in margin levels and recent profitability improvements, while Bentley demonstrates superior net income and EPS growth over the overall period. However, Bentley’s recent deterioration in net margin and EPS contrasts with Autodesk’s margin improvements, presenting a mix of strengths and weaknesses for each firm’s fundamentals.
Financial Ratios Comparison
The table below presents a side-by-side comparison of key financial ratios for Autodesk, Inc. and Bentley Systems, Incorporated for their most recent fiscal years, reflecting operational efficiency, profitability, liquidity, and leverage metrics.
| Ratios | Autodesk, Inc. (2025) | Bentley Systems, Inc. (2024) |
|---|---|---|
| ROE | 42.4% | 22.6% |
| ROIC | 18.0% | 9.3% |
| P/E | 60.2 | 62.6 |
| P/B | 25.5 | 14.1 |
| Current Ratio | 0.68 | 0.54 |
| Quick Ratio | 0.68 | 0.54 |
| D/E (Debt-to-Equity) | 0.98 | 1.37 |
| Debt-to-Assets | 23.6% | 41.9% |
| Interest Coverage | 0 (not available) | 12.2 |
| Asset Turnover | 0.57 | 0.40 |
| Fixed Asset Turnover | 21.4 | 20.5 |
| Payout Ratio | 0% | 30.7% |
| Dividend Yield | 0% | 0.49% |
Interpretation of the Ratios
Autodesk, Inc.
Autodesk exhibits strong profitability with a net margin of 18.14% and an impressive return on equity at 42.43%, indicating efficient use of shareholder funds. However, concerns arise from its high price-to-earnings ratio of 60.2 and a low current ratio of 0.68, suggesting potential valuation and liquidity risks. Autodesk does not pay dividends, reflecting a reinvestment strategy likely focused on growth and innovation.
Bentley Systems, Incorporated
Bentley shows a favorable net margin of 17.35% and a solid return on equity at 22.55%, but its return on invested capital is neutral at 9.3%. The company faces challenges with a high debt-to-equity ratio of 1.37 and a low current ratio of 0.54, indicating leverage and liquidity concerns. Bentley pays a modest dividend with a yield of 0.49%, although the payout may be pressured by financial constraints.
Which one has the best ratios?
Autodesk’s ratios reveal stronger profitability and more favorable leverage and liquidity metrics compared to Bentley. Despite Autodesk’s high valuation multiples and lack of dividends, its overall financial health is more robust. Bentley presents more unfavorable ratios, particularly in debt management and liquidity, resulting in a slightly unfavorable overall evaluation.
Strategic Positioning
This section compares the strategic positioning of Autodesk, Inc. and Bentley Systems, Incorporated, focusing on Market position, Key segments, and Exposure to technological disruption:
Autodesk, Inc.
- Leading global software provider with strong market cap and higher competitive pressure.
- Diverse segments: Architecture, Engineering, Construction, Manufacturing, Media & Entertainment.
- Offers cloud-based construction management and advanced 3D design tools, adapting to tech changes.
Bentley Systems, Incorporated
- Mid-sized infrastructure software provider with moderate competitive pressure.
- Focused on infrastructure engineering software and project delivery solutions.
- Provides open modeling and simulation applications with collaboration systems for infrastructure.
Autodesk, Inc. vs Bentley Systems, Incorporated Positioning
Autodesk maintains a diversified business model across multiple industry verticals, offering broad software solutions, while Bentley concentrates on infrastructure engineering software. Autodesk’s larger scale supports wider market reach, whereas Bentley’s focus targets specialized infrastructure needs.
Which has the best competitive advantage?
Autodesk shows a slightly favorable moat by creating value with ROIC above WACC, despite declining profitability. Bentley’s slightly unfavorable moat reflects value shedding and declining profitability, indicating weaker competitive advantage based on current MOAT evaluations.
Stock Comparison
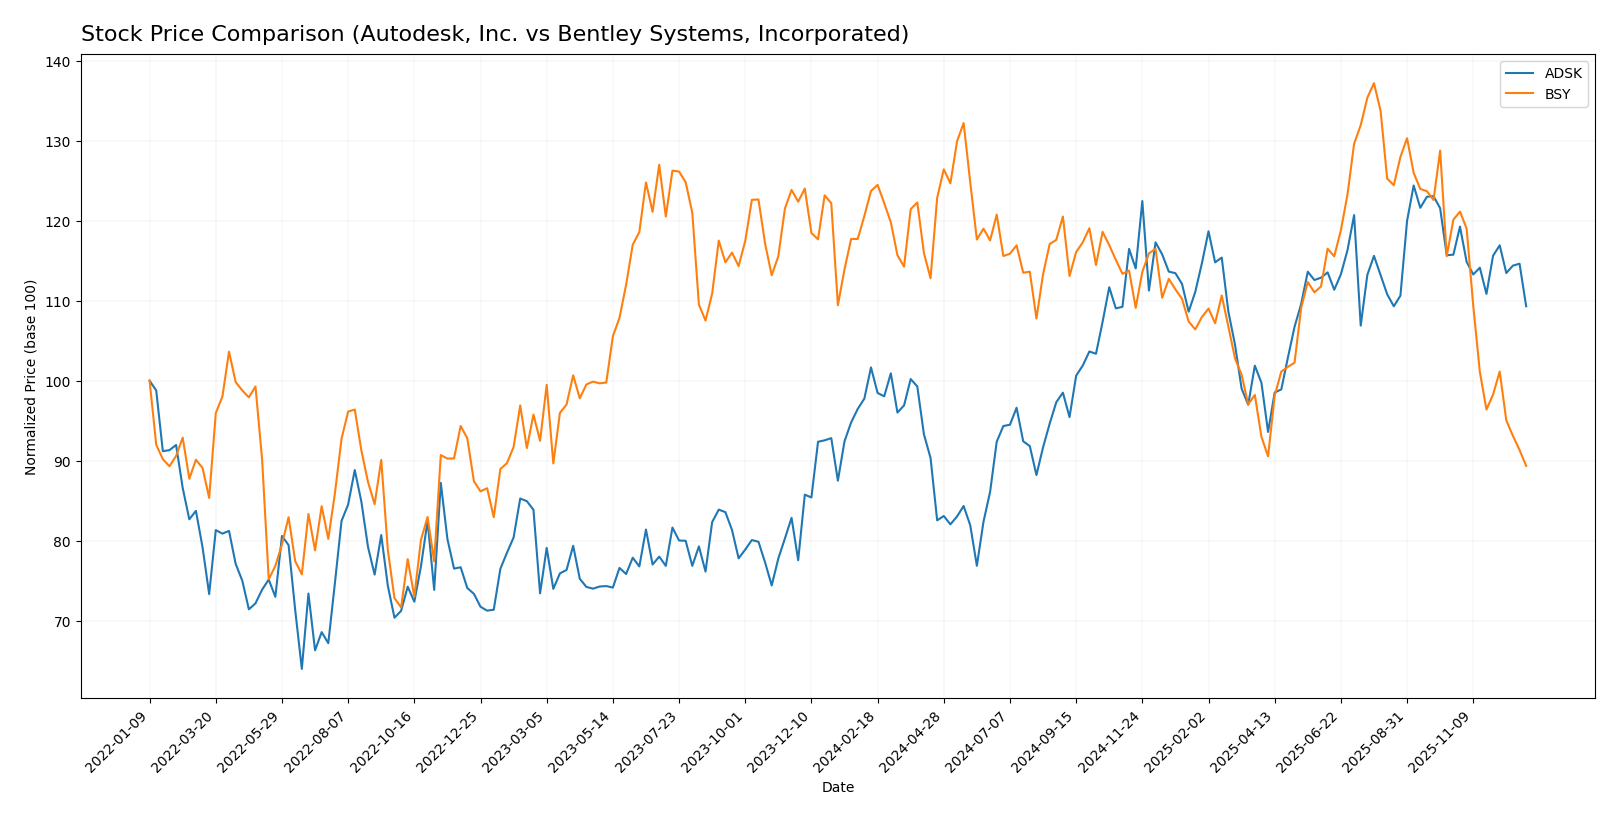
The stock price chart highlights Autodesk, Inc.’s steady bullish momentum over the past year with a 7.52% gain, contrasting with Bentley Systems, Incorporated’s notable bearish trend marked by a 27.79% decline.
Trend Analysis
Autodesk, Inc. experienced a 7.52% price increase over the past 12 months, indicating a bullish trend with decelerating momentum and a high volatility level reflected by a 29.92 std deviation. Recent months show a short-term correction with a -5.58% decline.
Bentley Systems, Incorporated faced a sharp 27.79% decline over the past year, confirming a bearish trend with decelerating downside momentum and lower volatility at a 4.48 std deviation. Recent performance worsened with a -25.63% drop.
Comparing both stocks, Autodesk, Inc. has delivered significantly stronger market performance over the last 12 months, maintaining a positive trend while Bentley Systems, Incorporated encountered steep losses.
Target Prices
The current analyst consensus presents a positive outlook for both Autodesk, Inc. and Bentley Systems, Incorporated.
| Company | Target High | Target Low | Consensus |
|---|---|---|---|
| Autodesk, Inc. | 400 | 343 | 372.88 |
| Bentley Systems, Inc. | 64 | 57 | 60.5 |
Analysts expect Autodesk’s stock to appreciate significantly from its current price of $286.73, while Bentley Systems shows upside potential from $38.15, reflecting optimistic growth prospects.
Analyst Opinions Comparison
This section compares analysts’ ratings and grades for Autodesk, Inc. and Bentley Systems, Incorporated:
Rating Comparison
Autodesk, Inc. Rating
- Rating: B- with a very favorable overall evaluation.
- Discounted Cash Flow Score: Moderate at 3.
- ROE Score: Very favorable at 5.
- ROA Score: Favorable at 4.
- Debt To Equity Score: Very unfavorable at 1.
- Overall Score: Moderate at 3.
Bentley Systems, Incorporated Rating
- Rating: B- with a very favorable overall evaluation.
- Discounted Cash Flow Score: Favorable at 4.
- ROE Score: Favorable at 4.
- ROA Score: Favorable at 4.
- Debt To Equity Score: Very unfavorable at 1.
- Overall Score: Moderate at 3.
Which one is the best rated?
Both companies share the same overall rating of B- and overall score of 3. Autodesk has a stronger ROE score, while Bentley scores higher on discounted cash flow. Both show very unfavorable debt-to-equity scores, resulting in closely matched ratings.
Scores Comparison
Here is a comparison of the financial scores for Autodesk and Bentley Systems:
ADSK Scores
- Altman Z-Score: 5.45, indicating a safe zone with low bankruptcy risk.
- Piotroski Score: 8, classified as very strong financial health.
BSY Scores
- Altman Z-Score: 4.37, also in the safe zone, showing low bankruptcy risk.
- Piotroski Score: 9, indicating very strong financial health.
Which company has the best scores?
Both Autodesk and Bentley Systems are in the Altman Z-Score safe zone, but Autodesk has a higher Z-Score. Bentley has a slightly stronger Piotroski Score of 9 versus Autodesk’s 8, showing marginally better financial strength.
Grades Comparison
Here is a comparison of the latest available grades for Autodesk, Inc. and Bentley Systems, Incorporated:
Autodesk, Inc. Grades
The table below lists recent grades and actions from major grading firms for Autodesk, Inc.
| Grading Company | Action | New Grade | Date |
|---|---|---|---|
| Barclays | Maintain | Overweight | 2025-11-26 |
| BMO Capital | Maintain | Market Perform | 2025-11-26 |
| Wells Fargo | Maintain | Overweight | 2025-11-26 |
| Deutsche Bank | Upgrade | Buy | 2025-11-26 |
| Rosenblatt | Maintain | Buy | 2025-11-26 |
| Macquarie | Maintain | Outperform | 2025-11-26 |
| Baird | Maintain | Outperform | 2025-11-26 |
| B of A Securities | Maintain | Neutral | 2025-11-26 |
| Rosenblatt | Maintain | Buy | 2025-11-24 |
| Baird | Maintain | Outperform | 2025-11-18 |
Overall, Autodesk’s grades predominantly indicate positive sentiment, with multiple “Outperform,” “Buy,” and “Overweight” ratings, and only a few neutral ratings.
Bentley Systems, Incorporated Grades
The table below shows recent grades and actions from recognized grading companies for Bentley Systems, Incorporated.
| Grading Company | Action | New Grade | Date |
|---|---|---|---|
| Baird | Maintain | Outperform | 2025-11-06 |
| Piper Sandler | Maintain | Overweight | 2025-11-06 |
| JP Morgan | Maintain | Neutral | 2025-11-06 |
| Rosenblatt | Maintain | Buy | 2025-11-06 |
| Rosenblatt | Upgrade | Buy | 2025-10-17 |
| Goldman Sachs | Maintain | Sell | 2025-08-07 |
| Rosenblatt | Downgrade | Neutral | 2025-08-07 |
| Piper Sandler | Maintain | Overweight | 2025-08-07 |
| UBS | Maintain | Neutral | 2025-08-07 |
| Oppenheimer | Maintain | Outperform | 2025-08-07 |
Bentley’s ratings show a mix of positive and neutral grades, with one notable “Sell” rating from Goldman Sachs but several “Outperform,” “Buy,” and “Overweight” grades maintained.
Which company has the best grades?
Autodesk, Inc. generally has stronger and more consistent positive grades, including recent upgrades and multiple “Outperform” and “Buy” ratings. Bentley Systems, while having good ratings, includes a “Sell” rating and more neutral grades. Investors may interpret Autodesk’s grades as reflecting greater analyst confidence, which could influence portfolio decisions.
Strengths and Weaknesses
Below is a comparative overview of key strengths and weaknesses for Autodesk, Inc. (ADSK) and Bentley Systems, Incorporated (BSY) based on the latest financial and operational data.
| Criterion | Autodesk, Inc. (ADSK) | Bentley Systems, Inc. (BSY) |
|---|---|---|
| Diversification | Highly diversified across Architecture, Engineering & Construction (3B), AutoCAD (1.57B), Manufacturing (1.19B), and Media sectors | Moderate diversification, mainly focused on subscriptions and licenses (1.27B), with smaller service and perpetual license segments |
| Profitability | Strong profitability with 18.14% net margin and 42.43% ROE; ROIC at 18.01%, though showing declining trend | Good profitability with 17.35% net margin and 22.55% ROE; ROIC moderate at 9.3% and also declining |
| Innovation | High innovation reflected in strong fixed asset turnover (21.44) and continuous product development | Innovation moderate with good fixed asset turnover (20.47) but slower asset turnover overall |
| Global presence | Extensive global footprint with large revenue base and product penetration | Global presence focused on enterprise software with growing subscription services |
| Market Share | Leading market share in CAD and AEC software segments | Smaller market share but niche positioning in engineering software subscriptions |
In summary, Autodesk demonstrates robust diversification and profitability, although its profitability trend is declining. Bentley shows moderate strengths but struggles with ROIC below WACC and more limited diversification. Investors should weigh Autodesk’s scale and innovation against Bentley’s niche focus and current profitability challenges.
Risk Analysis
Below is a comparative table of key risk metrics for Autodesk, Inc. (ADSK) and Bentley Systems, Incorporated (BSY) based on the most recent fiscal data.
| Metric | Autodesk, Inc. (ADSK) | Bentley Systems, Inc. (BSY) |
|---|---|---|
| Market Risk (Beta) | 1.475 (higher volatility) | 1.231 (moderate volatility) |
| Debt Level (Debt/Equity) | 0.98 (neutral) | 1.37 (unfavorable, higher leverage) |
| Regulatory Risk | Moderate (US tech sector) | Moderate (global infrastructure software) |
| Operational Risk | Moderate (complex software ecosystem) | Moderate (infrastructure project delivery reliance) |
| Environmental Risk | Low (software focus, minimal direct impact) | Low (software solutions, indirect exposure) |
| Geopolitical Risk | Moderate (global sales but US-based) | Moderate to high (global operations including volatile regions) |
Synthesis: The most impactful risks are market volatility and debt levels. Autodesk’s higher beta exposes it to more market swings, while Bentley’s elevated debt ratio increases financial risk. Both face moderate operational and geopolitical risks due to their international presence and industry sectors. Caution is advised especially regarding Bentley’s leverage and Autodesk’s valuation multiples.
Which Stock to Choose?
Autodesk, Inc. (ADSK) shows favorable income evolution with strong revenue growth of 12.7% in the last year and solid profitability margins. Its financial ratios indicate high returns on equity (42.43%) and invested capital (18.01%), though some valuation metrics and liquidity ratios are unfavorable. Debt levels are moderate with a net debt to EBITDA near 0.62. The company holds a very favorable overall rating.
Bentley Systems, Incorporated (BSY) presents a positive income trend with a 10.15% revenue increase last year and good profitability metrics, including a 17.35% net margin. Financial ratios are mixed, with decent returns on equity (22.55%) but higher debt levels (net debt to EBITDA around 3.6) and several unfavorable valuation and liquidity ratios. The overall rating is very favorable but slightly less strong than ADSK.
For investors prioritizing growth and high profitability, Autodesk’s higher returns and favorable income trends might appear more attractive. Conversely, those accepting higher leverage and seeking steady income growth may find Bentley’s profile suitable. The contrast in financial strength and valuation suggests a choice depending on risk tolerance and investment strategy.
Disclaimer: Investment carries a risk of loss of initial capital. The past performance is not a reliable indicator of future results. Be sure to understand risks before making an investment decision.
Go Further
I encourage you to read the complete analyses of Autodesk, Inc. and Bentley Systems, Incorporated to enhance your investment decisions: