In the fast-evolving Communication Equipment sector, Motorola Solutions, Inc. (MSI) and AudioCodes Ltd. (AUDC) stand out with distinct market approaches and innovation strategies. Motorola focuses on mission-critical communications and video security, while AudioCodes excels in unified communications and VoiceAI solutions. This comparison highlights their competitive positions and growth potential, helping you identify the most compelling investment opportunity in this dynamic industry. Let’s explore which company deserves a place in your portfolio.

Table of contents
Companies Overview
I will begin the comparison between Motorola Solutions and AudioCodes by providing an overview of these two companies and their main differences.
Motorola Solutions Overview
Motorola Solutions, Inc. provides mission critical communications and analytics globally, focusing on government, public safety, and commercial customers. Its operations are divided into Products and Systems Integration, plus Software and Services. The company offers a wide portfolio including infrastructure, devices, video security, and software solutions for private communications networks and mobile workforce management. Founded in 1928, it is headquartered in Chicago, Illinois, and trades on the NYSE with a market cap of $65.1B.
AudioCodes Overview
AudioCodes Ltd. specializes in advanced communications software and productivity solutions for the digital workplace, with a focus on unified communications, contact centers, and VoiceAI. Its offerings include session border controllers, VoIP routing solutions, and Microsoft Teams integrations. The company markets mainly to telecommunications and networking industries globally. Incorporated in 1992 and headquartered in Lod, Israel, AudioCodes trades on NASDAQ with a market cap of $257M.
Key similarities and differences
Both companies operate in the communication equipment industry and provide solutions that enhance voice and data communications. Motorola Solutions emphasizes mission critical communications and public safety infrastructure, while AudioCodes focuses on software and services for unified communications and VoIP networks. Motorola Solutions has a significantly larger market capitalization and employee base, reflecting its broader scope and global reach compared to the more specialized and smaller-scale AudioCodes.
Income Statement Comparison
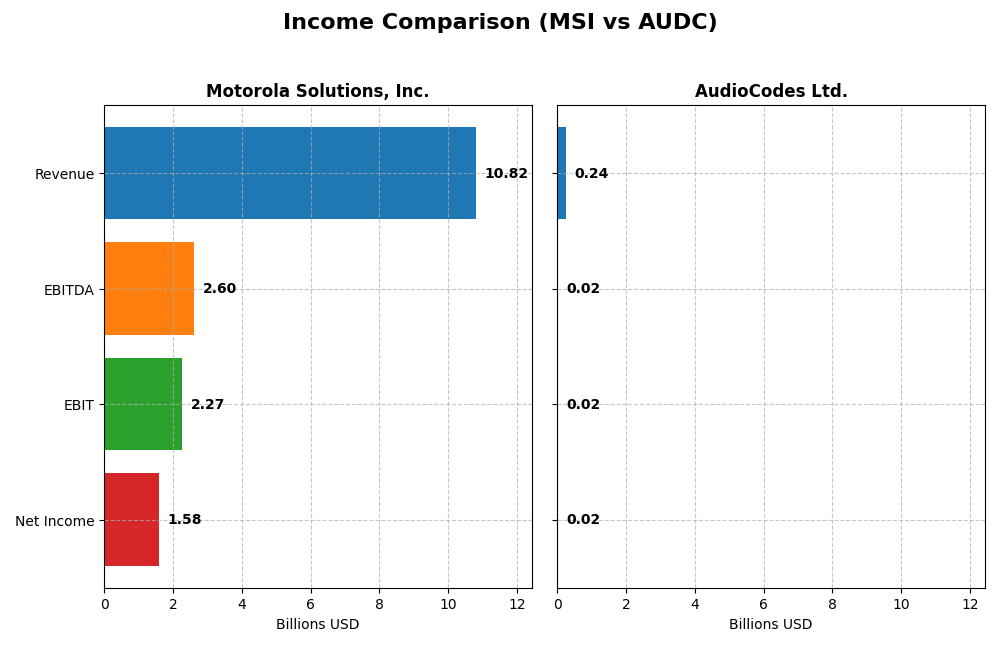
This table presents a side-by-side comparison of key income statement metrics for Motorola Solutions, Inc. and AudioCodes Ltd. for the fiscal year 2024.
| Metric | Motorola Solutions, Inc. | AudioCodes Ltd. |
|---|---|---|
| Market Cap | 65.1B | 257M |
| Revenue | 10.8B | 242M |
| EBITDA | 2.6B | 21M |
| EBIT | 2.3B | 17M |
| Net Income | 1.58B | 15.3M |
| EPS | 9.45 | 0.51 |
| Fiscal Year | 2024 | 2024 |
Income Statement Interpretations
Motorola Solutions, Inc.
Motorola Solutions exhibited consistent growth from 2020 to 2024, with revenue rising from $7.41B to $10.82B and net income increasing from $949M to $1.58B. Margins remained strong, with a gross margin near 51% and a favorable net margin at 14.58%. In 2024, revenue and gross profit grew notably, although EBIT and net margin slightly declined, reflecting some margin pressure.
AudioCodes Ltd.
AudioCodes showed moderate revenue growth overall, from $220M in 2020 to $242M in 2024, but net income fell significantly from $27M to $15M. The gross margin was high at 65%, yet EBIT margin was neutral at 7.1%, and net margin stood at 6.32%. In 2024, revenue slightly declined, but net margin and EPS improved sharply, indicating recent profitability gains despite longer-term challenges.
Which one has the stronger fundamentals?
Motorola Solutions demonstrates stronger fundamentals with robust revenue and net income growth, favorable margins, and resilience over the five-year period. AudioCodes, while showing a solid gross margin and recent margin improvements, struggles with declining net income and less consistent revenue growth. Overall, Motorola Solutions presents a more favorable income statement profile based on the available financial data.
Financial Ratios Comparison
This table presents the most recent key financial ratios for Motorola Solutions, Inc. and AudioCodes Ltd., enabling a clear comparison of their financial performance and stability as of fiscal year 2024.
| Ratios | Motorola Solutions, Inc. (MSI) | AudioCodes Ltd. (AUDC) |
|---|---|---|
| ROE | 92.6% | 7.98% |
| ROIC | 21.6% | 6.51% |
| P/E | 48.9 | 19.2 |
| P/B | 45.3 | 1.53 |
| Current Ratio | 1.28 | 2.09 |
| Quick Ratio | 1.13 | 1.69 |
| D/E (Debt-to-Equity) | 3.85 | 0.19 |
| Debt-to-Assets | 44.9% | 10.9% |
| Interest Coverage | 9.11 | 58.1 |
| Asset Turnover | 0.74 | 0.72 |
| Fixed Asset Turnover | 6.97 | 4.05 |
| Payout ratio | 41.5% | 71.2% |
| Dividend yield | 0.85% | 3.70% |
Interpretation of the Ratios
Motorola Solutions, Inc.
Motorola Solutions shows mostly favorable profitability ratios, including a strong net margin of 14.58% and an impressive ROE at 92.6%, indicating efficient equity use. However, valuation metrics like P/E at 48.89 and P/B at 45.27 are unfavorable, suggesting the stock may be overvalued. The company pays dividends with a low yield of 0.85%, which could concern income-focused investors.
AudioCodes Ltd.
AudioCodes presents a balanced ratio profile with favorable liquidity and solvency ratios, such as a current ratio of 2.09 and low debt-to-equity at 0.19. Profitability ratios like ROE at 7.98% are unfavorable, reflecting modest returns. AudioCodes pays dividends with a 3.7% yield, supported by solid interest coverage, indicating reasonable distribution sustainability.
Which one has the best ratios?
Both companies have a slightly favorable overall ratio evaluation, but AudioCodes scores better on liquidity, solvency, and dividend yield metrics. Motorola Solutions excels in profitability but faces concerns over high valuation and leverage. The choice depends on prioritizing returns or financial stability, as neither company dominates across all ratio categories.
Strategic Positioning
This section compares the strategic positioning of Motorola Solutions, Inc. and AudioCodes Ltd., including Market position, Key segments, and exposure to technological disruption:
Motorola Solutions, Inc.
- Leading market position in communication equipment with significant scale and moderate competitive pressure.
- Diversified segments: Products and Systems Integration, Software and Services, serving government, public safety, and commercial sectors.
- Exposure to disruption moderate, with focus on mission critical communications and software updates including cybersecurity.
AudioCodes Ltd.
- Smaller market cap, operating in communication equipment with niche focus and competitive pressures.
- Concentrated on advanced communications software and products for unified communications, contact centers, and service providers.
- Facing technological disruption risks in VoIP and unified communications platforms, with continual innovation in VoiceAI and cloud services.
Motorola Solutions, Inc. vs AudioCodes Ltd. Positioning
Motorola Solutions exhibits a diversified strategy across hardware, software, and services targeting broad sectors including government and commercial clients, while AudioCodes focuses on specialized communications software and unified communications solutions, reflecting a more concentrated approach with narrower market segments.
Which has the best competitive advantage?
Motorola Solutions demonstrates a very favorable moat with growing ROIC, indicating a durable competitive advantage and increasing profitability, whereas AudioCodes shows a very unfavorable moat with declining ROIC, suggesting value destruction and weaker competitive positioning.
Stock Comparison
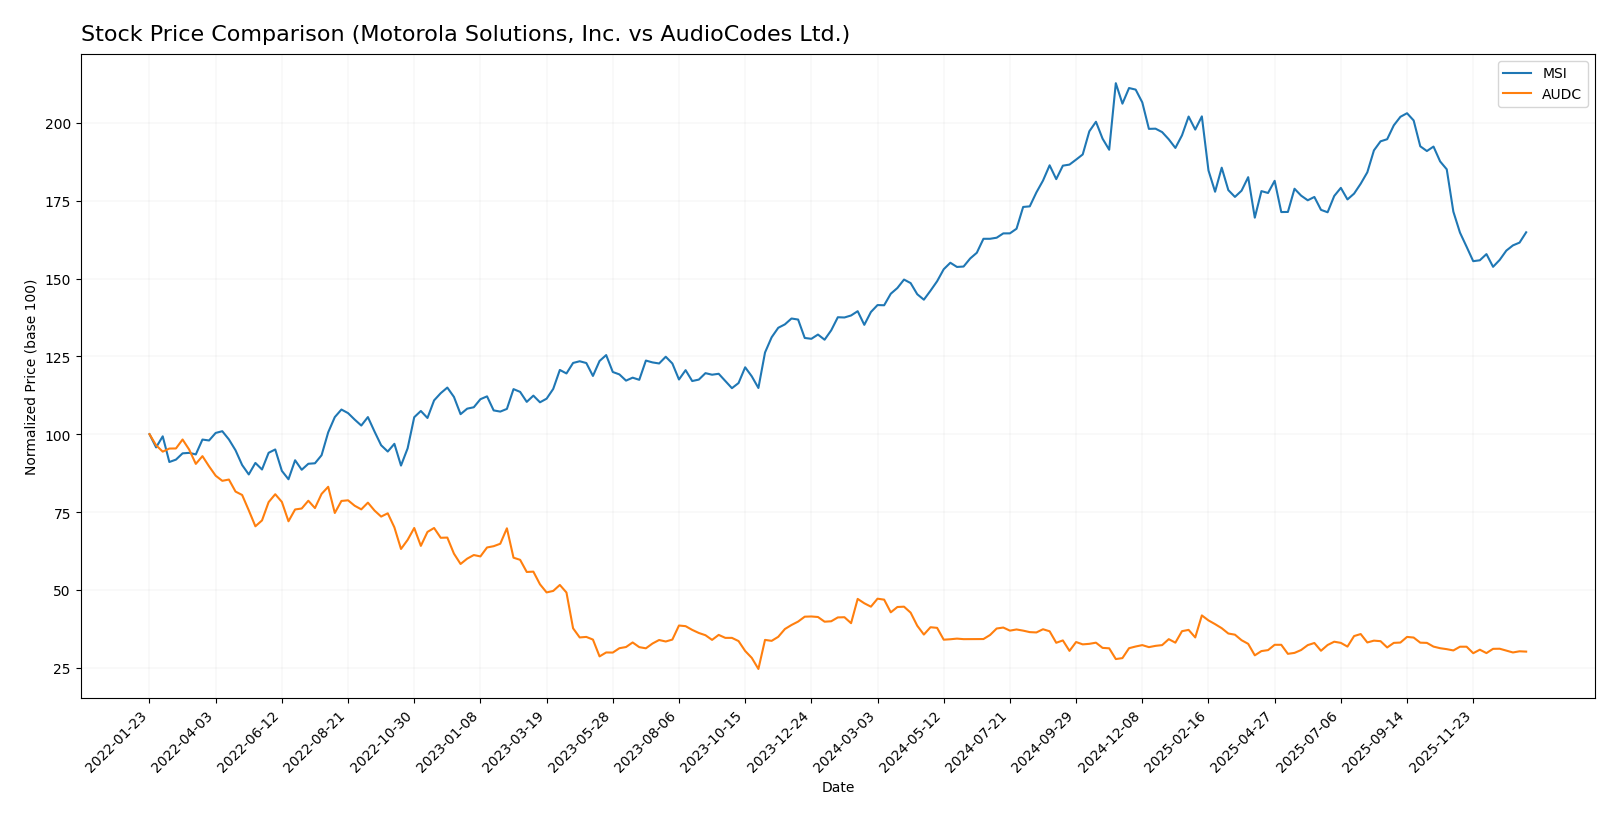
The stock price dynamics over the past 12 months reveal a clear contrast: Motorola Solutions, Inc. (MSI) exhibited a strong bullish trend with significant price appreciation, while AudioCodes Ltd. (AUDC) faced a pronounced bearish decline amid lower volatility and volume contraction.
Trend Analysis
Motorola Solutions, Inc. (MSI) showed an 18.39% price increase over the past year, indicating a bullish trend with deceleration in momentum and notable volatility (std deviation 44.18). The stock peaked at 504.6 and bottomed at 330.27.
AudioCodes Ltd. (AUDC) experienced a -32.36% price decrease over the same period, confirming a bearish trend with accelerating downward momentum and low volatility (std deviation 1.16). The price ranged between 8.12 and 13.79.
Comparatively, MSI outperformed AUDC in market performance, delivering positive returns versus AUDC’s significant losses across the analyzed year.
Target Prices
The current analyst consensus suggests a moderate upside potential for both Motorola Solutions, Inc. and AudioCodes Ltd.
| Company | Target High | Target Low | Consensus |
|---|---|---|---|
| Motorola Solutions, Inc. | 525 | 436 | 469.8 |
| AudioCodes Ltd. | 24 | 14 | 19 |
Motorola Solutions’ target consensus at 469.8 USD is significantly above its current price of 391 USD, indicating expected growth. AudioCodes shows a consensus target of 19 USD, more than double its current price of 8.82 USD, reflecting bullish analyst sentiment.
Analyst Opinions Comparison
This section compares analysts’ ratings and grades for Motorola Solutions, Inc. (MSI) and AudioCodes Ltd. (AUDC):
Rating Comparison
MSI Rating
- Rating: B+, considered Very Favorable by analysts.
- Discounted Cash Flow Score: 4, rated Favorable for valuation perspective.
- ROE Score: 5, Very Favorable, indicating strong profit generation efficiency.
- ROA Score: 5, Very Favorable, showing excellent asset utilization.
- Debt To Equity Score: 1, Very Unfavorable, indicating higher financial risk.
- Overall Score: 3, Moderate overall financial standing.
AUDC Rating
- Rating: A-, considered Very Favorable by analysts.
- Discounted Cash Flow Score: 4, rated Favorable for valuation perspective.
- ROE Score: 3, Moderate, indicating average profit generation efficiency.
- ROA Score: 3, Moderate, showing average asset utilization.
- Debt To Equity Score: 3, Moderate, indicating balanced financial risk.
- Overall Score: 4, Favorable overall financial standing.
Which one is the best rated?
Based strictly on the provided data, AUDC holds a higher overall rating (A- vs. B+) and a better overall score (4 vs. 3) compared to MSI. However, MSI outperforms in ROE and ROA scores but has a weaker debt-to-equity profile.
Scores Comparison
Here is a comparison of the key financial scores for Motorola Solutions, Inc. and AudioCodes Ltd.:
MSI Scores
- Altman Z-Score: 3.65, indicating a safe zone with low bankruptcy risk.
- Piotroski Score: 5, representing average financial strength.
AUDC Scores
- Altman Z-Score: 2.19, in the grey zone, indicating moderate bankruptcy risk.
- Piotroski Score: 7, indicating strong financial health.
Which company has the best scores?
Based on the provided data, MSI has a better Altman Z-Score indicating lower bankruptcy risk, while AUDC shows a stronger Piotroski Score reflecting better financial health. Each company leads in one key score.
Grades Comparison
The following section compares the recent grades assigned to Motorola Solutions, Inc. and AudioCodes Ltd.:
Motorola Solutions, Inc. Grades
Here are the latest grades from leading financial institutions for Motorola Solutions, Inc.:
| Grading Company | Action | New Grade | Date |
|---|---|---|---|
| Piper Sandler | Upgrade | Overweight | 2026-01-05 |
| Morgan Stanley | Upgrade | Overweight | 2025-12-17 |
| Barclays | Maintain | Overweight | 2025-10-31 |
| Piper Sandler | Maintain | Neutral | 2025-10-31 |
| Evercore ISI Group | Maintain | Outperform | 2025-08-29 |
| Barclays | Maintain | Overweight | 2025-08-08 |
| UBS | Maintain | Buy | 2025-08-08 |
| Barclays | Maintain | Overweight | 2025-05-05 |
| JP Morgan | Maintain | Overweight | 2025-04-17 |
| Barclays | Maintain | Overweight | 2025-02-14 |
Motorola Solutions shows a predominantly positive and stable grading trend, with multiple institutions rating it as Overweight or Buy.
AudioCodes Ltd. Grades
Below are recent grades from recognized financial firms for AudioCodes Ltd.:
| Grading Company | Action | New Grade | Date |
|---|---|---|---|
| Needham | Maintain | Buy | 2025-05-07 |
| Needham | Maintain | Buy | 2025-02-05 |
| Barclays | Maintain | Underweight | 2025-02-05 |
| Needham | Maintain | Buy | 2025-01-21 |
| Barclays | Maintain | Underweight | 2024-11-07 |
| Needham | Maintain | Buy | 2024-11-07 |
| Needham | Maintain | Buy | 2024-07-31 |
| Needham | Maintain | Buy | 2024-05-09 |
| Barclays | Maintain | Underweight | 2024-05-08 |
| Barclays | Maintain | Underweight | 2024-02-07 |
AudioCodes displays a mixed grading pattern, with Needham consistently assigning Buy ratings, while Barclays maintains an Underweight stance.
Which company has the best grades?
Motorola Solutions, Inc. has received stronger and more consistent positive grades, with a majority rated Overweight or Buy, compared to AudioCodes Ltd.’s mixed Buy and Underweight ratings. This divergence may influence investor perceptions of growth and risk profiles between the two.
Strengths and Weaknesses
Below is a comparison of key strengths and weaknesses for Motorola Solutions, Inc. (MSI) and AudioCodes Ltd. (AUDC) based on the most recent data.
| Criterion | Motorola Solutions, Inc. (MSI) | AudioCodes Ltd. (AUDC) |
|---|---|---|
| Diversification | Strong product and service revenue streams, $6.45B product and $4.36B service in 2024 | Moderate diversification with products $112M and services $130M in 2024 |
| Profitability | High profitability: net margin 14.58%, ROIC 21.59%, ROE 92.6% | Moderate profitability: net margin 6.32%, ROIC 6.51%, ROE 7.98% |
| Innovation | Very favorable economic moat with growing ROIC (+44.7%) indicating strong competitive advantage | Very unfavorable moat with declining ROIC (-37.5%) signaling challenges in value creation |
| Global presence | Extensive global footprint supporting large government and enterprise sectors | Smaller scale with less global reach, focused on networking and technology segments |
| Market Share | Large market share supported by high revenues and durable competitive advantage | Smaller market share with lower revenue and profitability metrics |
Key takeaways: MSI shows robust diversification, strong profitability, and a durable competitive advantage with growing returns on capital. AUDC faces challenges with declining profitability and value destruction, though it maintains solid liquidity and low debt. Investors should weigh MSI’s stability against AUDC’s higher risk profile.
Risk Analysis
Below is a comparison table highlighting key risk factors for Motorola Solutions, Inc. (MSI) and AudioCodes Ltd. (AUDC) based on the most recent 2024 data:
| Metric | Motorola Solutions, Inc. (MSI) | AudioCodes Ltd. (AUDC) |
|---|---|---|
| Market Risk | Moderate (Beta 1.005) | Moderate (Beta 1.052) |
| Debt level | High (D/E 3.85, Debt to Assets 44.9%) | Low (D/E 0.19, Debt to Assets 10.9%) |
| Regulatory Risk | Moderate (Global operations, public safety sector) | Moderate (Telecom regulations in multiple regions) |
| Operational Risk | Moderate (Complex integration and software services) | Moderate (Dependence on telecom service providers) |
| Environmental Risk | Low (Technology sector, no heavy industry) | Low (Technology sector) |
| Geopolitical Risk | Moderate (US, UK, Canada, international exposure) | Moderate to High (Israeli base, global telecom markets) |
Synthesis: The most impactful risk for MSI is its high debt level, which could pressure financial flexibility despite strong profitability. AUDC shows a safer debt profile but faces geopolitical risks due to its Israeli headquarters and exposure to diverse telecom regulation. Both companies have moderate market and operational risks, with stable environmental risk profiles. Investors should monitor debt management for MSI and geopolitical developments for AUDC.
Which Stock to Choose?
Motorola Solutions, Inc. (MSI) shows favorable income growth with a 45.9% revenue increase over five years and a strong profitability profile, including a 14.58% net margin and a 92.6% ROE. Its debt level is relatively high, reflected by an unfavorable debt-to-equity ratio, but the company maintains a very favorable overall rating and a very favorable moat due to growing ROIC exceeding WACC.
AudioCodes Ltd. (AUDC) has mixed income trends with a modest 9.7% revenue growth over five years but a notable net income decline of 43.8%. Profitability metrics are moderate with a 6.32% net margin and 7.98% ROE, supported by low debt levels and favorable liquidity ratios. The company holds a very favorable rating overall, though its moat evaluation is very unfavorable due to declining ROIC below WACC.
For investors prioritizing durable competitive advantages and consistent value creation, MSI’s strong moat and favorable income growth might appear more attractive. Conversely, AUDC could be seen as suitable for those favoring lower leverage and moderate profitability despite its weaker economic moat, depending on risk tolerance and investment strategy.
Disclaimer: Investment carries a risk of loss of initial capital. The past performance is not a reliable indicator of future results. Be sure to understand risks before making an investment decision.
Go Further
I encourage you to read the complete analyses of Motorola Solutions, Inc. and AudioCodes Ltd. to enhance your investment decisions: