Xylem Inc. and ATS Corporation are two key players in the industrial machinery sector, each driving innovation in their specialized fields. Xylem focuses on advanced water technology solutions, while ATS excels in automation systems for diverse industries. Their market overlap and commitment to technological advancement make them compelling subjects for comparison. In this article, I will help you decide which company holds the most potential for your investment portfolio.
Table of contents
Companies Overview
I will begin the comparison between Xylem Inc. and ATS Corporation by providing an overview of these two companies and their main differences.
Xylem Inc. Overview
Xylem Inc. focuses on designing, manufacturing, and servicing engineered products and solutions for water and wastewater applications globally. Operating through segments such as Water Infrastructure, Applied Water, and Measurement & Control Solutions, Xylem offers a broad portfolio ranging from pumps and filtration systems to smart meters and cloud-based analytics. Headquartered in New York, Xylem is a key player in industrial machinery with a market cap of 34B USD.
ATS Corporation Overview
ATS Corporation provides automation solutions worldwide, including planning, designing, building, and servicing automated manufacturing and assembly systems. Its offerings cover pre- and post-automation services, contract manufacturing, engineering design, software development, and connected factory floor management systems. Based in Canada, ATS serves diverse sectors like life sciences, transportation, and energy, with a market cap of 2.8B USD.
Key similarities and differences
Both Xylem and ATS operate in the industrial machinery sector, focusing on engineered solutions and services. Xylem specializes in water-related infrastructure and technology, while ATS concentrates on automation and manufacturing systems across various industries. Xylem’s product range emphasizes water management technologies, whereas ATS provides comprehensive automation services, including software and digital factory solutions. Their geographic bases and market capitalizations also differ significantly.
Income Statement Comparison
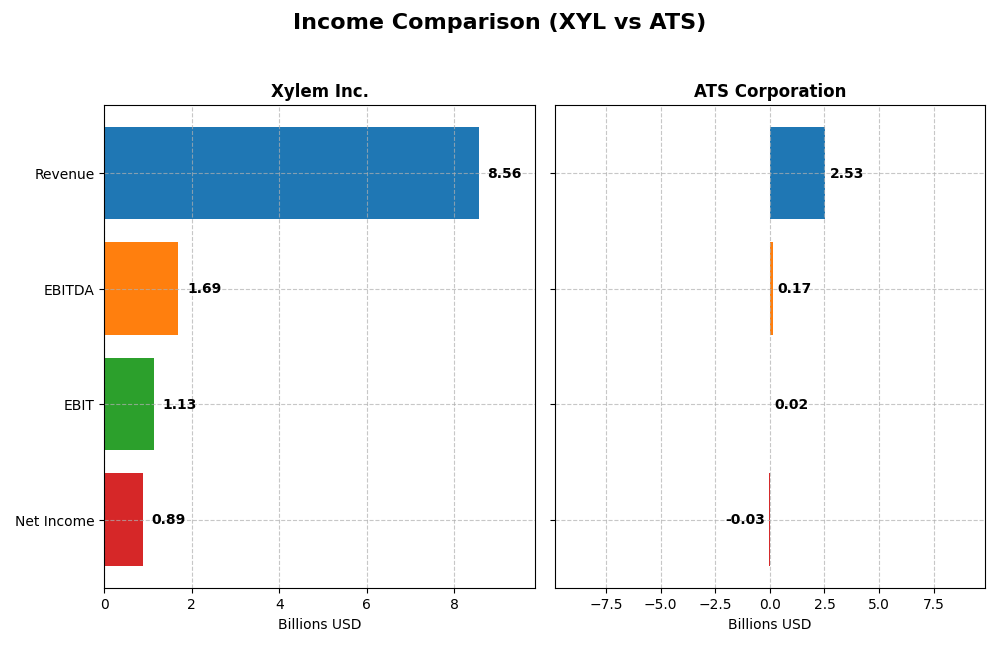
The table below provides a side-by-side comparison of the most recent fiscal year income statement metrics for Xylem Inc. and ATS Corporation, highlighting key financial results.
| Metric | Xylem Inc. (2024) | ATS Corporation (2025) |
|---|---|---|
| Market Cap | 34.0B USD | 2.8B CAD |
| Revenue | 8.56B USD | 2.53B CAD |
| EBITDA | 1.69B USD | 168M CAD |
| EBIT | 1.13B USD | 15.3M CAD |
| Net Income | 890M USD | -28.0M CAD |
| EPS | 3.67 USD | -0.29 CAD |
| Fiscal Year | 2024 | 2025 |
Income Statement Interpretations
Xylem Inc.
Xylem Inc. has shown robust revenue growth, rising from $4.88B in 2020 to $8.56B in 2024, with net income surging from $254M to $890M. Margins improved steadily, with gross margin at 37.51% and net margin at 10.39% in 2024. The latest year marked strong growth acceleration, with net income up 46% from 2023, reflecting enhanced profitability and operational efficiency.
ATS Corporation
ATS Corporation’s revenue grew overall from CAD 1.43B in 2021 to CAD 2.53B in 2025, but net income declined, sliding into a net loss of CAD 28M in 2025 from a profit of CAD 194M in 2024. Margins weakened, with a gross margin of 25.53% and a negative net margin of -1.11% in 2025. The recent year showed a sharp downturn with a 16% revenue drop and a deep net loss, signaling operational challenges.
Which one has the stronger fundamentals?
Xylem demonstrates stronger fundamentals with consistent revenue and net income growth, favorable margin improvements, and a positive income statement outlook. In contrast, ATS faces profitability pressures, declining net income, and unfavorable margin trends despite revenue growth over the period. The divergent trajectories highlight Xylem’s more resilient income statement profile relative to ATS.
Financial Ratios Comparison
The table below presents a side-by-side comparison of key financial ratios for Xylem Inc. (XYL) and ATS Corporation (ATS) based on their most recent fiscal year data.
| Ratios | Xylem Inc. (XYL) 2024 | ATS Corporation (ATS) 2025 |
|---|---|---|
| ROE | 8.36% | -1.64% |
| ROIC | 5.78% | 0.09% |
| P/E | 31.63 | -125.28 |
| P/B | 2.64 | 2.06 |
| Current Ratio | 1.75 | 1.69 |
| Quick Ratio | 1.33 | 1.41 |
| D/E (Debt-to-Equity) | 0.20 | 1.00 |
| Debt-to-Assets | 12.88% | 36.79% |
| Interest Coverage | 22.93 | 0.09 |
| Asset Turnover | 0.52 | 0.55 |
| Fixed Asset Turnover | 7.43 | 5.66 |
| Payout ratio | 39.33% | 0% |
| Dividend yield | 1.24% | 0% |
Interpretation of the Ratios
Xylem Inc.
Xylem’s ratios show a balanced profile with 50% favorable and 14% unfavorable indicators. Strengths include a solid net margin of 10.39%, good liquidity ratios, low debt levels, and strong interest coverage. However, its return on equity (8.36%) and price-to-earnings ratio (31.63) are less attractive. The company pays dividends with a 1.24% yield, reflecting moderate shareholder returns supported by stable cash flow coverage.
ATS Corporation
ATS presents a mixed ratio profile with 29% favorable and 36% unfavorable metrics. Key concerns are negative net margin (-1.11%), negative return on equity (-1.64%), and very low interest coverage of 0.16, indicating financial stress. The price-to-earnings ratio is negative but marked favorable due to valuation considerations. ATS does not pay dividends, likely prioritizing reinvestment amid profitability challenges and operating in a high-growth or restructuring phase.
Which one has the best ratios?
Xylem Inc. demonstrates a more favorable ratio set overall, with stronger profitability, liquidity, and debt management metrics. ATS shows weaknesses in profitability and coverage ratios, reflecting operational difficulties. Based solely on the ratio evaluations, Xylem exhibits a more stable financial position while ATS faces notable challenges in key financial areas.
Strategic Positioning
This section compares the strategic positioning of Xylem Inc. and ATS Corporation, including Market position, Key segments, and Exposure to technological disruption:
Xylem Inc.
- Large market cap of 34B USD, operating globally with diverse competitive pressures in industrial machinery.
- Key segments include Water Infrastructure, Applied Water, and Measurement & Control Solutions driving revenue growth.
- Exposure includes smart meters, cloud analytics, and networked communication in water and control products.
ATS Corporation
- Smaller market cap of 2.8B USD, focused on automation solutions with competitive pressure in machinery.
- Focused on automation services, manufacturing systems, software, and digital solutions across varied industries.
- Exposure through connected factory floor management systems and digital solutions for operational efficiency.
Xylem Inc. vs ATS Corporation Positioning
Xylem has a diversified business across water infrastructure and control technologies, while ATS concentrates on automation and manufacturing system services. Xylem’s broad product range contrasts with ATS’s specialized automation solutions, reflecting different industry focus and scale.
Which has the best competitive advantage?
Both companies are shedding value as ROIC is below WACC; however, Xylem shows a growing ROIC trend, indicating improving profitability, unlike ATS, whose profitability and ROIC are declining, suggesting a weaker competitive advantage.
Stock Comparison
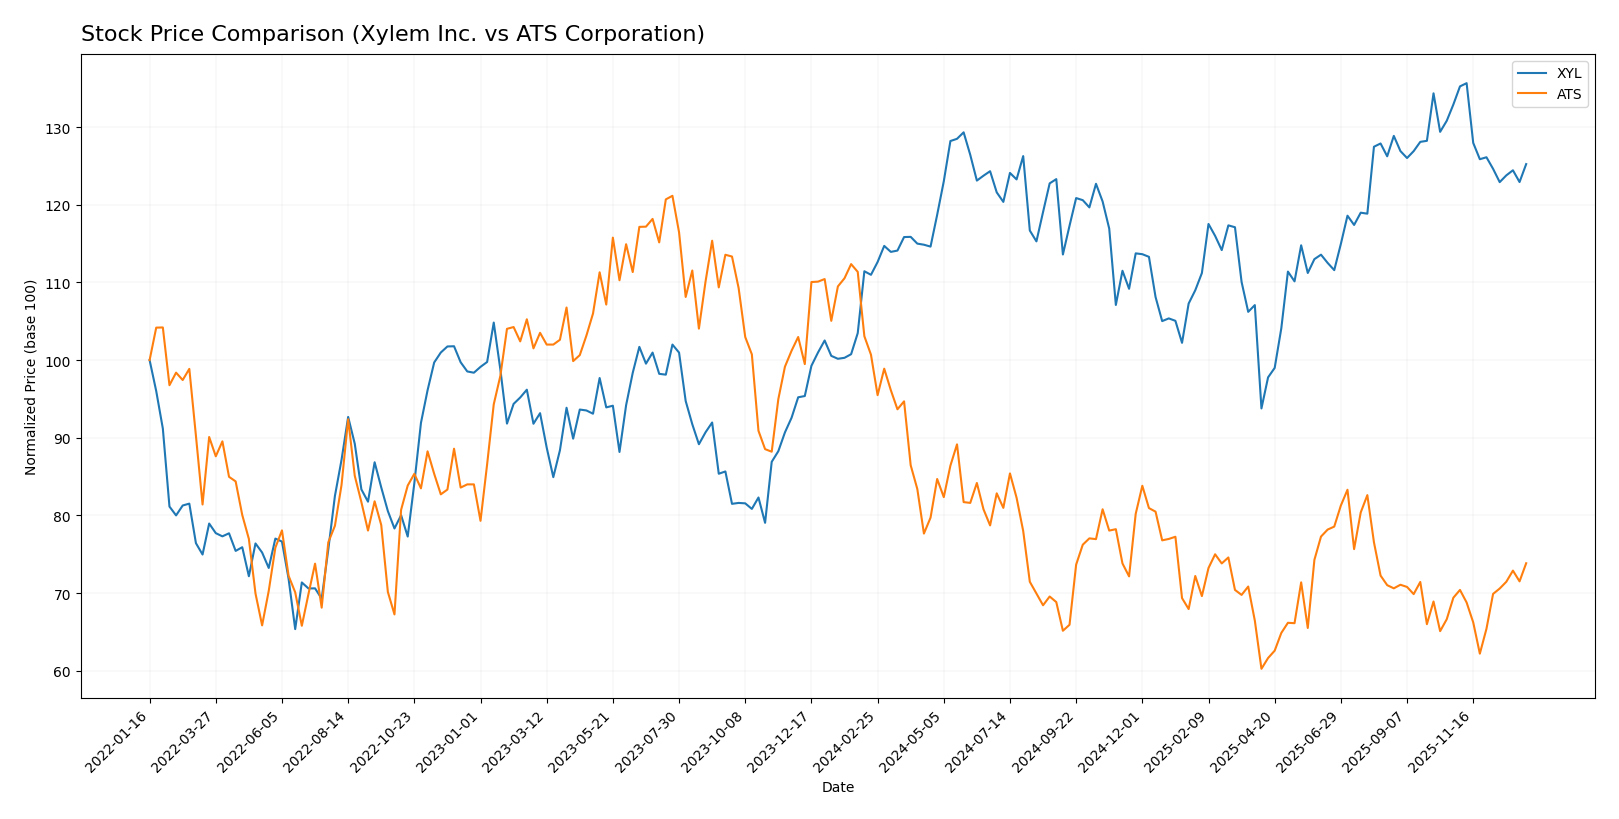
The stock prices of Xylem Inc. (XYL) and ATS Corporation (ATS) over the past year reveal contrasting market dynamics, with XYL showing a decelerating bullish trend and ATS experiencing an accelerating bearish phase.
Trend Analysis
Xylem Inc. (XYL) exhibited a bullish trend over the past 12 months with a 12.84% price increase, although this growth showed signs of deceleration. The stock ranged from a low of 104.6 to a high of 151.31.
ATS Corporation (ATS) faced a bearish trend over the past year, with a 26.66% price decline accompanied by accelerating downward momentum. The stock traded between 23.5 and 39.27 during this period.
Comparing both, Xylem delivered the highest market performance with a positive 12.84% change, contrasting with ATS’s significant 26.66% decrease in stock price.
Target Prices
The current consensus target prices suggest a generally positive outlook from analysts for both companies.
| Company | Target High | Target Low | Consensus |
|---|---|---|---|
| Xylem Inc. | 178 | 150 | 169.43 |
| ATS Corporation | 34 | 34 | 34 |
Analysts expect Xylem’s stock to appreciate significantly from its current price of 139.69 USD, while ATS Corporation’s target price is moderately above its current 28.8 USD, indicating limited but positive upside potential.
Analyst Opinions Comparison
This section compares analysts’ ratings and grades for Xylem Inc. and ATS Corporation:
Rating Comparison
Xylem Inc. Rating
- Rating: B, classified as Very Favorable
- Discounted Cash Flow Score: 3, Moderate
- Return on Equity Score: 3, Moderate
- Return on Assets Score: 4, Favorable
- Debt To Equity Score: 3, Moderate
- Overall Score: 3, Moderate
ATS Corporation Rating
- Rating: C, classified as Very Favorable
- Discounted Cash Flow Score: 3, Moderate
- Return on Equity Score: 1, Very Unfavorable
- Return on Assets Score: 1, Very Unfavorable
- Debt To Equity Score: 1, Very Unfavorable
- Overall Score: 2, Moderate
Which one is the best rated?
Based on the provided data, Xylem Inc. holds a higher overall rating (B) and stronger scores in return on equity, return on assets, and debt to equity than ATS Corporation, which has a lower overall rating (C) and mostly unfavorable scores.
Scores Comparison
The scores comparison between Xylem Inc. and ATS Corporation is as follows:
Xylem Inc. Scores
- Altman Z-Score of 4.89 places Xylem in the safe financial zone
- Piotroski Score of 8 indicates Xylem has very strong financial health
ATS Corporation Scores
- Altman Z-Score of 1.68 places ATS in the distress financial zone
- Piotroski Score of 3 indicates ATS has very weak financial health
Which company has the best scores?
Based strictly on the provided data, Xylem Inc. shows a stronger financial position with a safe zone Altman Z-Score and a very strong Piotroski Score. ATS Corporation remains in distress with weaker financial health indicators.
Grades Comparison
Here is a comparison of the most recent grades assigned to Xylem Inc. and ATS Corporation by major grading companies:
Xylem Inc. Grades
The table below summarizes the latest action and grades from reputable financial institutions for Xylem Inc.:
| Grading Company | Action | New Grade | Date |
|---|---|---|---|
| Barclays | Maintain | Overweight | 2026-01-07 |
| Mizuho | Maintain | Neutral | 2026-01-05 |
| TD Cowen | Maintain | Hold | 2025-12-05 |
| UBS | Maintain | Buy | 2025-11-06 |
| RBC Capital | Maintain | Outperform | 2025-10-29 |
| Stifel | Maintain | Buy | 2025-10-29 |
| Barclays | Maintain | Overweight | 2025-10-29 |
| Citigroup | Maintain | Buy | 2025-10-29 |
| Citigroup | Maintain | Buy | 2025-10-09 |
| Mizuho | Maintain | Neutral | 2025-09-12 |
Overall, Xylem Inc. shows a consistent pattern of positive ratings ranging from Hold to Buy and Outperform, with most firms maintaining their previous grades.
ATS Corporation Grades
The table below presents the available recent grades for ATS Corporation from recognized financial firms:
| Grading Company | Action | New Grade | Date |
|---|---|---|---|
| JP Morgan | Maintain | Neutral | 2024-08-13 |
| Goldman Sachs | Maintain | Sell | 2024-08-13 |
| JP Morgan | Maintain | Neutral | 2024-05-24 |
ATS Corporation has mixed grades, predominantly Neutral with one Sell rating, indicating a more cautious view by analysts.
Which company has the best grades?
Xylem Inc. has received more favorable and consistent grades, mostly Buy and Outperform, compared to ATS Corporation’s Neutral and Sell ratings. This difference may influence investors’ perception of growth potential and risk for each company.
Strengths and Weaknesses
Below is a comparison of key strengths and weaknesses for Xylem Inc. and ATS Corporation based on the latest financial and operational data.
| Criterion | Xylem Inc. (XYL) | ATS Corporation (ATS) |
|---|---|---|
| Diversification | Diverse segments: Applied Water, Water Infrastructure, Measurement and Control, Water Solutions & Services | Less diversified; product segmentation data limited |
| Profitability | Positive net margin (10.39%), but ROIC (5.78%) below WACC (8.93%) indicating slight value destruction | Negative net margin (-1.11%) and ROIC (0.09%) well below WACC (8.01%), showing value destruction |
| Innovation | Growing ROIC trend (+31.7%) signals improving operational efficiency and innovation | Declining ROIC trend (-98.9%) reflects weakening innovation and profitability |
| Global presence | Strong global footprint with multiple water-related business lines | Limited data, likely smaller global reach compared to Xylem |
| Market Share | Leading positions in water infrastructure and control solutions | Smaller market share with challenges in profitability and operational metrics |
Key takeaways: Xylem demonstrates solid diversification and improving profitability despite current value destruction, hinting at potential recovery. ATS faces more significant challenges with declining profitability and innovation, making it a higher-risk investment at this stage.
Risk Analysis
Below is a comparative table summarizing key risk metrics for Xylem Inc. (XYL) and ATS Corporation (ATS) based on the most recent financial and market data:
| Metric | Xylem Inc. (XYL) | ATS Corporation (ATS) |
|---|---|---|
| Market Risk | Beta 1.17 (moderate volatility) | Beta 1.27 (slightly higher volatility) |
| Debt level | Debt-to-Equity 0.20 (low, favorable) | Debt-to-Equity 1.00 (high, neutral) |
| Regulatory Risk | Moderate, US and global water infrastructure regulations | Moderate, global automation industry regulations |
| Operational Risk | Diversified product segments, stable operations | Higher operational complexity, risk from contract manufacturing and automation services |
| Environmental Risk | Exposure due to water treatment and infrastructure products | Moderate, with some exposure in manufacturing and energy sectors |
| Geopolitical Risk | US-based with global operations, moderate exposure | Canada-based with global presence, moderate exposure |
The most significant risks are ATS’s high debt level and weak profitability, with an Altman Z-score indicating financial distress and a low Piotroski score signaling weak fundamentals. Xylem shows a safer financial profile with low debt and strong financial health, though its sector exposure to water infrastructure requires attention to regulatory and environmental changes. Investors should weigh ATS’s elevated financial risks against its growth potential, while Xylem presents a more stable yet moderately valued opportunity.
Which Stock to Choose?
Xylem Inc. (XYL) shows a favorable income evolution with strong revenue and net income growth over 2020-2024, supported by solid profitability and a low debt profile. Its financial ratios are slightly favorable, with half rated positively and a very favorable rating of B. Despite a slightly unfavorable moat indicating value destruction, its ROIC is growing, suggesting improving profitability.
ATS Corporation (ATS) presents an unfavorable income evolution with declining net income and margins in recent years, coupled with high debt levels and several unfavorable financial ratios. Its overall rating is very favorable C, but many key scores like ROE and ROA are very unfavorable. The moat evaluation is very unfavorable, reflecting declining profitability and value destruction.
For risk-averse investors prioritizing financial stability and consistent profitability, Xylem Inc. might appear more favorable given its stronger income growth, financial health, and improving returns. Conversely, risk-tolerant investors seeking potential turnaround opportunities could interpret ATS’s recent slight price recovery as a sign to monitor, despite its weaker fundamentals and high leverage.
Disclaimer: Investment carries a risk of loss of initial capital. The past performance is not a reliable indicator of future results. Be sure to understand risks before making an investment decision.
Go Further
I encourage you to read the complete analyses of Xylem Inc. and ATS Corporation to enhance your investment decisions: