In the fast-evolving industrial machinery sector, Symbotic Inc. and ATS Corporation stand out for their innovative automation solutions. Both companies serve diverse markets with advanced robotics and manufacturing technologies, yet they differ in scale and strategic focus. This comparison explores their growth potential, market positioning, and innovation strategies to help you decide which stock might be the smarter addition to your investment portfolio. Let’s uncover the most compelling opportunity for investors today.
Table of contents
Companies Overview
I will begin the comparison between Symbotic Inc. and ATS Corporation by providing an overview of these two companies and their main differences.
Symbotic Inc. Overview
Symbotic Inc. is an automation technology company focused on enhancing efficiency for retailers and wholesalers in the US through robotics and technology. Its flagship offering, The Symbotic System, is a comprehensive warehouse automation solution designed to reduce costs, improve operational efficiency, and maximize inventory management. The company operates within the industrial machinery sector and is headquartered in Wilmington, Massachusetts.
ATS Corporation Overview
ATS Corporation provides a broad range of automation solutions worldwide, including the design, building, commissioning, and servicing of automated manufacturing and assembly systems. It offers pre- and post-automation services, contract manufacturing, engineering design, software development, and supply chain management. ATS serves diverse sectors such as life sciences, transportation, consumer products, and energy. The company is based in Cambridge, Canada, and was formerly known as ATS Automation Tooling Systems Inc.
Key similarities and differences
Both Symbotic and ATS operate in the industrial machinery sector, delivering automation technologies aimed at improving manufacturing and distribution processes. Symbotic focuses primarily on warehouse automation for US retailers and wholesalers, while ATS offers a wider variety of automation services across multiple industries and global markets. ATS has a larger workforce and a more diversified service portfolio, whereas Symbotic specializes in integrated robotics systems within warehousing environments.
Income Statement Comparison
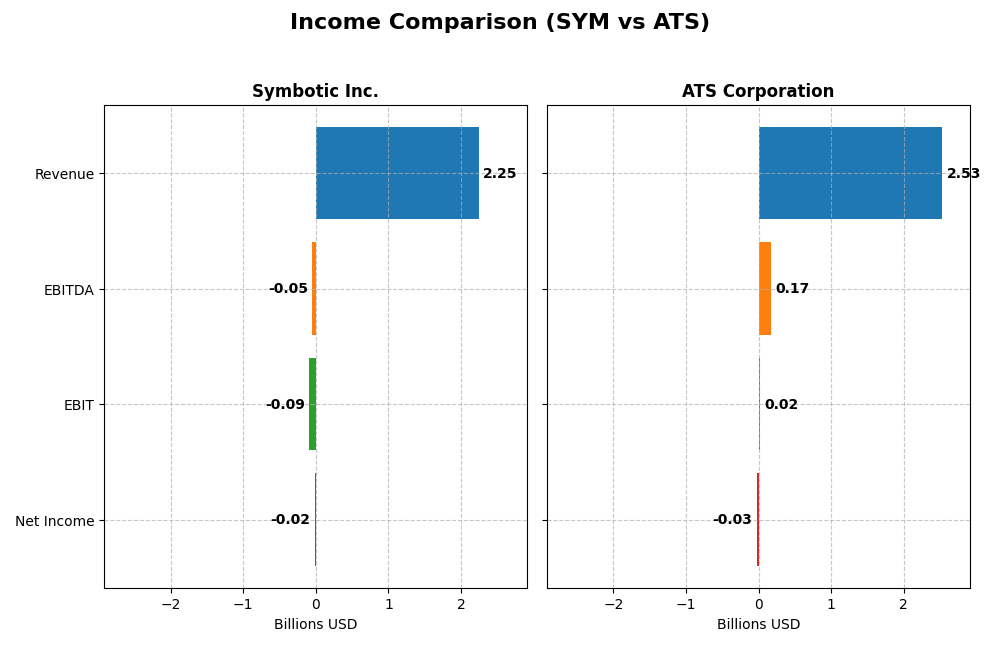
This table presents a side-by-side comparison of key income statement metrics for Symbotic Inc. and ATS Corporation based on their most recent fiscal year data.
| Metric | Symbotic Inc. (SYM) | ATS Corporation (ATS) |
|---|---|---|
| Market Cap | 42.8B USD | 2.8B CAD |
| Revenue | 2.25B USD | 2.53B CAD |
| EBITDA | -48.0M USD | 168.0M CAD |
| EBIT | -92.1M USD | 15.3M CAD |
| Net Income | -16.9M USD | -28.0M CAD |
| EPS | -0.16 USD | -0.29 CAD |
| Fiscal Year | 2025 | 2025 |
Income Statement Interpretations
Symbotic Inc.
Symbotic has shown strong revenue growth from 2021 to 2025, rising from $252M to $2.25B, with net income losses narrowing to -$17M in 2025. Gross margin remained stable at 18.8%, while EBIT and net margins stayed negative, indicating ongoing challenges in profitability. The most recent year saw revenue increase by 25.6%, but EBIT margin slightly deteriorated.
ATS Corporation
ATS’s revenue grew from CAD 1.43B in 2021 to CAD 3.03B in 2024, before declining to CAD 2.53B in 2025. Net income peaked at CAD 194M in 2024 but turned negative to -CAD 28M in 2025. Gross margin is solid at 25.5%, EBIT margin near break-even, but net margin is negative. The latest year saw declines in revenue, gross profit, and EBIT, signaling weakening profitability.
Which one has the stronger fundamentals?
Symbotic exhibits a favorable overall income statement trend with strong revenue growth and improving net margin over the period, despite persistent losses. ATS, while historically profitable, shows an unfavorable income statement with recent declines in revenue, profits, and margins. Symbotic’s growth and margin stability contrast with ATS’s recent financial deterioration.
Financial Ratios Comparison
The table below presents the latest available key financial ratios for Symbotic Inc. (SYM) and ATS Corporation (ATS), helping to highlight their recent financial performance and position.
| Ratios | Symbotic Inc. (SYM) 2025 | ATS Corporation (ATS) 2025 |
|---|---|---|
| ROE | -7.65% | -1.64% |
| ROIC | -16.63% | 0.09% |
| P/E | -335 | -125 |
| P/B | 25.6 | 2.06 |
| Current Ratio | 1.08 | 1.69 |
| Quick Ratio | 0.99 | 1.41 |
| D/E (Debt-to-Equity) | 0.14 | 1.00 |
| Debt-to-Assets | 1.3% | 36.8% |
| Interest Coverage | 0 | 9.4% |
| Asset Turnover | 0.94 | 0.55 |
| Fixed Asset Turnover | 15.9 | 5.66 |
| Payout ratio | 0 | 0 |
| Dividend yield | 0 | 0 |
Interpretation of the Ratios
Symbotic Inc.
Symbotic’s ratios reveal several weaknesses, including negative net margin (-0.75%) and return on equity (-7.65%), indicating profitability challenges. The company shows a high price-to-book ratio (25.6) and zero interest coverage, which are potential concerns. Current and quick ratios are neutral, and low leverage is favorable. Symbotic does not pay dividends, likely focusing on growth and reinvestment.
ATS Corporation
ATS Corporation presents mixed ratios: negative net margin (-1.11%) and ROE (-1.64%) highlight profitability issues, but current and quick ratios are favorable, reflecting good liquidity. Debt-to-equity is neutral at 1.0, with some interest coverage concerns (0.16). ATS also does not distribute dividends, suggesting reinvestment or strategic focus over shareholder payouts.
Which one has the best ratios?
Both companies face profitability challenges and lack dividend payments, indicating growth or reinvestment priorities. Symbotic shows more unfavorable profitability and coverage ratios but lower leverage. ATS has better liquidity and moderate leverage with fewer unfavorable ratios overall. Each exhibits a slightly unfavorable global ratio profile with different risk and operational characteristics.
Strategic Positioning
This section compares the strategic positioning of Symbotic Inc. and ATS Corporation across market position, key segments, and exposure to technological disruption:
Symbotic Inc.
- Larger market cap near 43B USD, faces significant competitive pressure in industrial machinery.
- Focused on warehouse automation systems mainly for US retailers and wholesalers, with growing system revenues.
- Provides advanced robotics and technology aimed at warehouse efficiency, exposed to evolving automation tech.
ATS Corporation
- Smaller market cap about 2.8B USD, competing globally in automation with moderate competitive pressure.
- Diversified automation solutions serving life sciences, transportation, consumer products, and more.
- Offers extensive automation services including software, engineering, and connected factory solutions.
Symbotic Inc. vs ATS Corporation Positioning
Symbotic is concentrated on warehouse automation with a strong US retail focus, relying heavily on its system segment. ATS has a diversified global automation portfolio across multiple industries, offering broader service and product integration capabilities.
Which has the best competitive advantage?
Both companies show declining ROIC and are value destroyers with very unfavorable moats. Symbotic’s larger scale contrasts with ATS’s diversification, but neither currently sustains a durable competitive advantage based on ROIC versus WACC trends.
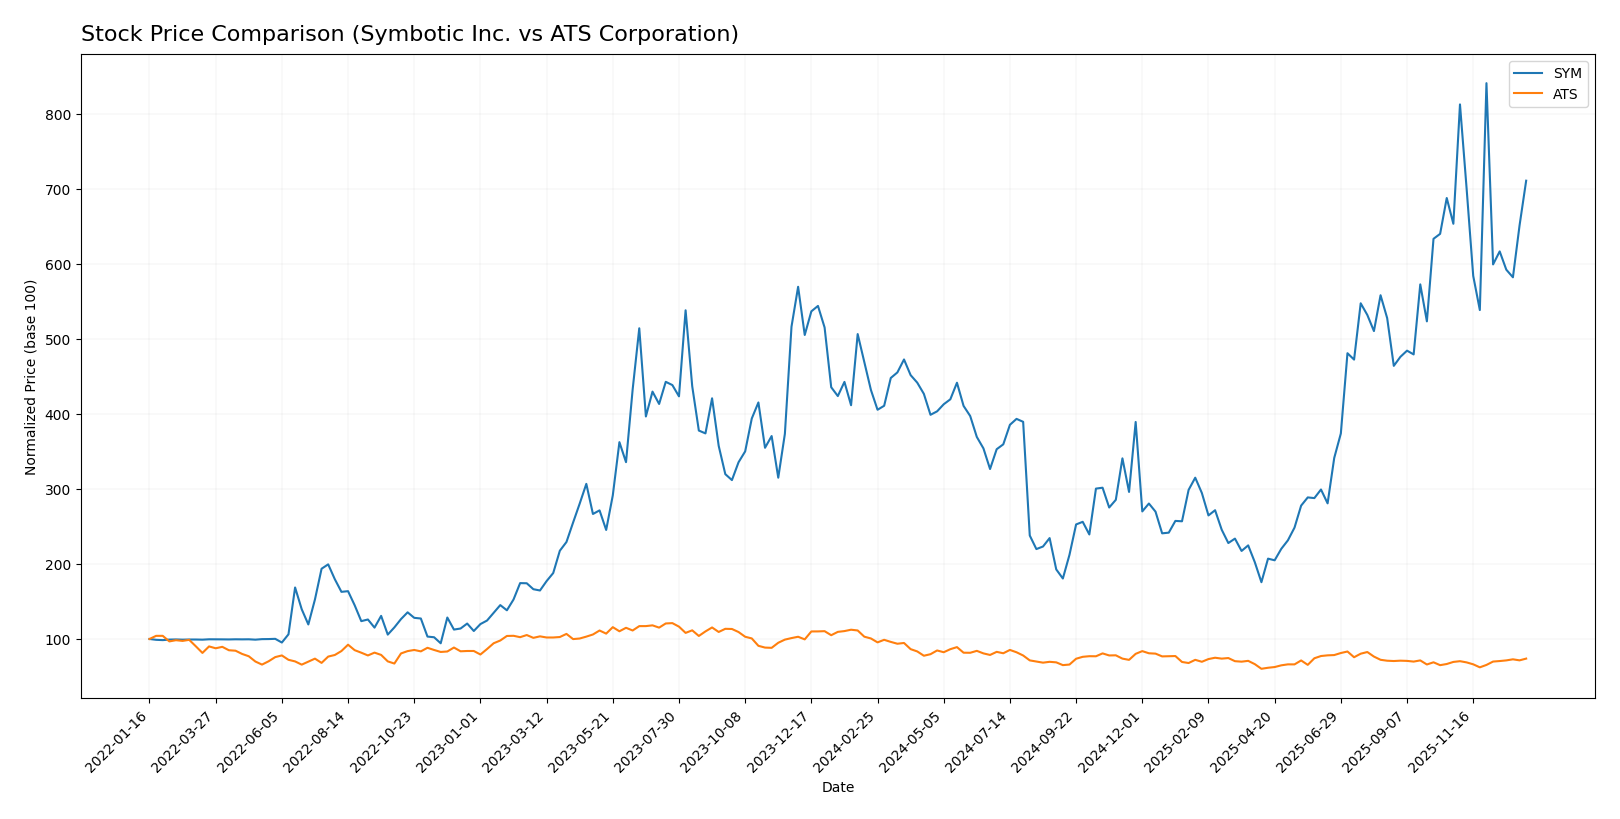
Stock Comparison
The stock price movements over the past 12 months reveal contrasting trends for Symbotic Inc. and ATS Corporation, highlighting significant bullish momentum for Symbotic and bearish pressure on ATS, with evolving trading dynamics in recent weeks.
Trend Analysis
Symbotic Inc. (SYM) shows a bullish trend over the past year with a 64.58% price increase, though the pace of growth has slowed recently. Price volatility is moderate with a standard deviation of 15.15, peaking at 83.77 and bottoming at 17.5.
ATS Corporation (ATS) exhibits a bearish trend over the same period, declining 26.66% despite accelerating momentum. Its price volatility remains low at 3.24 standard deviation, with highs of 39.27 and lows of 23.5.
Comparing both, Symbotic delivered the highest market performance, outperforming ATS significantly in price appreciation despite recent deceleration in its upward trend.
Target Prices
The current analyst consensus provides a clear outlook on target price ranges for Symbotic Inc. and ATS Corporation.
| Company | Target High | Target Low | Consensus |
|---|---|---|---|
| Symbotic Inc. | 83 | 41 | 65.11 |
| ATS Corporation | 34 | 34 | 34 |
Analysts expect Symbotic Inc. shares to trade moderately above the current price of $70.82, while ATS Corporation’s consensus target of $34 suggests potential upside from its $28.80 price. Overall, targets reflect cautious optimism.
Analyst Opinions Comparison
This section compares analysts’ ratings and grades for Symbotic Inc. and ATS Corporation:
Rating Comparison
SYM Rating
- Rating: C+ indicating a very favorable overall assessment.
- Discounted Cash Flow Score: 5, rated very favorable, suggests strong valuation.
- ROE Score: 1, very unfavorable, reflecting low efficiency in equity returns.
- ROA Score: 1, very unfavorable, showing poor asset utilization.
- Debt To Equity Score: 3, moderate, implying balanced financial risk.
- Overall Score: 2, moderate, summarizing average financial standing.
ATS Rating
- Rating: C indicating a very favorable overall assessment.
- Discounted Cash Flow Score: 3, moderate rating, indicating average valuation.
- ROE Score: 1, very unfavorable, similarly reflecting low equity return.
- ROA Score: 1, very unfavorable, indicating poor asset utilization.
- Debt To Equity Score: 1, very unfavorable, indicating higher financial risk.
- Overall Score: 2, moderate, summarizing average financial standing.
Which one is the best rated?
Based on the provided data, SYM holds a slightly better rating with a C+ compared to ATS’s C. SYM’s discounted cash flow and debt-to-equity scores are stronger, while both share similar weaknesses in ROE and ROA.
Scores Comparison
Here is a comparison of the Altman Z-Score and Piotroski Score for Symbotic Inc. and ATS Corporation:
SYM Scores
- Altman Z-Score: 13.05, indicating a safe zone.
- Piotroski Score: 3, classified as very weak.
ATS Scores
- Altman Z-Score: 1.68, indicating a distress zone.
- Piotroski Score: 3, classified as very weak.
Which company has the best scores?
Based on the provided data, Symbotic Inc. has a significantly stronger Altman Z-Score, placing it in the safe zone, while ATS is in the distress zone. Both companies share the same very weak Piotroski Score of 3.
Grades Comparison
Here is a detailed comparison of the recent grades assigned to Symbotic Inc. and ATS Corporation by recognized grading companies:
Symbotic Inc. Grades
This table summarizes recent grade changes and recommendations from major financial institutions for Symbotic Inc.
| Grading Company | Action | New Grade | Date |
|---|---|---|---|
| Goldman Sachs | Downgrade | Sell | 2025-12-02 |
| Barclays | Maintain | Underweight | 2025-11-26 |
| Baird | Maintain | Neutral | 2025-11-26 |
| Craig-Hallum | Upgrade | Buy | 2025-11-25 |
| Northland Capital Markets | Maintain | Outperform | 2025-11-25 |
| Needham | Maintain | Buy | 2025-11-25 |
| Cantor Fitzgerald | Maintain | Overweight | 2025-11-25 |
| DA Davidson | Maintain | Neutral | 2025-11-25 |
| Citigroup | Maintain | Buy | 2025-11-25 |
| UBS | Downgrade | Sell | 2025-09-23 |
Overall, Symbotic Inc. exhibits a mixed rating trend, with several buy and outperform ratings balanced by recent downgrades to sell from notable firms.
ATS Corporation Grades
This table shows recent grade updates from key financial institutions for ATS Corporation.
| Grading Company | Action | New Grade | Date |
|---|---|---|---|
| JP Morgan | Maintain | Neutral | 2024-08-13 |
| Goldman Sachs | Maintain | Sell | 2024-08-13 |
| JP Morgan | Maintain | Neutral | 2024-05-24 |
ATS Corporation’s grades indicate a generally cautious stance with neutral and sell recommendations, showing no upgrades or buy ratings recently.
Which company has the best grades?
Symbotic Inc. holds a stronger consensus with 9 buy ratings and an overall “Buy” consensus compared to ATS Corporation’s mixed hold and sell ratings and a “Hold” consensus. This contrast suggests differing investor confidence levels, which may influence portfolio weighting decisions and risk assessments.
Strengths and Weaknesses
Below is a comparative overview of key strengths and weaknesses for Symbotic Inc. (SYM) and ATS Corporation (ATS) based on recent financial and operational data.
| Criterion | Symbotic Inc. (SYM) | ATS Corporation (ATS) |
|---|---|---|
| Diversification | Moderate, relies heavily on Systems (≈2.12B USD in 2025) with smaller segments in Operation Services and Software Maintenance | Limited data on product diversification; primarily industrial automation |
| Profitability | Negative net margin (-0.75%) and ROIC (-16.63%), showing value destruction | Negative net margin (-1.11%) and near-zero ROIC (0.09%), also value destructive |
| Innovation | High fixed asset turnover (15.92) suggests efficient use of assets, but declining ROIC indicates challenges | Moderate fixed asset turnover (5.66), innovation impact unclear; ROIC declining |
| Global presence | Not explicitly detailed, but significant Systems revenue indicates strong operational scale | Global presence implied but less revenue detail available |
| Market Share | Large Systems segment growth from 568M USD in 2022 to 2.12B USD in 2025 | Market share unclear due to lack of revenue segmentation |
Key takeaways: Both companies currently face profitability challenges with declining returns on invested capital, indicating value destruction. Symbotic shows strong revenue growth in its Systems segment, suggesting operational scale, while ATS lacks detailed diversification data. Caution and thorough risk assessment are essential before considering investment in either company.
Risk Analysis
Below is a comparative table of key risks for Symbotic Inc. (SYM) and ATS Corporation (ATS) based on their latest 2025 financial data and market conditions.
| Metric | Symbotic Inc. (SYM) | ATS Corporation (ATS) |
|---|---|---|
| Market Risk | High beta (2.14) indicates high volatility and sensitivity to market swings. | Moderate beta (1.27), less volatile than SYM but still exposed to market fluctuations. |
| Debt level | Low debt-to-equity (0.14) and debt-to-assets (1.32%) suggest low financial leverage. | Higher debt level with debt-to-equity at 1.0 and debt-to-assets around 36.8%, indicating moderate leverage risk. |
| Regulatory Risk | Moderate, U.S.-based industrial automation sector subject to evolving labor and safety regulations. | Moderate, operating globally including regulated sectors like life sciences and nuclear, subject to international compliance. |
| Operational Risk | Technology reliance with negative net margin (-0.75%) and weak returns (ROE -7.65%) signal operational inefficiencies. | Negative net margin (-1.11%) and low ROE (-1.64%) reflect operational challenges despite larger scale. |
| Environmental Risk | Moderate, given industrial machinery focus but increasing pressure on sustainable manufacturing practices. | Moderate to high due to operations in energy and nuclear sectors requiring strict environmental compliance. |
| Geopolitical Risk | Low to moderate, primarily US-focused but exposed to trade tensions affecting supply chains. | Moderate, Canadian base with global exposure increases vulnerability to geopolitical disruptions. |
In summary, Symbotic’s most impactful risks are its high market volatility and operational inefficiencies, despite low debt. ATS carries higher leverage and geopolitical exposure, with operational challenges and environmental risks in sensitive industries. Both companies face negative profitability trends, demanding cautious risk management from investors.
Which Stock to Choose?
Symbotic Inc. (SYM) shows a favorable income statement with strong revenue growth of 25.65% in the last year and 792% over five years, but it struggles with negative profitability ratios including a -7.65% ROE and -16.63% ROIC. Its debt levels appear manageable, and it holds a very favorable overall rating of C+ despite mixed financial ratios.
ATS Corporation (ATS) displays weaker recent income trends, with a 16.47% revenue decline last year and unfavorable net margin and EPS growth over five years. Financial ratios are slightly more balanced but still mostly unfavorable, and the company’s rating is very favorable at C, though its Altman Z-Score signals financial distress.
Investors seeking growth potential may find SYM’s strong revenue expansion and favorable income statement appealing despite its profitability challenges. Conversely, those prioritizing financial stability might see ATS’s current ratios and moderate ratings as more suitable, yet both companies face value erosion and declining profitability risks.
Disclaimer: Investment carries a risk of loss of initial capital. The past performance is not a reliable indicator of future results. Be sure to understand risks before making an investment decision.
Go Further
I encourage you to read the complete analyses of Symbotic Inc. and ATS Corporation to enhance your investment decisions: