Home > Comparison > Industrials > ROP vs ATS
The strategic rivalry between Roper Technologies, Inc. and ATS Corporation defines the current trajectory of the industrial machinery sector. Roper operates as a diversified technology-driven industrial giant, blending software and engineered products. ATS focuses on specialized automation solutions and manufacturing system integration. This analysis unpacks their contrasting growth models to determine which offers superior risk-adjusted returns for a diversified industrial portfolio in 2026.
Table of contents
Companies Overview
Roper Technologies and ATS Corporation lead innovation in industrial machinery automation and solutions.
Roper Technologies, Inc.: Diversified Industrial Innovator
Roper Technologies dominates with a broad portfolio of software and engineered products. Its core revenue stems from cloud-based analytics, healthcare software, and precision instruments. In 2026, Roper sharpens its focus on expanding software-driven solutions across healthcare, finance, and industrial sectors, leveraging data analytics and automation to enhance operational efficiency.
ATS Corporation: Automation Systems Specialist
ATS Corporation excels in delivering custom automation solutions worldwide. Its revenue engine revolves around designing, building, and servicing automated manufacturing and assembly systems. In 2026, ATS prioritizes enhancing its connected factory software and digital solutions to optimize real-time performance data and reduce equipment downtime across multiple industry verticals.
Strategic Collision: Similarities & Divergences
Both companies emphasize automation but differ in approach: Roper pursues a software-centric, diversified model, while ATS focuses on integrated factory floor automation hardware and services. Their primary battleground lies in industrial efficiency and digital transformation solutions. Investors encounter distinct profiles—Roper as a diversified tech-driven industrial powerhouse and ATS as a specialized, performance-oriented automation provider.
Income Statement Comparison
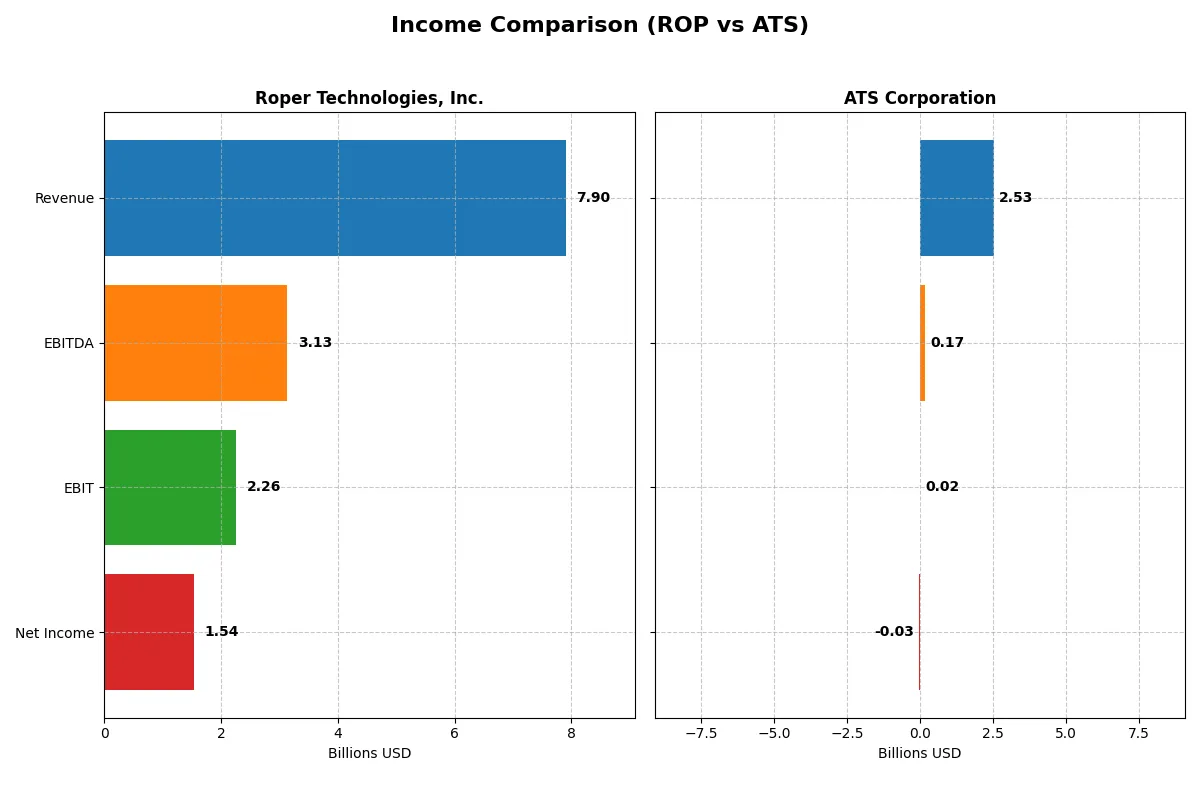
This data dissects the core profitability and scalability of both corporate engines to reveal who dominates the bottom line:
| Metric | Roper Technologies, Inc. (ROP) | ATS Corporation (ATS) |
|---|---|---|
| Revenue | 7.90B | 2.53B |
| Cost of Revenue | 2.43B | 1.89B |
| Operating Expenses | 3.24B | 637M |
| Gross Profit | 5.47B | 647M |
| EBITDA | 3.13B | 168M |
| EBIT | 2.26B | 15.3M |
| Interest Expense | 325M | 98.2M |
| Net Income | 1.54B | -28.0M |
| EPS | 14.31 | -0.29 |
| Fiscal Year | 2025 | 2025 |
Income Statement Analysis: The Bottom-Line Duel
This income statement comparison reveals the true efficiency of each corporate engine through revenue growth, margin trends, and net income dynamics.
Roper Technologies, Inc. Analysis
Roper demonstrates strong revenue growth, reaching $7.9B in 2025, up 12% from 2024. Net income remains robust at $1.54B despite a slight 1% EPS decline. Gross margin holds favorably at 69.2%, and net margin stays healthy near 19.4%. Operating expenses grew in line with revenue, showing steady momentum but slight pressure on margins.
ATS Corporation Analysis
ATS posts $2.53B revenue in 2025, down 16% year-over-year, with net income slipping to a $28M loss. Gross margin contracts sharply to 25.5%, while net margin turns negative at -1.1%. EBIT margin remains minimal at 0.6%. The company faces declining profitability and weakening momentum, despite a 77% revenue jump over five years.
Margin Power vs. Revenue Scale
Roper clearly outperforms ATS in profitability and margin stability, driven by efficient cost control and sustained revenue growth. ATS struggles with margin erosion and a recent net loss, signaling operational challenges. For investors, Roper’s profile offers a more compelling combination of growth and margin resilience.
Financial Ratios Comparison
These vital ratios act as a diagnostic tool to expose the underlying fiscal health, valuation premiums, and capital efficiency of the companies compared below:
| Ratios | Roper Technologies, Inc. (ROP) | ATS Corporation (ATS) |
|---|---|---|
| ROE | 8.2% (2024) | -1.6% (2025) |
| ROIC | 5.5% (2024) | 0.09% (2024) |
| P/E | 36.0 (2024) | -125.3 (2025) |
| P/B | 2.95 (2024) | 2.06 (2025) |
| Current Ratio | 0.40 (2024) | 1.69 (2025) |
| Quick Ratio | 0.37 (2024) | 1.41 (2025) |
| D/E (Debt-to-Equity) | 0.41 (2024) | 1.00 (2025) |
| Debt-to-Assets | 24.5% (2024) | 36.8% (2025) |
| Interest Coverage | 7.7 (2024) | 0.09 (2025) |
| Asset Turnover | 0.22 (2024) | 0.55 (2025) |
| Fixed Asset Turnover | 47.0 (2024) | 5.7 (2025) |
| Payout Ratio | 20.8% (2024) | 0% (2025) |
| Dividend Yield | 0.58% (2024) | 0% (2025) |
| Fiscal Year | 2024 | 2025 |
Efficiency & Valuation Duel: The Vital Signs
Financial ratios act as a company’s DNA, exposing hidden risks and operational strengths with clarity and precision.
Roper Technologies, Inc.
Roper Technologies shows a strong net margin of 19.44%, signaling operational efficiency. However, its ROE and ROIC stand at zero, indicating limited profitability relative to equity and invested capital. The stock trades at a stretched P/E of 31.06, suggesting high valuation. A modest dividend yield of 0.74% points to some shareholder returns despite reinvestment in R&D.
ATS Corporation
ATS Corporation reports negative net margin and ROE, reflecting weak profitability and shareholder value creation. Its P/E ratio is unusually negative at -125.28, highlighting earnings struggles but a favorable valuation metric. ATS maintains a solid current ratio of 1.69, showing liquidity strength. Shareholders receive no dividends, as capital focuses on operational recovery and growth.
Premium Valuation vs. Operational Struggles
Roper commands a premium valuation backed by operational efficiency, though profitability on equity is lacking. ATS offers better liquidity but suffers from persistent losses and weak returns. Investors seeking stability may lean toward Roper, while those tolerating volatility might consider ATS’s turnaround potential.
Which one offers the Superior Shareholder Reward?
I compare Roper Technologies, Inc. (ROP) and ATS Corporation (ATS) based on dividends, payout ratios, and buybacks. ROP pays a modest but sustainable dividend yield near 0.74%, with a payout ratio around 23%, backed by strong free cash flow coverage above 98%. ATS does not pay dividends and posts negative free cash flow, signaling reinvestment needs or operational challenges. ROP also maintains consistent buyback programs, enhancing shareholder returns. ATS’s lack of distributions and weak cash flow raise sustainability concerns. I find ROP offers a more attractive total return profile in 2026 due to its disciplined capital allocation and balance sheet strength.
Comparative Score Analysis: The Strategic Profile
The radar chart reveals the core DNA and strategic trade-offs shaping Roper Technologies and ATS Corporation’s financial profiles:
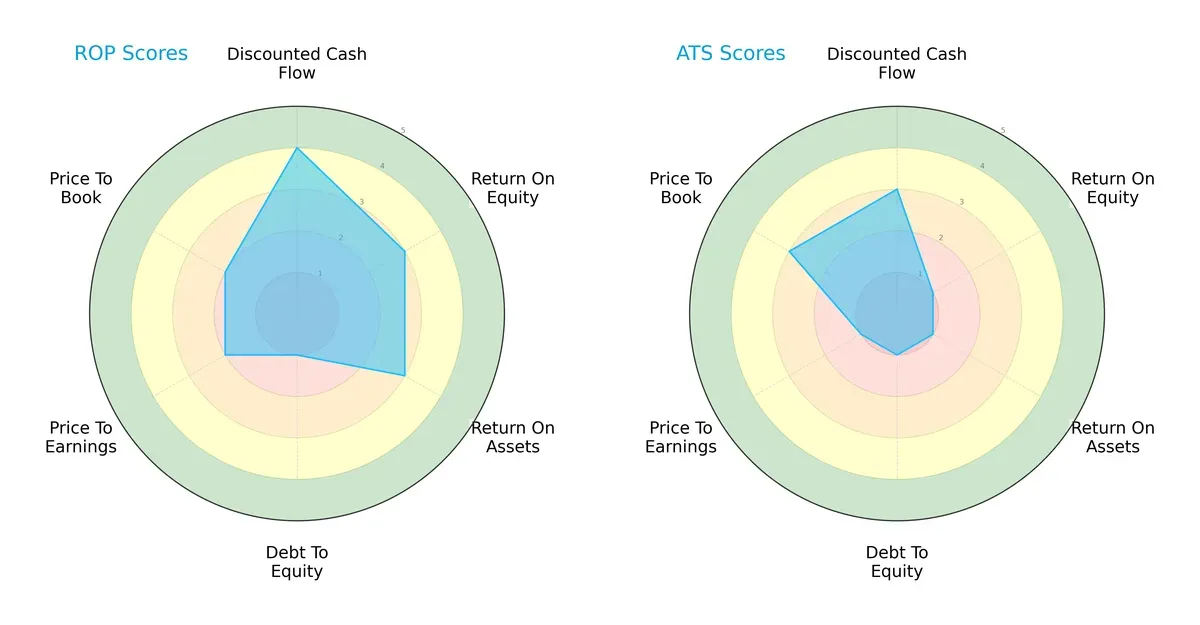
Roper Technologies shows a more balanced profile with solid DCF (4) and moderate ROE (3) and ROA (3), though its debt-to-equity score is weak (1). ATS relies heavily on valuation strength (P/B score 3) but suffers very unfavorable operational metrics, including low ROE (1) and ROA (1). Roper’s diversified strengths outshine ATS’s narrow valuation edge.
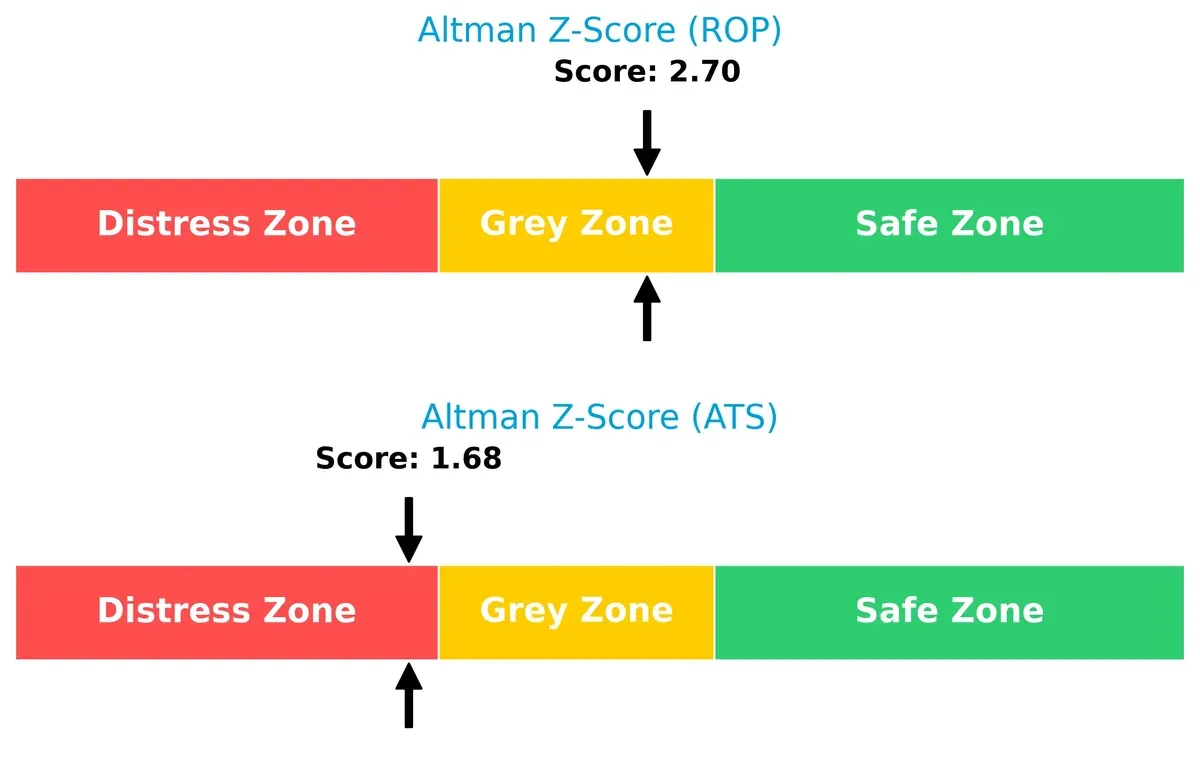
Bankruptcy Risk: Solvency Showdown
Roper’s Altman Z-Score of 2.7 places it in the grey zone, signaling moderate bankruptcy risk, while ATS’s 1.68 falls into the distress zone, indicating heightened financial vulnerability in this cycle:
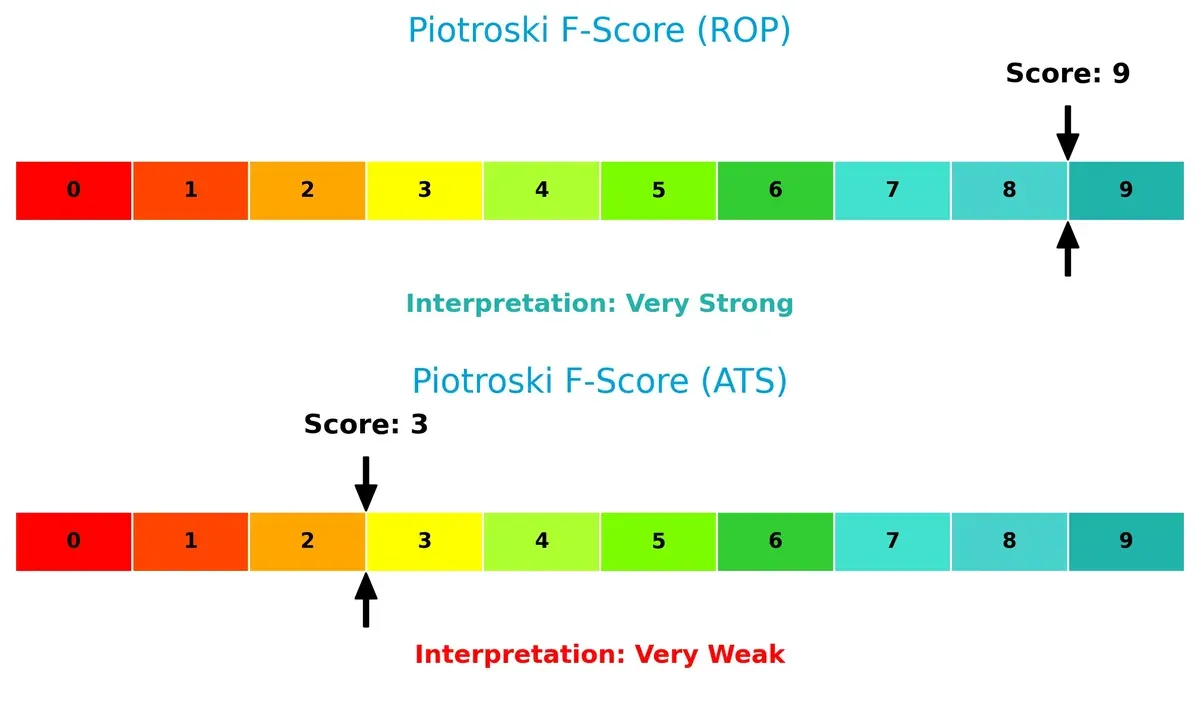
Financial Health: Quality of Operations
Roper’s Piotroski F-Score of 9 signals peak financial health, showcasing robust internal metrics and operational efficiency. ATS’s score of 3 raises red flags, reflecting weak profitability and financial stability:
How are the two companies positioned?
This section dissects ROP and ATS’s operational DNA by comparing their revenue distribution and internal dynamics. The goal is to confront their economic moats and identify which model offers the most resilient competitive advantage today.
Revenue Segmentation: The Strategic Mix
This visual comparison dissects how both firms diversify their income streams and where their primary sector bets lie:
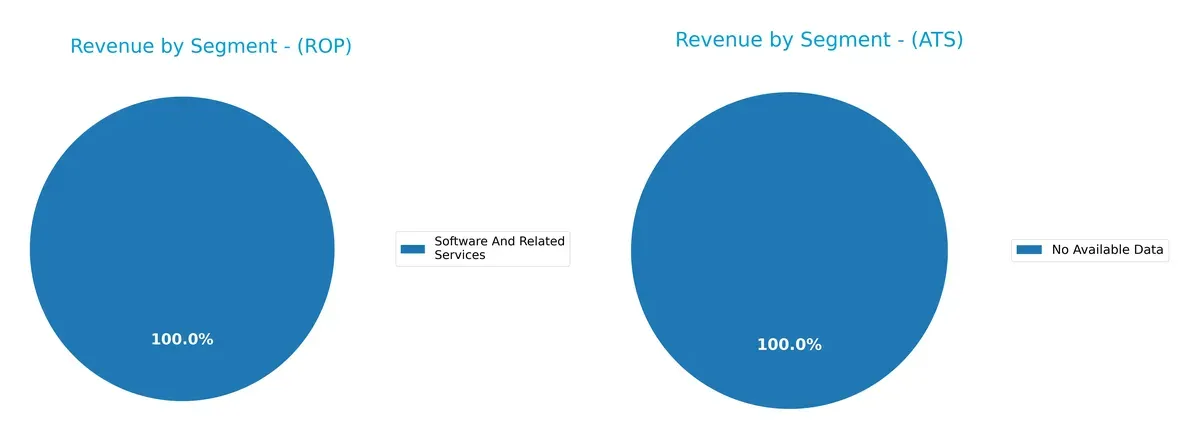
Roper Technologies anchors revenue in software, with $10.7B from Software and Related Services in 2024, showing strong concentration. Earlier years reveal a more diversified setup across Application Software ($3.2B), Network Software ($1.4B), and Technology Products ($1.6B). ATS lacks available data, preventing a direct comparison. Roper’s reliance on software signals ecosystem lock-in but also concentration risk if market shifts occur.
Strengths and Weaknesses Comparison
This table compares the strengths and weaknesses of Roper Technologies, Inc. and ATS Corporation based on diversification, profitability, financials, innovation, global presence, and market share:
Roper Technologies Strengths
- Strong profitability with 19.44% net margin
- Favorable debt-to-assets and interest coverage ratios
- Diversified software and technology product segments
- Significant U.S. market presence with growing international sales
ATS Corporation Strengths
- Favorable P/E ratio despite losses
- Healthy liquidity with current and quick ratios above 1
- Good fixed asset turnover indicating efficient asset use
- Diverse geographic revenue across U.S. and multiple European countries
Roper Technologies Weaknesses
- Unfavorable ROE and ROIC, indicating weak capital returns
- Unavailable WACC complicates cost of capital evaluation
- Poor liquidity ratios with current and quick ratios at zero
- High P/E ratio may signal overvaluation
- Low dividend yield at 0.74%
ATS Corporation Weaknesses
- Negative net margin and ROE reflect ongoing losses
- Low interest coverage ratio at 0.16 signals risk
- Neutral debt levels with D/E at 1.0 may constrain flexibility
- Absence of dividend yield limits income appeal
Roper shows strengths in profitability and product diversification but faces concerns in capital efficiency and liquidity. ATS demonstrates better liquidity and asset utilization but struggles with profitability and financial risk. These factors shape their strategic priorities distinctly.
The Moat Duel: Analyzing Competitive Defensibility
A structural moat is the only true shield protecting long-term profits from relentless competition erosion. Let’s dissect these firms’ moats:
Roper Technologies, Inc.: Intangible Assets & Diversification Moat
Roper’s moat stems from its broad portfolio of specialized software and engineered products. This fuels stable margins around 28.6% EBIT and robust 19.4% net margin. Expanding cloud-based analytics deepens its defensibility in 2026.
ATS Corporation: Automation Expertise with Cost Challenges
ATS relies on automation system integration and digital factory solutions, a narrower moat than Roper’s diversification. Margins remain thin around 0.6% EBIT, with recent profit declines. Growth hinges on innovation and market recovery.
Moat Strength Showdown: Diversification vs. Specialized Automation
Roper commands a wider, more resilient moat driven by intangible assets and steady profitability. ATS faces a very unfavorable moat with shrinking returns. Roper clearly stands better poised to defend market share in 2026.
Which stock offers better returns?
The past year shows contrasting stock dynamics, with Roper Technologies sliding sharply while ATS Corporation recovers from prior losses and gains momentum.
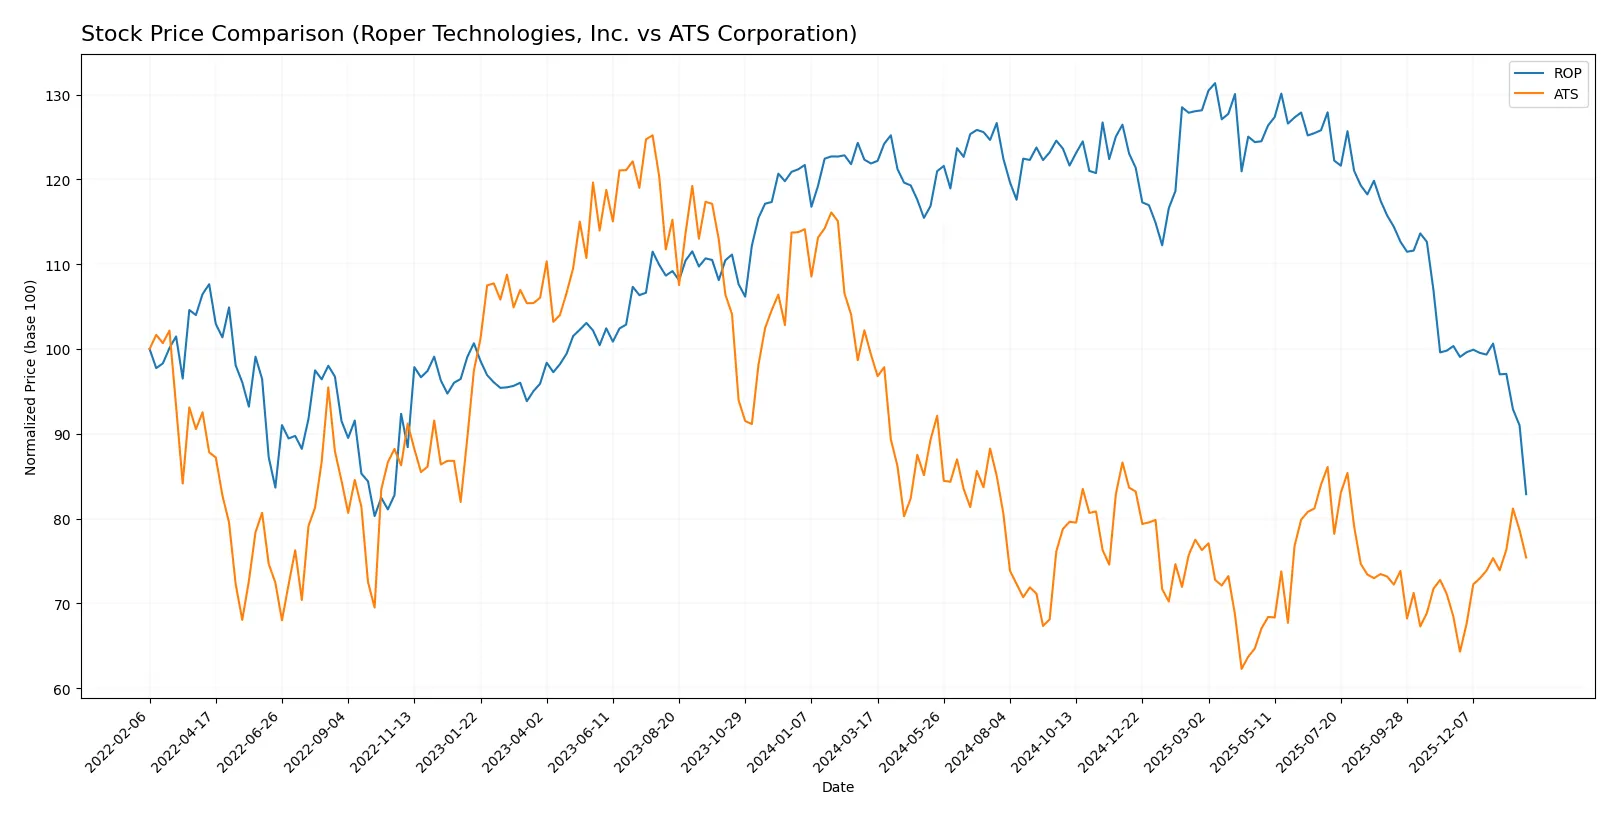
Trend Comparison
Roper Technologies’ stock declined 32% over 12 months, showing a bearish trend with decelerating losses and high volatility. The price ranged between 371.23 and 588.38.
ATS Corporation experienced a 24.09% drop overall but accelerated recently, gaining 10.18% in the last two and a half months, indicating a bullish short-term reversal with low volatility.
Comparing both, ATS outperformed Roper in recent months, delivering the highest market performance despite a longer-term bearish trend.
Target Prices
Analysts present a mixed target consensus for Roper Technologies and ATS Corporation.
| Company | Target Low | Target High | Consensus |
|---|---|---|---|
| Roper Technologies, Inc. | 365 | 575 | 475.5 |
| ATS Corporation | 34 | 34 | 34 |
Roper’s consensus target stands about 28% above its $371 current price, signaling bullish expectations. ATS’s $34 target exceeds its $28.46 price, implying moderate upside potential.

Don’t Let Luck Decide Your Entry Point
Optimize your entry points with our advanced ProRealTime indicators. You’ll get efficient buy signals with precise price targets for maximum performance. Start outperforming now!
How do institutions grade them?
Roper Technologies, Inc. Grades
Below is a summary of recent institutional grade changes for Roper Technologies, Inc.:
| Grading Company | Action | New Grade | Date |
|---|---|---|---|
| Goldman Sachs | maintain | Neutral | 2026-01-29 |
| Argus Research | downgrade | Hold | 2026-01-28 |
| Oppenheimer | downgrade | Perform | 2026-01-28 |
| Mizuho | maintain | Underperform | 2026-01-28 |
| Truist Securities | maintain | Buy | 2026-01-28 |
| RBC Capital | maintain | Sector Perform | 2026-01-28 |
| Barclays | maintain | Underweight | 2026-01-28 |
| Stifel | downgrade | Hold | 2026-01-28 |
| Citigroup | maintain | Buy | 2026-01-28 |
| JP Morgan | maintain | Underweight | 2026-01-28 |
ATS Corporation Grades
Below is a summary of recent institutional grade changes for ATS Corporation:
| Grading Company | Action | New Grade | Date |
|---|---|---|---|
| JP Morgan | maintain | Neutral | 2026-01-16 |
| JP Morgan | maintain | Neutral | 2024-08-13 |
| Goldman Sachs | maintain | Sell | 2024-08-13 |
| JP Morgan | maintain | Neutral | 2024-05-24 |
Which company has the best grades?
Roper Technologies holds generally stronger grades, including multiple Buy ratings, while ATS primarily maintains Neutral or Sell grades. This suggests Roper has broader institutional confidence, potentially influencing investor sentiment positively.
Risks specific to each company
The following categories identify the critical pressure points and systemic threats facing both firms in the 2026 market environment:
1. Market & Competition
Roper Technologies, Inc.
- Operates in diversified industrial software and engineered products with established market presence.
ATS Corporation
- Focuses on automation solutions, facing intense competition and narrower market reach.
2. Capital Structure & Debt
Roper Technologies, Inc.
- Strong interest coverage at 6.96; favorable debt ratios but some uncertainty in leverage data.
ATS Corporation
- Higher debt-to-assets at 36.8%, weak interest coverage at 0.16 signals financial strain.
3. Stock Volatility
Roper Technologies, Inc.
- Beta at 0.94 suggests moderate market sensitivity, lower volatility than ATS.
ATS Corporation
- Beta at 1.27 indicates higher volatility and market risk exposure.
4. Regulatory & Legal
Roper Technologies, Inc.
- US-based, subject to mature regulatory environment; fewer regulatory surprises expected.
ATS Corporation
- Canada-based with exposure to evolving cross-border trade regulations and compliance costs.
5. Supply Chain & Operations
Roper Technologies, Inc.
- Diverse product lines and global operations mitigate supply chain disruption risks.
ATS Corporation
- Reliance on automated manufacturing may increase vulnerability to supply chain bottlenecks.
6. ESG & Climate Transition
Roper Technologies, Inc.
- Established in industrials with growing ESG initiatives but limited disclosure on climate risks.
ATS Corporation
- Focus on automation offers efficiency gains but faces pressure to align with stricter ESG standards.
7. Geopolitical Exposure
Roper Technologies, Inc.
- Primarily US operations reduce geopolitical risk but exposed to trade tensions.
ATS Corporation
- Cross-border operations between Canada and US introduce moderate geopolitical challenges.
Which company shows a better risk-adjusted profile?
Roper’s solid interest coverage and moderate stock volatility underline a stronger financial footing. ATS’s high debt burden and weak profitability heighten its risk profile. Roper’s Altman Z-score in the grey zone contrasts with ATS’s distress zone, signaling more financial stability. The critical risk for Roper is its moderate leverage concerns despite good interest coverage. ATS faces severe profitability and solvency risks, highlighted by its weak Altman Z-score and low Piotroski score. Roper Technologies shows a better risk-adjusted profile, justified by its more favorable financial ratios and lower market volatility in 2026.
Final Verdict: Which stock to choose?
Roper Technologies, Inc. (ROP) excels as a cash-generating industrial powerhouse with robust gross margins and a solid income quality profile. Its main point of vigilance is the stretched liquidity position, reflected in a very low current ratio, which could pressure short-term operations. ROP suits investors seeking steady industrial growth with a tolerance for operational leverage risks.
ATS Corporation’s strategic moat lies in its specialized manufacturing footprint with moderate asset turnover efficiency. Relative to ROP, ATS offers a more conservative liquidity buffer and less volatile earnings, but struggles with consistent profitability and value creation. ATS fits well in portfolios emphasizing turnaround potential and moderate risk exposure.
If you prioritize resilient cash flow and industrial efficiency, ROP outshines as the compelling choice despite its liquidity caution. However, if your strategy favors stability and potential recovery in a niche manufacturing player, ATS offers better stability and a more conservative financial posture, though it commands a premium in risk. Each scenario reflects distinct investor profiles requiring careful risk assessment.
Disclaimer: Investment carries a risk of loss of initial capital. The past performance is not a reliable indicator of future results. Be sure to understand risks before making an investment decision.
Go Further
I encourage you to read the complete analyses of Roper Technologies, Inc. and ATS Corporation to enhance your investment decisions: