Home > Comparison > Industrials > PNR vs ATS
The strategic rivalry between Pentair plc and ATS Corporation shapes the competitive landscape of the industrial machinery sector. Pentair, a global leader in water solutions, combines capital-intensive manufacturing with diversified product lines. ATS stands out as a specialized automation systems provider, emphasizing engineering and digital integration. This analysis contrasts their operational models to identify which offers superior risk-adjusted returns for a diversified portfolio in 2026.
Table of contents
Companies Overview
Pentair plc and ATS Corporation stand as pivotal industrial machinery players with distinct global footprints and market approaches.
Pentair plc: Global Water Solutions Leader
Pentair plc dominates water treatment and fluid management worldwide. It generates revenue via two segments: Consumer Solutions, which focuses on residential and commercial pool equipment and water filtration, and Industrial & Flow Technologies, offering pumps, valves, and filtration systems for diverse applications. In 2026, Pentair sharpened its strategy on expanding advanced membrane filtration and wastewater treatment technologies to address growing environmental demands.
ATS Corporation: Automation Systems Specialist
ATS Corporation excels in designing and servicing automated manufacturing and assembly systems across multiple industries. Its revenue stems from automation products, engineering design, contract manufacturing, and digital factory floor solutions that enhance operational efficiency. In 2026, ATS prioritized integrating connected factory management systems to unlock sustainable production improvements and reduce downtime for clients in life sciences and transportation.
Strategic Collision: Similarities & Divergences
Both firms operate in industrial machinery but diverge sharply in focus: Pentair pursues a product-driven water solutions ecosystem, while ATS champions a service-oriented automation platform. Their primary battleground lies in industrial efficiency—fluid management versus smart manufacturing. Investors encounter Pentair’s stable water infrastructure profile versus ATS’s growth-oriented automation innovation, reflecting contrasting risk-reward dynamics.
Income Statement Comparison
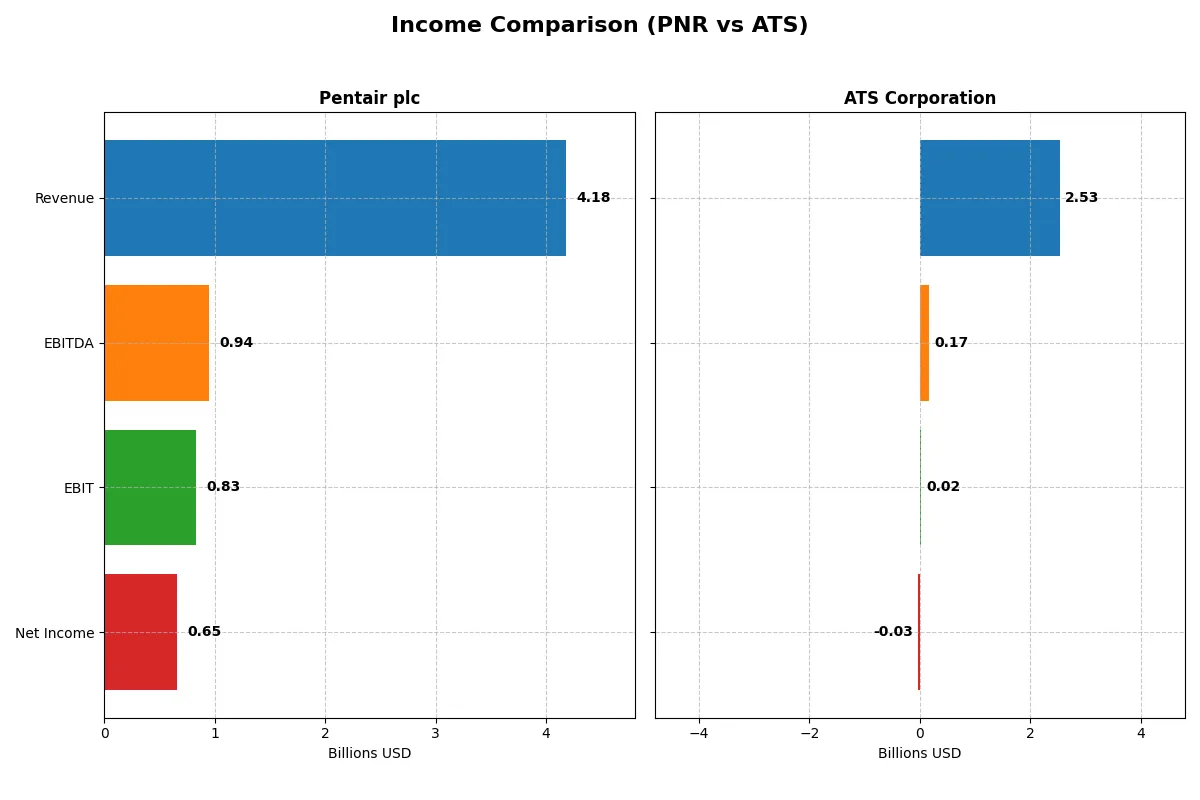
This data dissects the core profitability and scalability of both corporate engines to reveal who dominates the bottom line:
| Metric | Pentair plc (PNR) | ATS Corporation (ATS) |
|---|---|---|
| Revenue | 4.18B | 2.53B |
| Cost of Revenue | 2.49B | 1.89B |
| Operating Expenses | 833M | 637M |
| Gross Profit | 1.69B | 647M |
| EBITDA | 944M | 168M |
| EBIT | 826M | 15M |
| Interest Expense | 69M | 98M |
| Net Income | 654M | -28M |
| EPS | 3.99 | -0.29 |
| Fiscal Year | 2025 | 2025 |
Income Statement Analysis: The Bottom-Line Duel
This income statement comparison reveals which company runs a more efficient and profitable business engine through recent financial results.
Pentair plc Analysis
Pentair’s revenue grew modestly to $4.18B in 2025, with net income rising to $654M, reflecting solid profitability. Its gross margin of 40.5% and net margin near 15.7% remain favorable, demonstrating strong cost control and operational efficiency. The company shows momentum with a 5.9% EPS growth and consistent margin expansion.
ATS Corporation Analysis
ATS’s revenue declined sharply by 16.5% to CAD 2.53B in 2025, resulting in a net loss of CAD 28M. Despite a stable gross margin of 25.5%, the net margin fell below zero, signaling weak bottom-line performance. EBIT margin collapsed to 0.6%, reflecting deteriorating operational efficiency and heightened risk.
Margin Strength vs. Top-Line Volatility
Pentair outperforms ATS with superior margins, steady revenue growth, and positive earnings momentum. ATS faces significant margin compression and net losses amid falling sales. For investors prioritizing consistent profitability and efficiency, Pentair’s profile offers greater appeal and resilience in 2026.
Financial Ratios Comparison
These vital ratios act as a diagnostic tool to expose the underlying fiscal health, valuation premiums, and capital efficiency of the companies compared below:
| Ratios | Pentair plc (PNR) | ATS Corporation (ATS) |
|---|---|---|
| ROE | 16.90% | -1.64% |
| ROIC | 12.46% | 0.09% |
| P/E | 26.14 | -125.28 |
| P/B | 4.42 | 2.06 |
| Current Ratio | 1.61 | 1.69 |
| Quick Ratio | 0.95 | 1.41 |
| D/E (Debt-to-Equity) | 0.42 | 1.00 |
| Debt-to-Assets | 23.86% | 36.79% |
| Interest Coverage | 12.36 | 0.09 |
| Asset Turnover | 0.61 | 0.55 |
| Fixed Asset Turnover | 11.08 | 5.66 |
| Payout ratio | 25.13% | 0% |
| Dividend yield | 0.96% | 0% |
| Fiscal Year | 2025 | 2025 |
Efficiency & Valuation Duel: The Vital Signs
Financial ratios act as a company’s DNA, uncovering hidden risks and operational strengths that drive long-term value creation.
Pentair plc
Pentair delivers solid profitability with a 16.9% ROE and a healthy 15.66% net margin, showcasing operational efficiency. However, its valuation appears stretched, with a P/E of 26.14 and P/B of 4.42, above typical sector averages. Shareholder returns include a modest 0.96% dividend yield, signaling cautious capital distribution amid reinvestment in R&D and growth.
ATS Corporation
ATS struggles with negative profitability metrics: -1.64% ROE and -1.11% net margin, indicating operational challenges. While its P/E is technically favorable due to negative earnings, this masks risks from poor earnings quality and weak interest coverage at 0.16. ATS pays no dividend, focusing resources on stabilizing operations rather than rewarding shareholders currently.
Premium Valuation vs. Operational Safety
Pentair offers a favorable profitability and operational profile despite a premium valuation, while ATS reflects riskier fundamentals and operational inefficiencies. Pentair’s balanced capital allocation suits investors prioritizing stable returns. ATS may appeal only to those seeking turnaround potential with higher risk tolerance.
Which one offers the Superior Shareholder Reward?
Pentair plc (PNR) offers a more attractive shareholder reward than ATS Corporation (ATS) in 2026. PNR delivers a 0.96% dividend yield with a disciplined 25% payout ratio, well-covered by strong free cash flow. Its steady buyback program enhances total return sustainably. ATS pays no dividend and posts negative free cash flow due to heavy capex, relying solely on reinvestment for growth. Its buyback activity is minimal and financially constrained by weak operating cash flow and high leverage. I conclude PNR’s balanced distribution model supports superior long-term value creation and total return.
Comparative Score Analysis: The Strategic Profile
The radar chart reveals the fundamental DNA and trade-offs of Pentair plc and ATS Corporation, highlighting their core financial strengths and weaknesses:
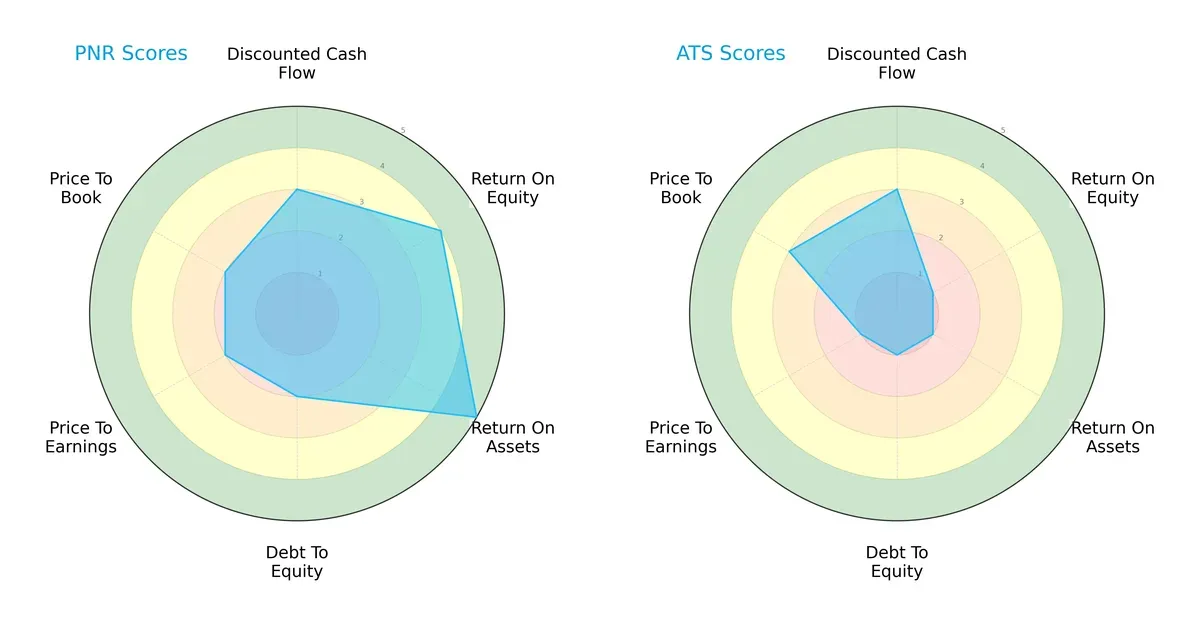
Pentair shows a balanced profile with strong ROE (4) and ROA (5), signaling efficient asset utilization and shareholder returns. ATS struggles with weak profitability metrics (ROE and ROA scores of 1) and high financial risk (debt-to-equity score of 1). Pentair’s moderate valuation scores (PE and PB at 2) suggest cautious market pricing, while ATS’s valuation is less favorable despite a slightly better PB score (3). Overall, Pentair dominates with operational efficiency; ATS relies on niche valuation appeal but faces systemic financial challenges.
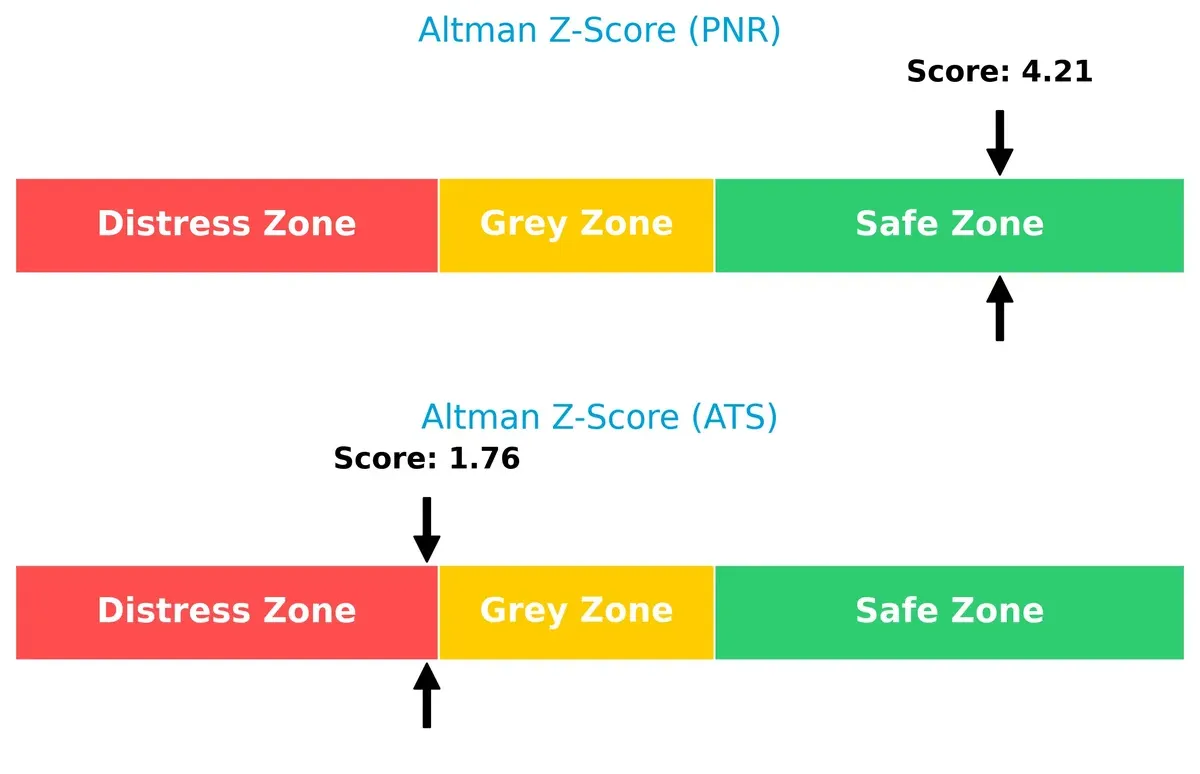
Bankruptcy Risk: Solvency Showdown
Pentair’s Altman Z-Score of 4.21 places it firmly in the safe zone, signaling strong solvency and low bankruptcy risk. ATS’s 1.76 score lands in the distress zone, indicating significant financial vulnerability and elevated default risk in this cycle:
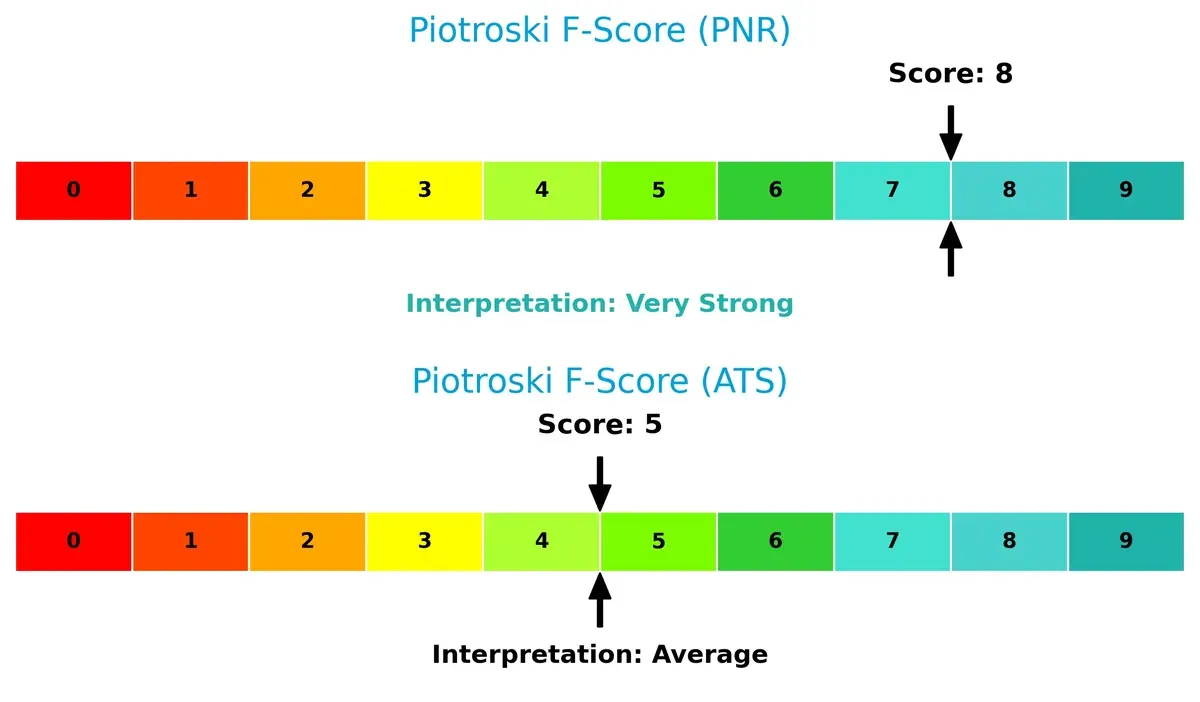
Financial Health: Quality of Operations
Pentair’s Piotroski F-Score of 8 reflects peak financial health and robust internal fundamentals. ATS’s score of 5 suggests average health with notable red flags in profitability and liquidity compared to Pentair:
How are the two companies positioned?
This section dissects the operational DNA of Pentair and ATS by comparing their revenue distribution and internal strengths and weaknesses. The goal is to confront their economic moats and identify which model offers the most resilient competitive advantage today.
Revenue Segmentation: The Strategic Mix
The following comparison dissects how Pentair plc and ATS Corporation diversify their income streams and reveals their primary sector bets:
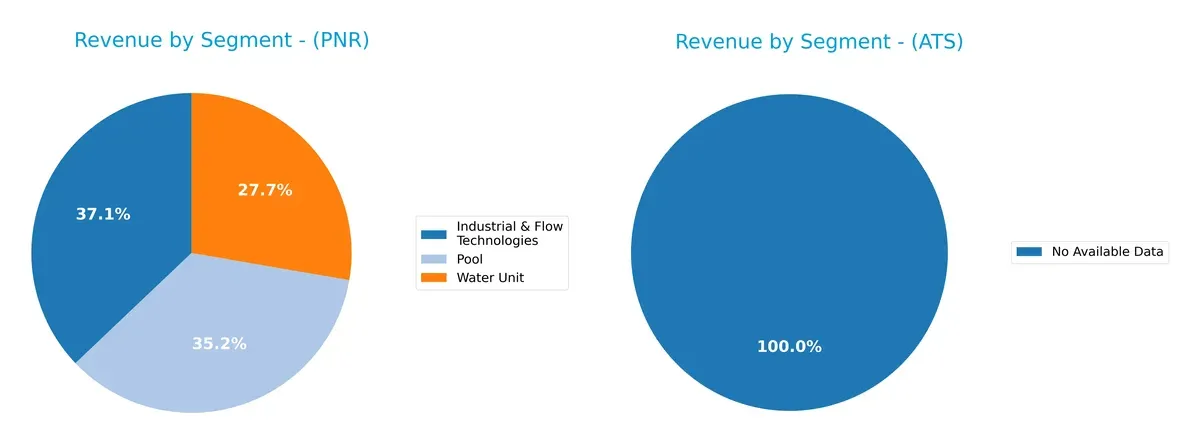
Pentair plc shows a balanced revenue mix in 2024, with Industrial & Flow Technologies at $1.5B, Pool at $1.4B, and Water Unit at $1.1B. This diversification reduces concentration risk and leverages multiple water-related ecosystems. ATS Corporation lacks disclosed segment data, preventing a direct comparison. Pentair’s multi-segment approach signals strategic resilience versus a single-segment reliance that would heighten vulnerability in volatile markets.
Strengths and Weaknesses Comparison
This table compares the Strengths and Weaknesses of Pentair plc and ATS Corporation:
Pentair plc Strengths
- Favorable net margin of 15.66%
- Strong ROE at 16.9%
- Low debt-to-assets ratio of 23.86%
- Current ratio of 1.61 indicates liquidity
- Diverse revenue across Industrial, Pool, and Water segments
- Significant US and global sales presence
ATS Corporation Strengths
- Favorable price-to-earnings (PE) ratio suggests market opportunity
- Strong current ratio at 1.69 and quick ratio at 1.41 show liquidity
- Favorable fixed asset turnover of 5.66 indicates operational efficiency
- Geographic exposure includes US, Germany, Italy, and other European markets
Pentair plc Weaknesses
- Unfavorable PE of 26.14 and high PB of 4.42 may indicate overvaluation
- Dividend yield under 1% is low for income-focused investors
- Quick ratio at 0.95 is neutral, suggesting limited immediate liquidity
- Asset turnover neutral at 0.61 may signal moderate asset use efficiency
ATS Corporation Weaknesses
- Negative net margin (-1.11%) and ROE (-1.64%) indicate unprofitability
- Very low ROIC of 0.09% raises concerns on capital returns
- High debt-to-equity ratio (1.0) with low interest coverage (0.16) signals financial risk
- Zero dividend yield limits income for shareholders
Pentair’s strengths lie in solid profitability, diversified revenue streams, and healthy liquidity, supporting stable operations. ATS faces profitability and financial leverage challenges despite decent liquidity and geographic reach, which may constrain its strategic options.
The Moat Duel: Analyzing Competitive Defensibility
A structural moat is the only shield protecting long-term profits from relentless competition and market pressures:
Pentair plc: Resilient Water Solutions Moat
Pentair’s moat stems from its intangible assets and diversified product portfolio, reflected in a steady 15.7% net margin and 3.4% ROIC above WACC. New water treatment innovations could reinforce this advantage in 2026.
ATS Corporation: Automation Efficiency Struggles
ATS relies on engineering expertise but faces a weak moat, with ROIC falling well below WACC and negative net margins. Its automation services face disruption risks, and growth opportunities appear limited this year.
Value Creation vs. Value Destruction: The Moat Verdict
Pentair holds the deeper moat with consistent value creation and margin stability. ATS struggles with profitability and declining ROIC, making Pentair better positioned to defend market share in 2026.
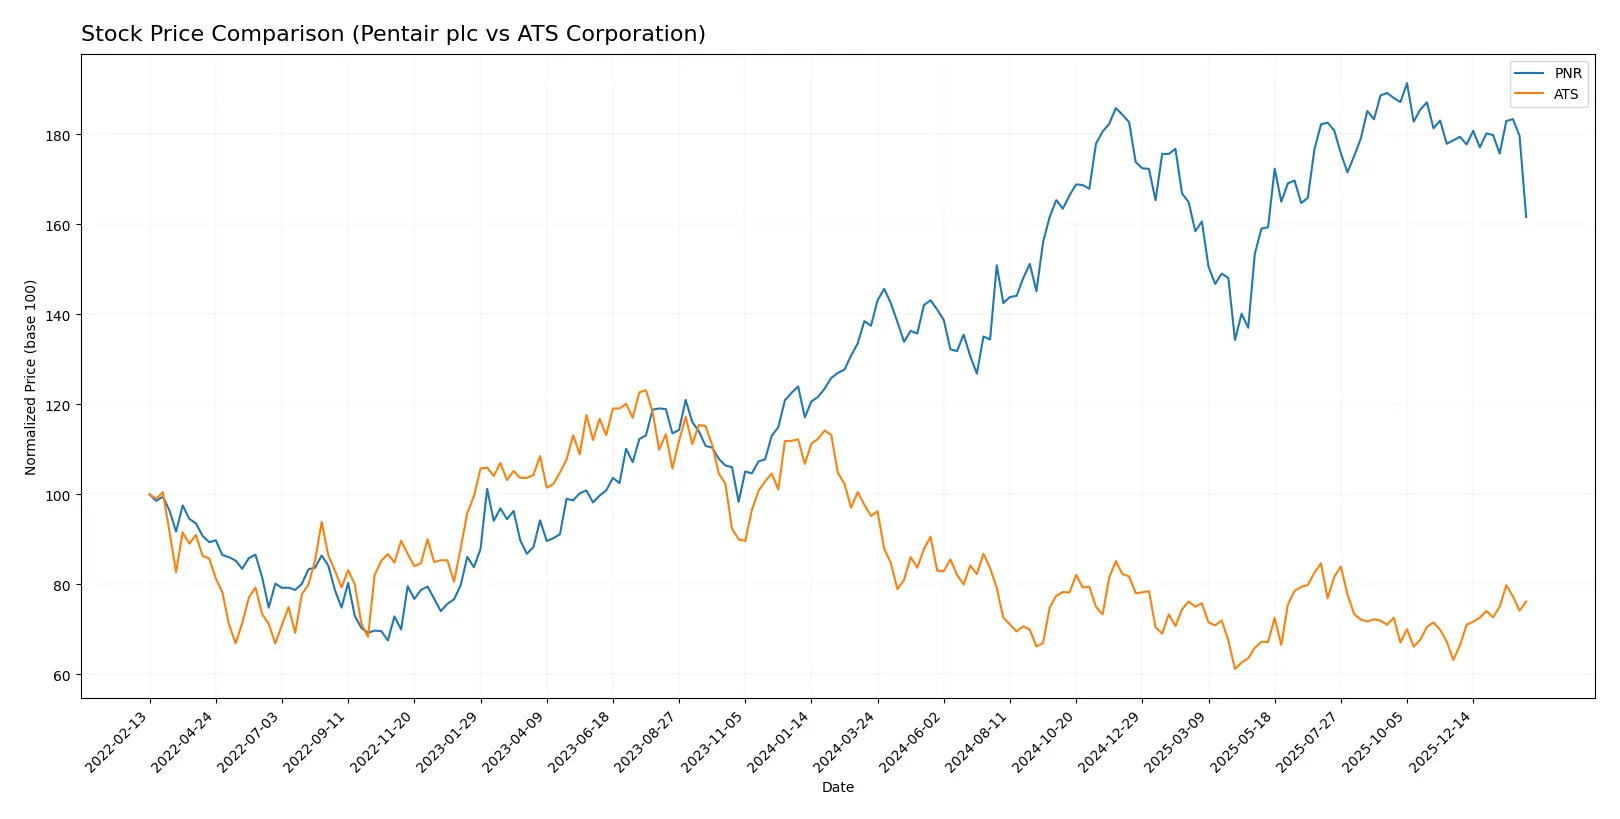
Which stock offers better returns?
Over the past 12 months, Pentair plc showed a strong overall gain despite recent weakness, while ATS Corporation faced a prolonged decline with a recent rebound in momentum.
Trend Comparison
Pentair plc’s stock rose 17.57% over 12 months, marking a bullish trend with decelerating gains and a high volatility of 10.7%. The recent 2.5-month period shows a 9.53% decline, signaling short-term weakness.
ATS Corporation’s stock declined 19.97% over the year, indicating a bearish trend with accelerating losses and lower volatility at 2.71%. Recently, it rebounded 20.51%, reflecting strong short-term recovery momentum.
Comparing both, Pentair delivered the highest annual market performance despite recent softness. ATS shows a late-stage recovery but remains down over the full year.
Target Prices
Analysts present a clear target consensus for both Pentair plc and ATS Corporation.
| Company | Target Low | Target High | Consensus |
|---|---|---|---|
| Pentair plc | 90 | 135 | 118.56 |
| ATS Corporation | 34 | 34 | 34 |
Pentair’s consensus target of 118.56 exceeds its current price of 94.65, indicating upside potential. ATS trades below its 34 consensus, suggesting room for price appreciation.

Don’t Let Luck Decide Your Entry Point
Optimize your entry points with our advanced ProRealTime indicators. You’ll get efficient buy signals with precise price targets for maximum performance. Start outperforming now!
How do institutions grade them?
Here is a summary of institutional grades for Pentair plc and ATS Corporation:
Pentair plc Grades
The latest grades from major institutions for Pentair plc are as follows:
| Grading Company | Action | New Grade | Date |
|---|---|---|---|
| Citigroup | Maintain | Buy | 2026-02-04 |
| Oppenheimer | Maintain | Outperform | 2026-02-04 |
| JP Morgan | Maintain | Overweight | 2026-01-16 |
| Citigroup | Maintain | Buy | 2026-01-12 |
| BNP Paribas Exane | Downgrade | Underperform | 2026-01-07 |
| TD Cowen | Downgrade | Sell | 2026-01-05 |
| Jefferies | Upgrade | Buy | 2025-12-10 |
| Barclays | Downgrade | Equal Weight | 2025-12-04 |
| Oppenheimer | Maintain | Outperform | 2025-11-20 |
| Barclays | Maintain | Overweight | 2025-10-22 |
ATS Corporation Grades
Recent institutional grades for ATS Corporation show the following:
| Grading Company | Action | New Grade | Date |
|---|---|---|---|
| JP Morgan | Maintain | Neutral | 2026-01-16 |
| JP Morgan | Maintain | Neutral | 2024-08-13 |
| Goldman Sachs | Maintain | Sell | 2024-08-13 |
| JP Morgan | Maintain | Neutral | 2024-05-24 |
Which company has the best grades?
Pentair plc holds stronger and more positive grades than ATS Corporation. Pentair’s multiple Buy and Outperform ratings suggest greater institutional confidence, while ATS mainly receives Neutral or Sell grades. This contrast could influence investor sentiment and portfolio positioning.
Risks specific to each company
The following categories identify the critical pressure points and systemic threats facing both firms in the 2026 market environment:
1. Market & Competition
Pentair plc
- Operates globally in water solutions with strong brand portfolios, facing intense competition in industrial machinery.
ATS Corporation
- Focuses on automation solutions with broad industry exposure but struggles with profitability and market positioning.
2. Capital Structure & Debt
Pentair plc
- Maintains moderate debt with a favorable debt-to-equity of 0.42 and strong interest coverage at 11.9x.
ATS Corporation
- Carries higher leverage with a debt-to-equity near 1.0 and very weak interest coverage at 0.16x, signaling financial risk.
3. Stock Volatility
Pentair plc
- Beta at 1.22 suggests moderate market sensitivity, typical for industrial machinery stocks.
ATS Corporation
- Slightly higher beta of 1.26 indicates more volatility and risk exposure in market swings.
4. Regulatory & Legal
Pentair plc
- Faces regulations tied to water treatment and environmental standards globally.
ATS Corporation
- Exposed to complex regulatory frameworks across automation and manufacturing sectors, including safety standards.
5. Supply Chain & Operations
Pentair plc
- Diverse product lines in water and flow technologies reduce supply chain concentration risk.
ATS Corporation
- Heavy reliance on integrated automation and manufacturing may expose it to operational disruptions and delays.
6. ESG & Climate Transition
Pentair plc
- Strong alignment with water sustainability and environmental management initiatives.
ATS Corporation
- ESG efforts less pronounced; automation focus requires scaling sustainable practices amid energy concerns.
7. Geopolitical Exposure
Pentair plc
- Global footprint includes exposure to UK and European markets with geopolitical uncertainties post-Brexit.
ATS Corporation
- Operating from Canada with North American focus but also exposed to global supply chains and trade tensions.
Which company shows a better risk-adjusted profile?
Pentair faces a manageable competitive and financial risk profile, with solid liquidity and strong financial health metrics. ATS struggles with profitability, high leverage, and weak interest coverage, raising red flags about its financial stability. Pentair’s Altman Z-Score of 4.21 places it firmly in the safe zone, while ATS’s 1.76 signals distress risk. Pentair’s diversified operations and favorable debt structure give it a clearly superior risk-adjusted profile.
Final Verdict: Which stock to choose?
Pentair’s superpower lies in its consistent value creation through efficient capital use and strong profitability. Its declining ROIC trend is a point of vigilance, signaling the need for careful monitoring. Pentair best suits portfolios aiming for steady, long-term growth with moderate risk tolerance.
ATS commands a strategic moat through its operational niche but currently struggles with profitability and value destruction. Its stronger liquidity and recent positive price momentum provide a safety cushion compared to Pentair’s higher valuation multiples. ATS fits investors who seek turnaround opportunities and can tolerate higher volatility.
If you prioritize resilient returns and proven capital efficiency, Pentair outshines ATS despite its softening ROIC trend. However, if you seek speculative growth with a focus on recovery potential, ATS offers better stability in liquidity and recent price action, albeit with significant execution risks.
Disclaimer: Investment carries a risk of loss of initial capital. The past performance is not a reliable indicator of future results. Be sure to understand risks before making an investment decision.
Go Further
I encourage you to read the complete analyses of Pentair plc and ATS Corporation to enhance your investment decisions: