Parsons Corporation (PSN) and ATS Corporation (ATS) are two key players in the industrial machinery sector, each driving innovation in automation and critical infrastructure solutions. Parsons focuses on defense, cybersecurity, and smart infrastructure, while ATS excels in automated manufacturing systems and digital factory solutions. Comparing these companies reveals distinct approaches to growth and technology. In this article, I will help you determine which company offers the best investment potential for your portfolio.
Table of contents
Companies Overview
I will begin the comparison between Parsons Corporation and ATS Corporation by providing an overview of these two companies and their main differences.
Parsons Corporation Overview
Parsons Corporation specializes in integrated solutions and services for defense, intelligence, and critical infrastructure markets across North America, the Middle East, and internationally. With a workforce of 20,000 employees, Parsons operates through Federal Solutions and Critical Infrastructure segments, delivering cybersecurity, space, missile defense, and technology services. Founded in 1944 and headquartered in Centreville, Virginia, Parsons holds a market cap of $7.5B and is recognized for its broad government and infrastructure engagements.
ATS Corporation Overview
ATS Corporation offers global automation solutions including designing, building, and servicing automated manufacturing and assembly systems. Headquartered in Cambridge, Canada, and employing 7,500 staff, ATS supports industries like life sciences, transportation, and energy with engineering, software, and digital factory management solutions. Founded in 1978, it has a market cap of $2.8B and trades on the NYSE as an American Depositary Receipt, focusing on automation and manufacturing efficiency.
Key similarities and differences
Both Parsons and ATS operate within the industrial machinery sector and serve diverse markets with technology-driven solutions. Parsons emphasizes defense, intelligence, and critical infrastructure projects, while ATS focuses on automation and manufacturing systems across commercial industries. Parsons has a larger market cap and workforce, reflecting its extensive government contracts, whereas ATS concentrates on automation innovation and digital solutions, illustrating distinct but complementary industrial business models.
Income Statement Comparison
The following table compares key income statement metrics for Parsons Corporation and ATS Corporation based on their most recent fiscal year financials.
| Metric | Parsons Corporation (PSN) | ATS Corporation (ATS) |
|---|---|---|
| Market Cap | 7.47B USD | 2.82B CAD |
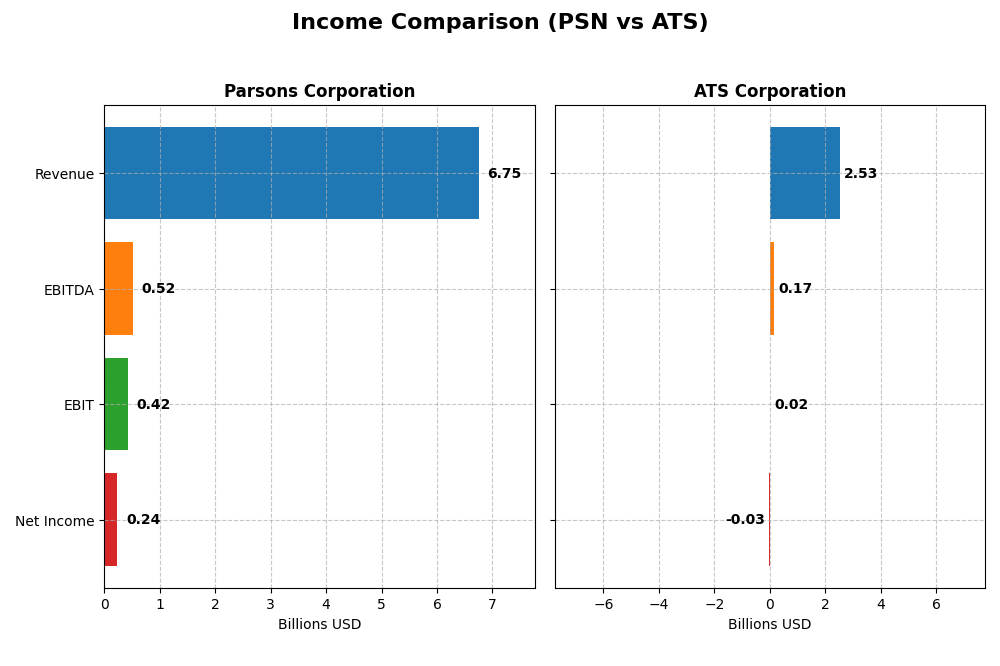
| Revenue | 6.75B USD | 2.53B CAD |
| EBITDA | 518M USD | 168M CAD |
| EBIT | 419M USD | 15.3M CAD |
| Net Income | 238M USD | -28.0M CAD |
| EPS | 2.21 USD | -0.29 CAD |
| Fiscal Year | 2024 | 2025 |
Income Statement Interpretations
Parsons Corporation
Parsons Corporation shows a strong upward trend in revenue, growing 72.25% over five years to 6.75B USD in 2024, with net income increasing 138.53% to 237.99M USD. Margins remain stable with a favorable gross margin of 20.83%, while net margin is neutral at 3.48%. The 2024 fiscal year saw robust growth, with revenue up 24%, EBIT rising 42%, and net margins improving, signaling operational efficiency gains.
ATS Corporation
ATS Corporation’s revenue grew 77.15% over the overall period, reaching 2.53B CAD in 2025. However, net income declined sharply by 143.76%, resulting in a net loss of 28.05M CAD in 2025. Gross margin remains favorable at 25.53%, but EBIT margin is low at 0.6%, and net margin is unfavorable at -1.11%. The latest year reflects a revenue drop of 16.47% and a steep EBIT decline of 95.18%, indicating recent operational challenges.
Which one has the stronger fundamentals?
Parsons Corporation exhibits stronger fundamentals with consistent revenue and net income growth, favorable margin trends, and positive one-year performance indicators. In contrast, ATS Corporation, despite solid revenue growth over the long term, faces significant profitability declines and negative net margins recently. These factors signal more favorable income statement health for Parsons compared to ATS.
Financial Ratios Comparison
This table presents the most recent financial ratios for Parsons Corporation (PSN) and ATS Corporation (ATS), reflecting their operational efficiency, profitability, liquidity, and leverage as of their latest fiscal periods.
| Ratios | Parsons Corporation (PSN) FY 2024 | ATS Corporation (ATS) FY 2025* |
|---|---|---|
| ROE | 9.7% | -1.6% |
| ROIC | 8.3% | 0.1% |
| P/E | 41.7 | -125.3 |
| P/B | 4.06 | 2.06 |
| Current Ratio | 1.29 | 1.69 |
| Quick Ratio | 1.29 | 1.41 |
| D/E (Debt-to-Equity) | 0.59 | 1.00 |
| Debt-to-Assets | 25.9% | 36.8% |
| Interest Coverage | 8.30 | 0.09 |
| Asset Turnover | 1.23 | 0.55 |
| Fixed Asset Turnover | 25.51 | 5.66 |
| Payout Ratio | 0% | 0% |
| Dividend Yield | 0% | 0% |
*Note: ATS data is reported for the fiscal year ending March 2025, reflecting the most recent available period. All ratios are based on reported currencies (USD for PSN, CAD for ATS) and reflect the companies’ latest fiscal results.
Interpretation of the Ratios
Parsons Corporation
Parsons shows a mix of favorable and unfavorable ratios, with strong asset turnover (1.23) and low debt to assets (25.89%), indicating operational efficiency and moderate leverage. However, its net margin (3.48%) and ROE (9.73%) are unfavorable, suggesting limited profitability. Parsons does not pay dividends, reflecting a possible reinvestment or growth strategy.
ATS Corporation
ATS exhibits several unfavorable indicators, including negative net margin (-1.11%) and ROE (-1.64%), highlighting profitability challenges. Its interest coverage is very low (0.16), signaling financial stress. While the current ratio (1.69) and quick ratio (1.41) are favorable, ATS also does not pay dividends, possibly due to negative income or reinvestment priorities.
Which one has the best ratios?
Parsons Corporation holds a slightly favorable overall ratio profile, balancing operational efficiency and manageable debt, despite weaker profitability metrics. ATS’s ratios lean slightly unfavorable, burdened by losses and weak coverage ratios. Thus, Parsons presents a more stable financial stance compared to ATS based on the given data.
Strategic Positioning
This section compares the strategic positioning of Parsons Corporation and ATS Corporation, including market position, key segments, and exposure to technological disruption:
Parsons Corporation
- Leading in defense and critical infrastructure, facing moderate competitive pressure in specialized markets.
- Key segments: Federal Solutions and Critical Infrastructure, driven by defense contracts and infrastructure projects.
- Significant exposure through cybersecurity, space, and missile defense technology services in government and critical sectors.
ATS Corporation
- Focused on automation solutions globally, facing higher competitive pressure with broader industrial exposure.
- Key segments include automation product development and services across life sciences, transportation, and energy.
- Exposure through software and digital factory automation, requiring adaptation to rapid technological changes.
Parsons Corporation vs ATS Corporation Positioning
Parsons adopts a diversified approach across defense and infrastructure with specialized government contracts, offering stability but requiring advanced tech capabilities. ATS concentrates on automation solutions in multiple industries, giving broader market reach but higher competitive volatility.
Which has the best competitive advantage?
Parsons shows a very favorable moat with growing ROIC above WACC, indicating durable competitive advantage. ATS has a very unfavorable moat with declining ROIC below WACC, signaling value destruction and weakening competitive position.
Stock Comparison
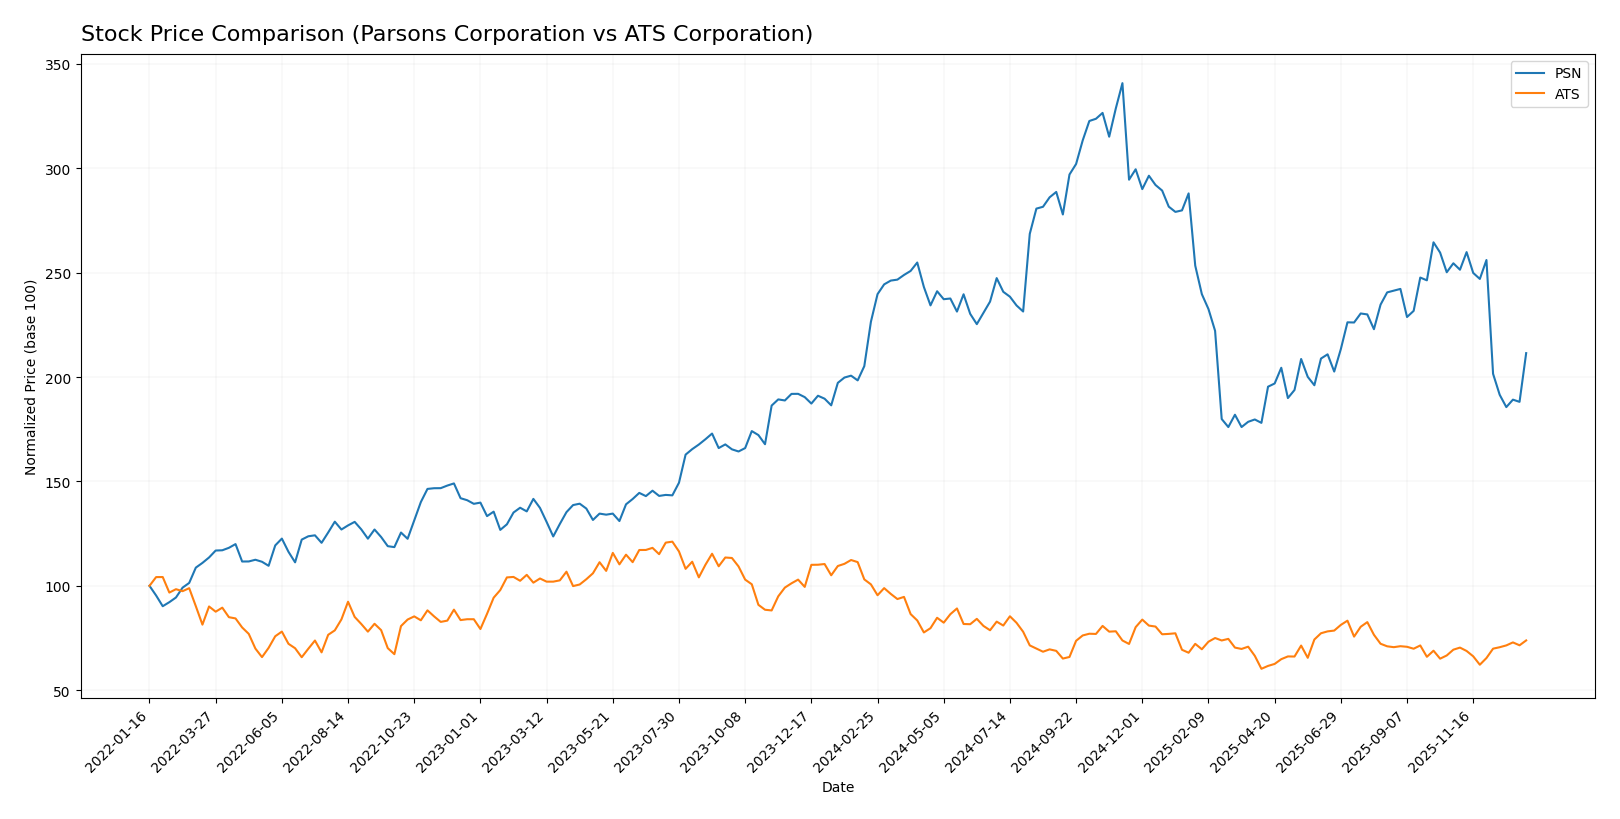
The stock prices of Parsons Corporation (PSN) and ATS Corporation (ATS) have exhibited contrasting movements over the past 12 months, with PSN showing a bearish trend and ATS experiencing significant price declines followed by a recent recovery.
Trend Analysis
Parsons Corporation (PSN) stock trended bearish over the past year, declining by 6.64% with decelerating losses. It showed a high volatility of 12.98, peaking at 112.69 and bottoming at 58.22. Recent months revealed an accelerated downturn of -16.91%.
ATS Corporation (ATS) also faced a bearish trend over 12 months, dropping 26.66% with accelerating losses and lower volatility of 3.24. Its price ranged between 39.27 and 23.5. However, recent data indicates a slight bullish reversal with a 6.39% gain.
Comparing both, ATS delivered the lowest overall market performance with a sharper yearly decline, despite its recent modest recovery outperforming PSN’s continued negative trend.
Target Prices
The current analyst consensus presents a clear outlook on target prices for Parsons Corporation and ATS Corporation.
| Company | Target High | Target Low | Consensus |
|---|---|---|---|
| Parsons Corporation | 107 | 70 | 85 |
| ATS Corporation | 34 | 34 | 34 |
Analysts expect Parsons Corporation’s stock to appreciate from its current price of $69.93 to a consensus target of $85, indicating moderate upside potential. ATS Corporation’s consensus target of $34 suggests limited upside from its current $28.80 price, reflecting more cautious expectations.
Analyst Opinions Comparison
This section compares analysts’ ratings and grades for Parsons Corporation (PSN) and ATS Corporation (ATS):
Rating Comparison
PSN Rating
- Rating: A-, classified as Very Favorable by analysts.
- Discounted Cash Flow Score: 5, indicating a Very Favorable valuation outlook.
- ROE Score: 4, considered Favorable for profitability efficiency.
- ROA Score: 4, Favorable for effective asset utilization.
- Debt To Equity Score: 2, Moderate financial risk with manageable leverage.
- Overall Score: 4, Favorable overall financial standing.
ATS Rating
- Rating: C, also noted as Very Favorable in status.
- Discounted Cash Flow Score: 3, showing a Moderate valuation outlook.
- ROE Score: 1, rated Very Unfavorable, signaling poor profitability.
- ROA Score: 1, Very Unfavorable, indicating inefficient asset use.
- Debt To Equity Score: 1, Very Unfavorable, reflecting high financial risk.
- Overall Score: 2, Moderate overall financial standing.
Which one is the best rated?
Based on the provided data, Parsons Corporation (PSN) holds stronger ratings across all key financial metrics, including a higher overall score and better scores in cash flow, profitability, and debt management compared to ATS Corporation (ATS).
Scores Comparison
Here is a comparison of the financial health scores for Parsons Corporation and ATS Corporation:
PSN Scores
- Altman Z-Score: 3.59, indicating a safe financial zone with low bankruptcy risk.
- Piotroski Score: 6, reflecting average financial strength and value potential.
ATS Scores
- Altman Z-Score: 1.68, in the distress zone, signaling high bankruptcy risk.
- Piotroski Score: 3, considered very weak financial strength and investment appeal.
Which company has the best scores?
Parsons Corporation shows stronger financial health, with a safe Altman Z-Score and average Piotroski Score, compared to ATS’s distress zone and very weak Piotroski Score, based strictly on the data provided.
Grades Comparison
Here is the comparison of the latest reliable grades and ratings for Parsons Corporation and ATS Corporation:
Parsons Corporation Grades
The following table summarizes recent grades assigned by reputable grading companies for Parsons Corporation:
| Grading Company | Action | New Grade | Date |
|---|---|---|---|
| B of A Securities | Maintain | Buy | 2025-12-30 |
| Stifel | Maintain | Buy | 2025-12-23 |
| Jefferies | Maintain | Hold | 2025-12-11 |
| TD Cowen | Upgrade | Buy | 2025-12-10 |
| Baird | Maintain | Outperform | 2025-12-08 |
| Truist Securities | Maintain | Buy | 2025-12-08 |
| Keybanc | Maintain | Overweight | 2025-12-08 |
| Truist Securities | Maintain | Buy | 2025-12-05 |
| William Blair | Upgrade | Outperform | 2025-11-20 |
| Keybanc | Maintain | Overweight | 2025-10-20 |
Overall, Parsons Corporation shows a strong positive consensus with multiple buy and outperform ratings maintained or upgraded recently.
ATS Corporation Grades
The table below shows recent grades from credible sources for ATS Corporation:
| Grading Company | Action | New Grade | Date |
|---|---|---|---|
| JP Morgan | Maintain | Neutral | 2024-08-13 |
| Goldman Sachs | Maintain | Sell | 2024-08-13 |
| JP Morgan | Maintain | Neutral | 2024-05-24 |
ATS Corporation’s grades indicate a more cautious stance with neutral and sell ratings maintained over the past two years.
Which company has the best grades?
Parsons Corporation holds significantly better grades, with a consensus around “Buy” and several upgrades to outperform. ATS Corporation’s ratings remain neutral to sell, reflecting more risk or uncertainty. This disparity may influence investor confidence and portfolio decisions accordingly.
Strengths and Weaknesses
Below is a comparative overview of the key strengths and weaknesses of Parsons Corporation (PSN) and ATS Corporation (ATS) based on their recent performance and financial metrics:
| Criterion | Parsons Corporation (PSN) | ATS Corporation (ATS) |
|---|---|---|
| Diversification | Strong with significant revenues from Critical Infrastructure ($2.74B) and Federal Solutions ($4.01B) segments | Limited diversification data available; focused mainly on core operations |
| Profitability | Moderate net margin (3.48%) and ROIC (8.28%), but creating value with growing ROIC and favorable WACC | Negative net margin (-1.11%) and very low ROIC (0.09%) indicating value destruction |
| Innovation | Demonstrates durable competitive advantage with increasing profitability (Very Favorable moat) | Declining profitability and ROIC trend; innovation impact appears weak (Very Unfavorable moat) |
| Global presence | Strong federal and critical infrastructure contracts suggest a broad presence | Less clear global footprint and smaller asset turnover ratio (0.55) |
| Market Share | High asset turnover (1.23) and fixed asset turnover (25.51) indicate efficient use of assets | Lower asset turnover and interest coverage ratio indicate operational challenges |
In summary, Parsons Corporation exhibits a durable competitive advantage with a growing ROIC and diversified revenue streams, making it a more favorable investment. ATS Corporation faces profitability and operational challenges with declining returns, signaling caution for investors.
Risk Analysis
Below is a comparison of key risks for Parsons Corporation (PSN) and ATS Corporation (ATS) based on the most recent data from 2024-2025:
| Metric | Parsons Corporation (PSN) | ATS Corporation (ATS) |
|---|---|---|
| Market Risk | Beta 0.66 – Lower volatility, less sensitive to market swings | Beta 1.27 – Higher volatility, more sensitive to market swings |
| Debt level | Debt-to-Equity 0.59 (neutral), Debt-to-Assets 26% (favorable) | Debt-to-Equity 1.0 (neutral), Debt-to-Assets 37% (neutral) |
| Regulatory Risk | Moderate – Defense contracts subject to government regulations | Moderate – Automation industry with some regulatory compliance needs |
| Operational Risk | Moderate – Complex defense and infrastructure projects | Moderate to High – Automation system integration and servicing complexity |
| Environmental Risk | Moderate – Some exposure via infrastructure and environmental solutions | Moderate – Industrial machinery with potential environmental compliance issues |
| Geopolitical Risk | High – Exposure to government defense contracts and international projects | Moderate – Primarily commercial markets, less geopolitical exposure |
In synthesis, ATS faces higher market volatility and financial distress risk, reflected in its Altman Z-score in the distress zone and weak Piotroski score, indicating potential solvency concerns. Parsons is relatively stable with a safer Altman Z-score and stronger financial ratings but must manage geopolitical risks tied to defense contracts. Investors should weigh ATS’s operational challenges and financial fragility against Parsons’ steadier profile when managing portfolio risk.
Which Stock to Choose?
Parsons Corporation (PSN) shows a favorable income evolution with strong revenue and net income growth over 2020-2024. Its financial ratios are slightly favorable overall, highlighting solid profitability, moderate debt levels, and a very favorable rating of A-. PSN demonstrates a very favorable moat with ROIC exceeding WACC and growing profitability.
ATS Corporation (ATS) exhibits an unfavorable income statement trend, with declining net income and margins in recent years. Its financial ratios are slightly unfavorable, reflecting negative returns, high debt relative to equity, and a very unfavorable moat due to ROIC below WACC and decreasing profitability. ATS carries a moderate overall rating of C.
Investors seeking companies with durable competitive advantages and improving income statements might find PSN more aligned with their profile, while those with higher risk tolerance or value-focused approaches could interpret ATS’s recent struggles and valuation metrics differently. The choice could depend significantly on the investor’s risk appetite and investment strategy.
Disclaimer: Investment carries a risk of loss of initial capital. The past performance is not a reliable indicator of future results. Be sure to understand risks before making an investment decision.
Go Further
I encourage you to read the complete analyses of Parsons Corporation and ATS Corporation to enhance your investment decisions: