Home > Comparison > Industrials > OTIS vs ATS
The strategic rivalry between Otis Worldwide Corporation and ATS Corporation shapes the Industrials sector’s innovation and growth trajectory. Otis, a capital-intensive machinery leader specializing in elevators and escalators, contrasts with ATS’s automation solutions focus, blending engineering and software services. This analysis explores their divergent operational models to identify which offers superior risk-adjusted returns amid evolving industrial demands. Investors will gain clarity on the optimal corporate path for diversified portfolio inclusion.
Table of contents
Companies Overview
Otis Worldwide Corporation and ATS Corporation hold influential roles in the industrial machinery sector, shaping global automation and infrastructure.
Otis Worldwide Corporation: Global Elevator and Escalator Leader
Otis defines itself as a leading manufacturer and servicer of elevators and escalators worldwide. It generates revenue through two main streams: new equipment sales and ongoing maintenance services. In 2026, Otis emphasizes expanding its service network with 34,000 mechanics and upgrading infrastructure projects to solidify its competitive advantage in urban mobility solutions.
ATS Corporation: Automation Solutions Innovator
ATS Corporation specializes in designing and delivering automation and assembly systems across diverse industries. It earns revenue by providing end-to-end automation—from engineering and installation to after-sales support and digital factory solutions. The company focuses on enhancing operational efficiency via connected factory floor management, pushing its strategic edge in smart manufacturing and real-time data analytics.
Strategic Collision: Similarities & Divergences
Both companies compete within industrial machinery but diverge sharply in scope; Otis hinges on a service-heavy, product-installation model, while ATS leans on integrated automation and software-driven solutions. Their primary battleground is operational efficiency—Otis in infrastructure modernization, ATS in digital transformation of manufacturing. This contrast defines their distinct investment profiles: Otis offers stable, asset-backed growth; ATS presents dynamic exposure to automation technology trends.
Income Statement Comparison
This data dissects the core profitability and scalability of both corporate engines to reveal who dominates the bottom line:
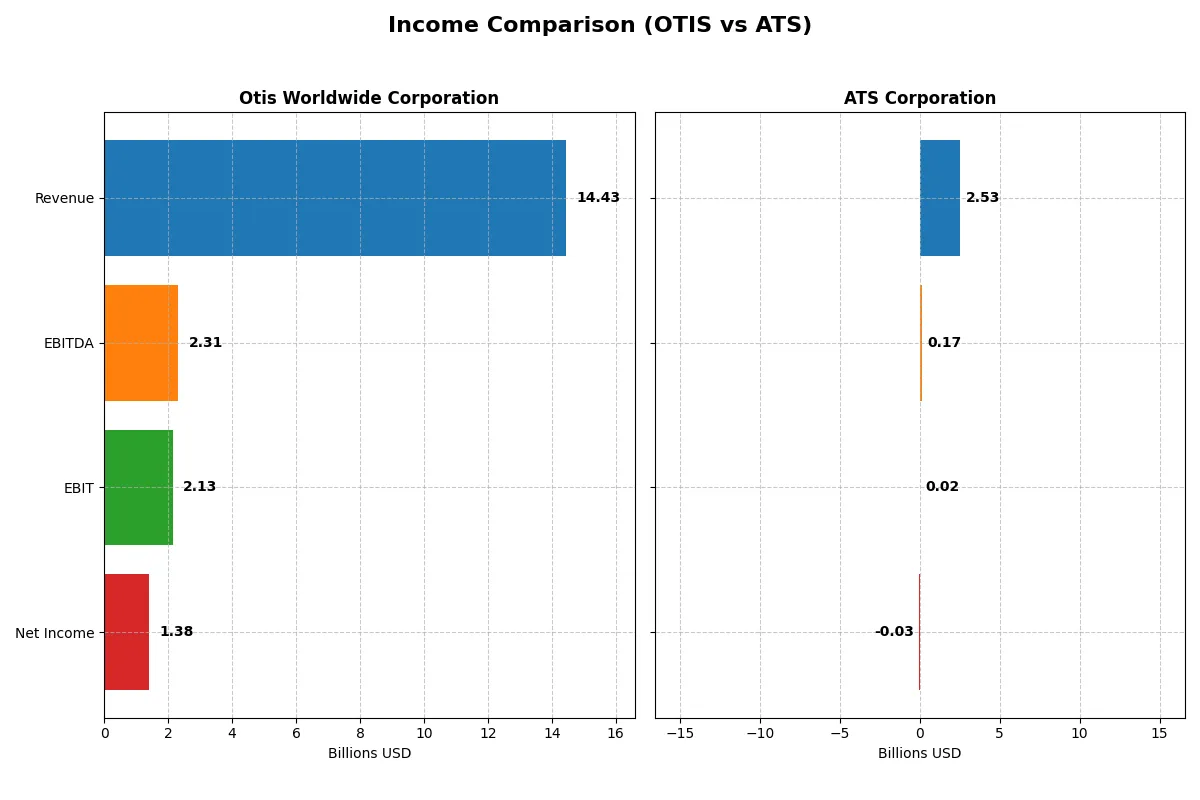
| Metric | Otis Worldwide Corporation (OTIS) | ATS Corporation (ATS) |
|---|---|---|
| Revenue | 14.43B | 2.53B |
| Cost of Revenue | 10.06B | 1.89B |
| Operating Expenses | 2.24B | 637M |
| Gross Profit | 4.37B | 647M |
| EBITDA | 2.31B | 168M |
| EBIT | 2.13B | 15.3M |
| Interest Expense | 196M | 98.2M |
| Net Income | 1.38B | -28.0M |
| EPS | 3.53 | -0.29 |
| Fiscal Year | 2025 | 2025 |
Income Statement Analysis: The Bottom-Line Duel
This income statement comparison reveals which company operates with greater efficiency and sustainable profitability in their core businesses.
Otis Worldwide Corporation Analysis
Otis’s revenue grew modestly from 14.29B in 2021 to 14.43B in 2025, showing stability. Net income rose from 1.25B in 2022 to 1.38B in 2025 despite a slight dip in 2024. Gross margins remain strong at 30.3%, with net margins near 9.6%. The 2025 results highlight solid margin control and operational efficiency amid slow revenue growth.
ATS Corporation Analysis
ATS’s revenue peaked at 3.03B in 2024 before dropping sharply 16.5% to 2.53B in 2025. Net income swung from a positive 194M in 2024 to a negative 28M loss in 2025. Gross margin contracted to 25.5%, and net margin turned negative at -1.1%. The latest year signals severe margin pressure and collapsing earnings, reflecting operational and profitability challenges.
Stable Margins vs. Volatile Earnings
Otis demonstrates steady revenue with robust margins and consistent net income growth over five years. ATS shows strong revenue expansion overall but suffers a dramatic recent earnings collapse and margin deterioration. Otis’s profile appeals more to investors seeking reliable profit generation and margin resilience.
Financial Ratios Comparison
These vital ratios act as a diagnostic tool to expose the underlying fiscal health, valuation premiums, and capital efficiency of the companies analyzed:
| Ratios | Otis Worldwide Corporation (OTIS) | ATS Corporation (ATS) |
|---|---|---|
| ROE | -25.7% (2025) | -1.6% (2025) |
| ROIC | 40.7% (2025) | 0.09% (2025) |
| P/E | 24.8 (2025) | -125.3 (2025) |
| P/B | -6.4 (2025) | 2.06 (2025) |
| Current Ratio | 0.85 (2025) | 1.69 (2025) |
| Quick Ratio | 0.77 (2025) | 1.41 (2025) |
| D/E (Debt-to-Equity) | -1.62 (2025) | 1.00 (2025) |
| Debt-to-Assets | 82.1% (2025) | 36.8% (2025) |
| Interest Coverage | 11.2 (2025) | 0.09 (2025) |
| Asset Turnover | 1.35 (2025) | 0.55 (2025) |
| Fixed Asset Turnover | 11.13 (2025) | 5.66 (2025) |
| Payout Ratio | 46.7% (2025) | 0% (2025) |
| Dividend Yield | 1.88% (2025) | 0% (2025) |
| Fiscal Year | 2025 | 2025 |
Efficiency & Valuation Duel: The Vital Signs
Ratios act as a company’s DNA, revealing hidden risks and operational excellence that shape investor confidence and valuation judgments.
Otis Worldwide Corporation
Otis shows mixed profitability with a negative ROE (-25.67%) but a strong ROIC (40.74%) well above its WACC (7.37%), indicating efficient capital use. The valuation appears neutral with a P/E of 24.85. Otis offers a modest 1.88% dividend yield, signaling steady shareholder returns despite operational challenges.
ATS Corporation
ATS struggles with profitability, posting negative net margin (-1.11%) and ROE (-1.64%), and a near-zero ROIC (0.09%) below its WACC (7.7%). The stock’s P/E is negative but rated favorable due to valuation quirks. ATS maintains a strong liquidity position but pays no dividends, likely reinvesting for turnaround or growth.
Operational Strength vs. Financial Stability
Otis delivers superior capital efficiency and consistent dividends, balancing risk and reward more effectively than ATS. ATS’s liquidity is robust but profitability and returns lag. Investors prioritizing operational resilience might favor Otis, while those seeking turnaround opportunities may watch ATS closely.
Which one offers the Superior Shareholder Reward?
I compare Otis Worldwide Corporation and ATS Corporation on shareholder returns through dividends and buybacks. Otis yields around 1.9%, with a sustainable payout ratio near 37-47% and strong free cash flow coverage. Otis also executes steady buybacks, reinforcing total returns. ATS pays no dividend and shows negative free cash flow, signaling no income distribution. ATS focuses on reinvestment but struggles with low operating margins and inconsistent cash flow. Historically, Otis balances dividends and buybacks effectively, a proven model for long-term value. I conclude Otis offers the superior total shareholder reward in 2026.
Comparative Score Analysis: The Strategic Profile
The radar chart reveals the fundamental DNA and trade-offs of Otis Worldwide Corporation and ATS Corporation, highlighting their core financial strengths and weaknesses:
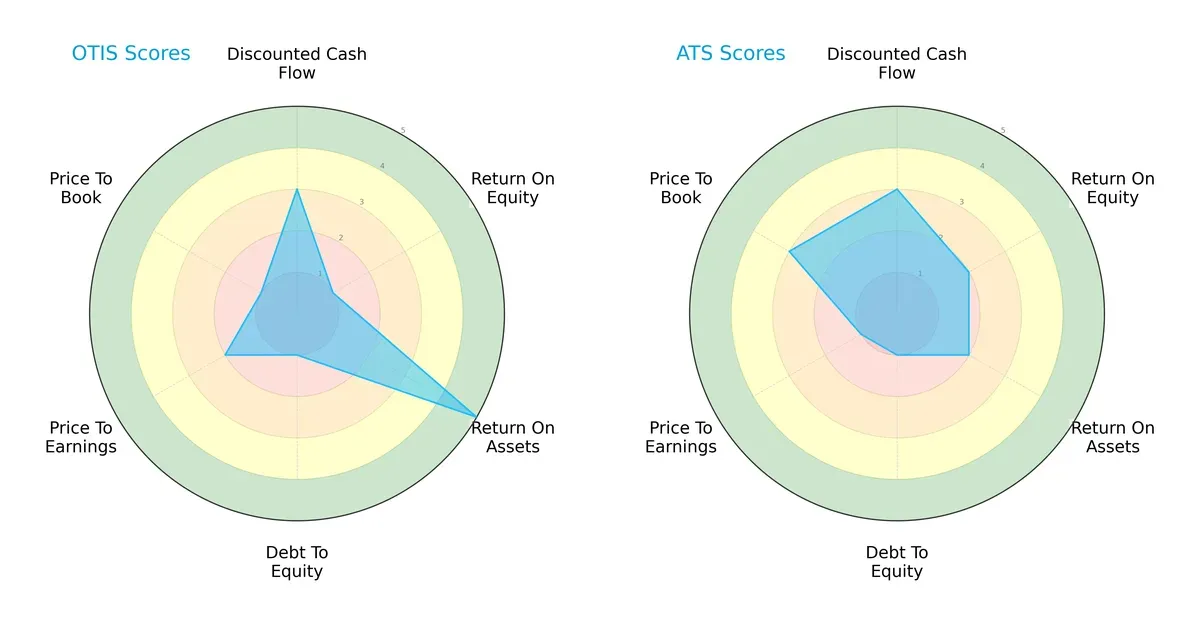
Otis excels in asset efficiency (ROA 5) but struggles with equity returns (ROE 1) and balance sheet leverage (Debt/Equity 1). ATS shows a more modest asset use (ROA 2) and slightly better equity returns (ROE 2), though it shares Otis’s weak debt profile (Debt/Equity 1). Both show moderate DCF scores (3), but Otis’s valuation metrics (PE/PB) lag significantly, reflecting possible market skepticism. Otis’s profile is more unbalanced, relying heavily on asset efficiency, while ATS offers a steadier, if less distinguished, financial footprint.
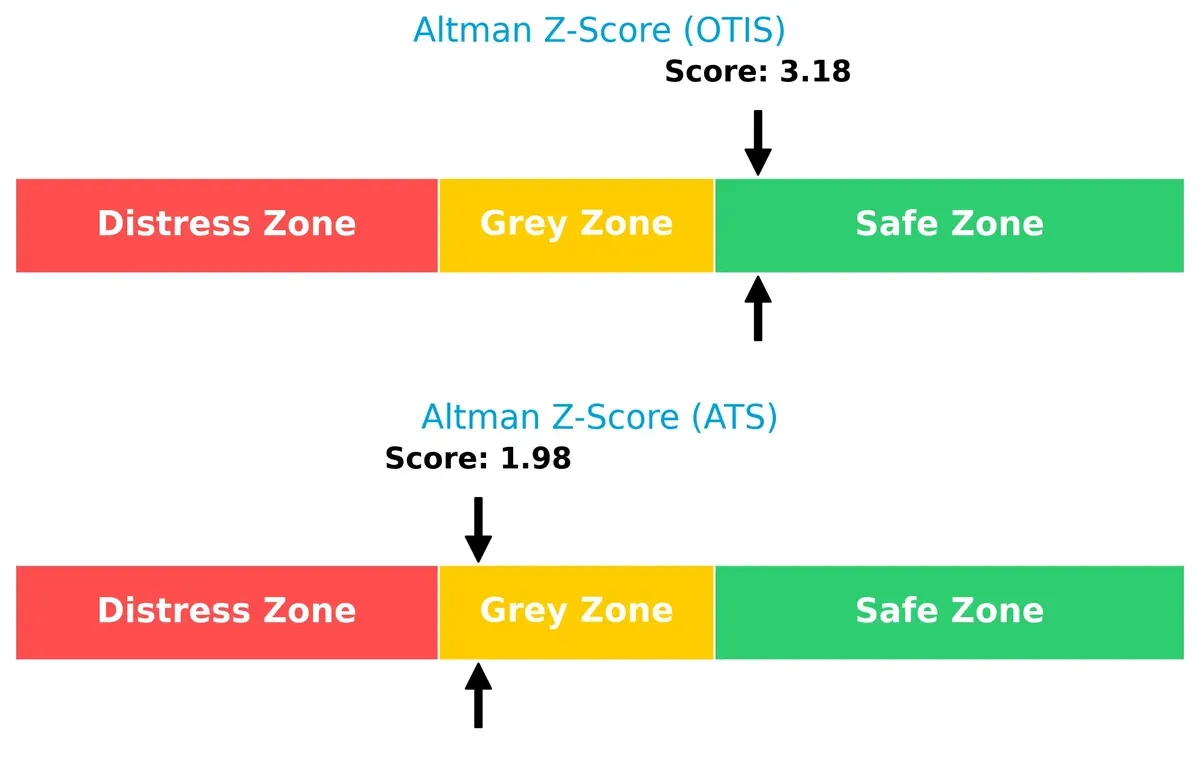
Bankruptcy Risk: Solvency Showdown
Otis’s Altman Z-Score at 3.18 places it securely in the safe zone, contrasting with ATS’s 1.98, which sits in the grey zone. This difference signals Otis’s stronger solvency and lower bankruptcy risk in this economic cycle:
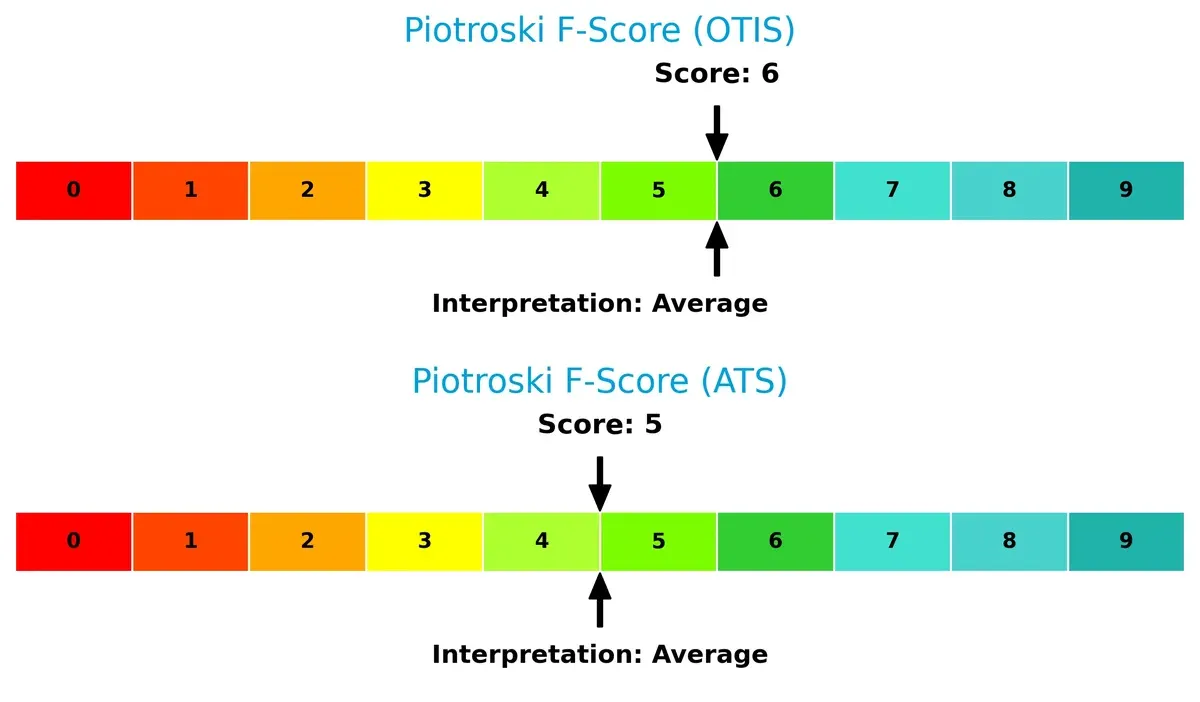
Financial Health: Quality of Operations
Both companies score in the average range on Piotroski’s scale—Otis at 6 and ATS at 5—indicating moderate financial health. Neither shows critical red flags, but Otis’s slightly higher score suggests marginally better operational quality and balance sheet management:
How are the two companies positioned?
This section dissects OTIS and ATS’s operational DNA by comparing revenue distribution and internal dynamics—strengths and weaknesses. The goal is to confront their economic moats to reveal which model delivers the most resilient, sustainable advantage today.
Revenue Segmentation: The Strategic Mix
This visual comparison dissects how Otis Worldwide Corporation and ATS Corporation diversify their income streams and reveals their primary sector bets:
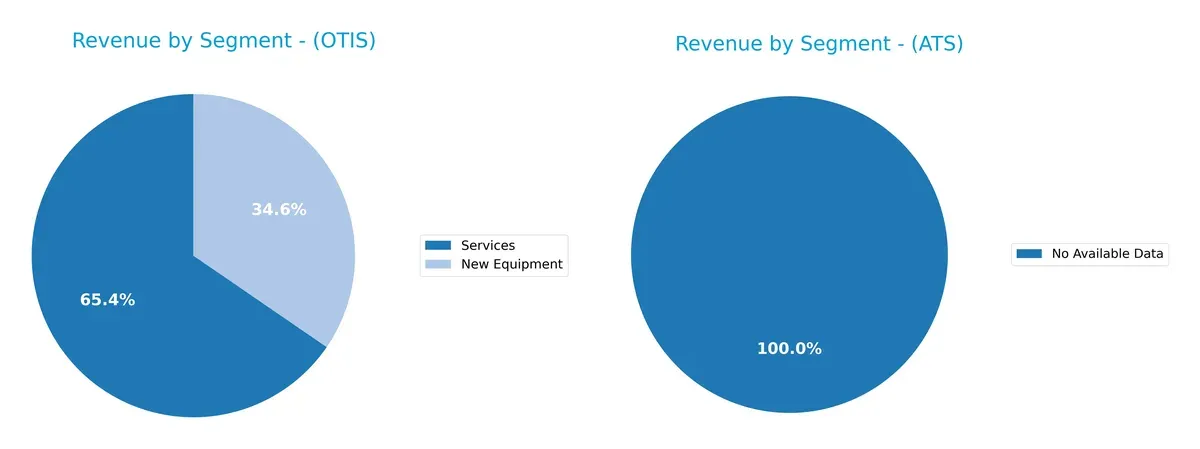
Otis anchors its revenue heavily in Services with $9.4B in 2025, nearly doubling its New Equipment segment at $5.0B. This mix signals a strategic focus on recurring, service-based income, reducing volatility. ATS lacks available data, preventing a segmentation comparison. Otis’s reliance on Services implies robust ecosystem lock-in, while New Equipment revenues provide growth avenues. This balance contrasts typical sector norms, where equipment often dominates.
Strengths and Weaknesses Comparison
This table compares the strengths and weaknesses of Otis Worldwide Corporation and ATS Corporation based on key financial and operational metrics:
Otis Strengths
- Diverse revenue from new equipment and services
- Strong global presence, especially in the US and China
- Favorable ROIC and WACC signaling efficient capital use
- High asset and fixed asset turnover indicating operational efficiency
ATS Strengths
- Favorable current and quick ratios showing liquidity strength
- Positive PE ratio despite net margin challenges
- Solid fixed asset turnover reflecting asset utilization
- Geographic diversification including US and Europe
Otis Weaknesses
- High debt to assets ratio at 82.14% increasing financial risk
- Low current and quick ratios indicating liquidity concerns
- Negative ROE reflecting weak shareholder returns
- Negative PB ratio requiring scrutiny
ATS Weaknesses
- Negative net margin and ROE showing profitability struggles
- Low ROIC near zero questions capital efficiency
- Poor interest coverage at 0.16 signals risk in debt servicing
- Zero dividend yield may deter income-focused investors
Otis’s strengths lie in operational efficiency and capital allocation but face financial leverage and liquidity risks. ATS shows liquidity and asset utilization advantages but must address profitability and debt servicing challenges to improve overall financial health.
The Moat Duel: Analyzing Competitive Defensibility
A structural moat is the only enduring shield protecting long-term profits from relentless competition erosion:
Otis Worldwide Corporation: Service Network & Intangible Asset Moat
Otis leverages a vast service network and strong brand, reflected in a robust 33% ROIC above WACC and stable margins. Expanding modernization services in global infrastructure deepens its moat through 2026.
ATS Corporation: Innovation-Driven Cost Advantage
ATS relies on automation innovation but suffers from a declining ROIC and shrinking margins, signaling value erosion. Its niche in digital factory solutions offers potential, yet competitive pressure threatens moat sustainability.
Verdict: Service Network vs. Innovation Edge
Otis commands a wider, deeper moat with sustained value creation and growing profitability. ATS’s shrinking ROIC and negative margins highlight vulnerability. Otis stands better poised to defend market share in 2026.
Which stock offers better returns?
The past year reveals contrasting dynamics: Otis Worldwide Corporation’s shares declined steadily yet accelerated downward, while ATS Corporation faced a deeper drop but recently rebounded sharply.
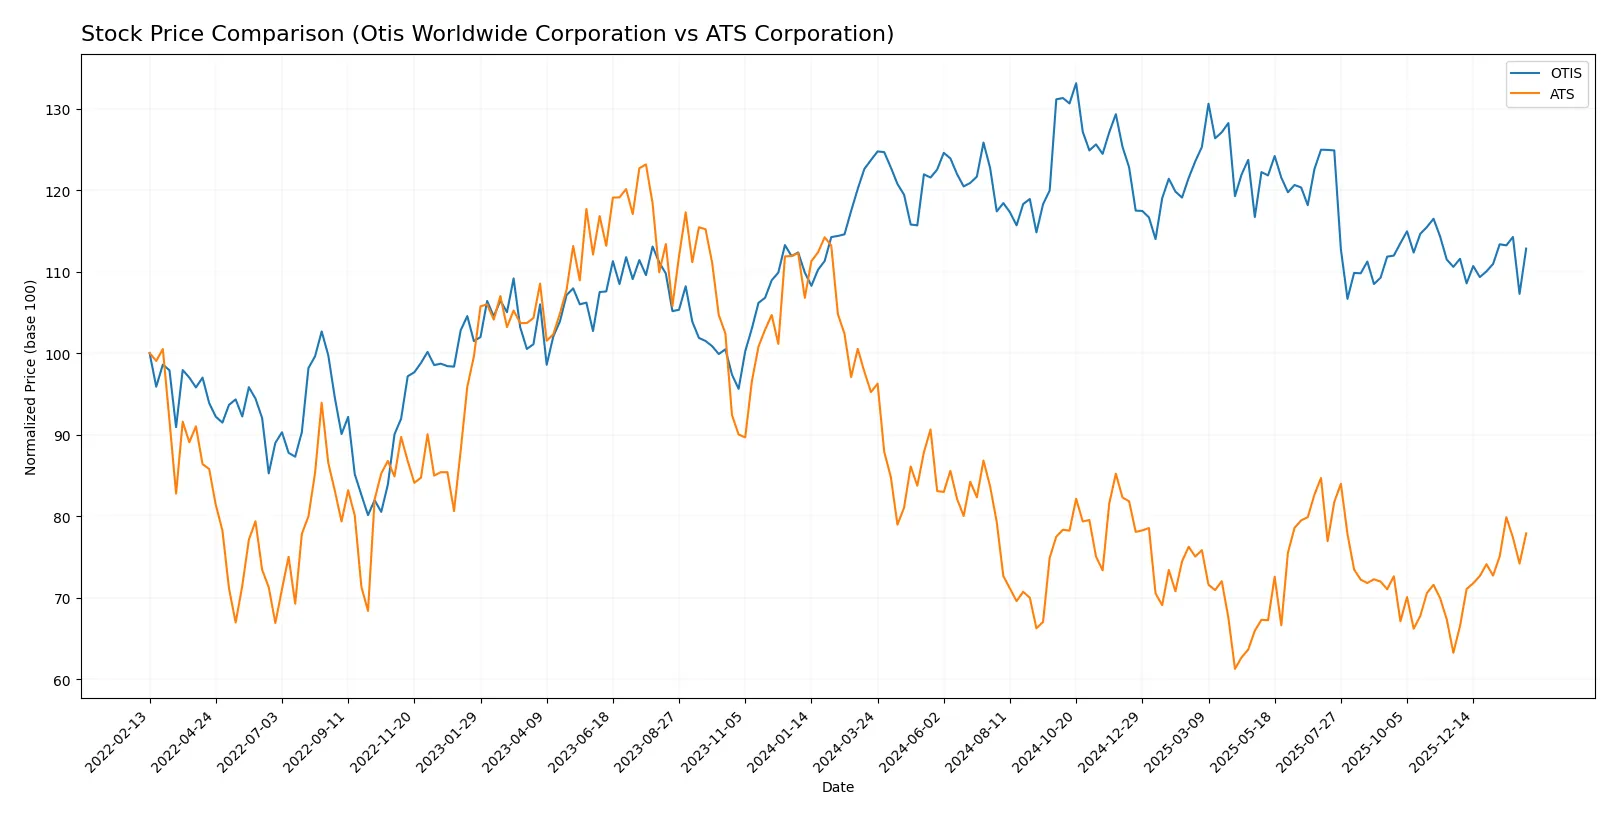
Trend Comparison
Otis Worldwide’s stock declined 8.78% over the past 12 months, marking a bearish trend with accelerating downside. The price ranged from a high of 106.01 to a low of 84.93, showing increased volatility.
ATS Corporation’s stock fell 18.2% over the same period, a bearish trend with accelerating losses. Despite lower volatility, it displayed a recent strong 23.17% rebound since late November 2025.
ATS’s sharper loss contrasts with its robust recent recovery, outperforming Otis’s more moderate decline and modest recent gains in market performance.
Target Prices
Analysts present a clear consensus with moderate upside potential for both Otis Worldwide Corporation and ATS Corporation.
| Company | Target Low | Target High | Consensus |
|---|---|---|---|
| Otis Worldwide Corporation | 92 | 109 | 97.75 |
| ATS Corporation | 34 | 34 | 34 |
Otis’s target consensus of 97.75 suggests about 9% upside from its current price of 89.85. ATS’s consensus target of 34 implies roughly 14% upside from the current 29.88 price.

Don’t Let Luck Decide Your Entry Point
Optimize your entry points with our advanced ProRealTime indicators. You’ll get efficient buy signals with precise price targets for maximum performance. Start outperforming now!
How do institutions grade them?
The following tables summarize recent institutional grades for Otis Worldwide Corporation and ATS Corporation:
Otis Worldwide Corporation Grades
This table shows recent grades and actions from recognized financial institutions for Otis Worldwide Corporation.
| Grading Company | Action | New Grade | Date |
|---|---|---|---|
| JP Morgan | maintain | Overweight | 2026-01-16 |
| Wells Fargo | maintain | Equal Weight | 2025-12-15 |
| Barclays | maintain | Underweight | 2025-10-30 |
| JP Morgan | maintain | Overweight | 2025-10-15 |
| Wolfe Research | upgrade | Outperform | 2025-10-08 |
| Wells Fargo | maintain | Equal Weight | 2025-10-06 |
| JP Morgan | maintain | Overweight | 2025-09-18 |
| RBC Capital | maintain | Outperform | 2025-07-28 |
| Wolfe Research | upgrade | Peer Perform | 2025-07-25 |
| JP Morgan | maintain | Overweight | 2025-07-24 |
ATS Corporation Grades
This table lists recent grades and actions from major financial institutions for ATS Corporation.
| Grading Company | Action | New Grade | Date |
|---|---|---|---|
| JP Morgan | maintain | Neutral | 2026-01-16 |
| JP Morgan | maintain | Neutral | 2024-08-13 |
| Goldman Sachs | maintain | Sell | 2024-08-13 |
| JP Morgan | maintain | Neutral | 2024-05-24 |
Which company has the best grades?
Otis Worldwide Corporation consistently receives favorable grades, including multiple Overweight and Outperform ratings. ATS Corporation’s grades are mostly Neutral to Sell. Investors may interpret Otis’s stronger grades as greater institutional confidence compared to ATS.
Risks specific to each company
The following categories identify the critical pressure points and systemic threats facing both firms in the 2026 market environment:
1. Market & Competition
Otis Worldwide Corporation
- Operates globally with strong brand and service network, facing intense competition in industrial machinery.
ATS Corporation
- Focuses on automation with niche markets but competes against larger automation and robotics firms.
2. Capital Structure & Debt
Otis Worldwide Corporation
- High debt-to-assets ratio (82%) is a red flag despite favorable interest coverage.
ATS Corporation
- Moderate debt levels with neutral debt-to-assets (37%), but very weak interest coverage signals risk.
3. Stock Volatility
Otis Worldwide Corporation
- Beta near 1.0 (1.012) indicates market-level volatility.
ATS Corporation
- Higher beta (1.163) shows greater stock price swings and higher risk.
4. Regulatory & Legal
Otis Worldwide Corporation
- Subject to global safety and building regulations, with compliance costs stable but significant.
ATS Corporation
- Faces regulatory scrutiny in automation and manufacturing industries, risk from changing trade policies.
5. Supply Chain & Operations
Otis Worldwide Corporation
- Large network of service mechanics offers operational resilience but exposure to raw material cost inflation.
ATS Corporation
- Supply chain complexity in automation solutions may increase operational risk amid global disruptions.
6. ESG & Climate Transition
Otis Worldwide Corporation
- Moderate ESG integration; modernization services align with energy efficiency trends.
ATS Corporation
- ESG initiatives less visible; automation solutions may face pressure to enhance sustainability credentials.
7. Geopolitical Exposure
Otis Worldwide Corporation
- Global footprint exposes it to trade tensions and regional economic risks, especially China and US.
ATS Corporation
- Canadian base with international sales; geopolitical risks moderate but present in global supply chains.
Which company shows a better risk-adjusted profile?
Otis’ most impactful risk is its heavy leverage, which strains financial flexibility despite strong operating metrics. ATS suffers primarily from weak profitability and interest coverage, signaling financial distress risk. Otis presents a better risk-adjusted profile, supported by a safe Altman Z-Score (3.18) versus ATS’s grey zone score (1.98). The recent rise in Otis’s debt-to-assets ratio to 82% confirms leverage risk but contrasts with ATS’s risky interest coverage of 0.16, highlighting ATS’s vulnerability.
Final Verdict: Which stock to choose?
Otis Worldwide Corporation’s superpower lies in its robust capital efficiency and sustained value creation. Its very favorable moat, reflected by a high ROIC well above WACC, signals a durable competitive advantage. The main point of vigilance is its liquidity, with current ratios below 1, which might pressure short-term flexibility. Otis suits portfolios focused on steady, long-term value creation with moderate growth.
ATS Corporation leverages its strategic positioning in specialized manufacturing, but its moat is very unfavorable, with a declining ROIC below WACC, indicating value erosion. Its stronger liquidity ratios offer some safety compared to Otis, but ongoing profitability challenges and weak income metrics raise caution. ATS fits investors targeting turnaround potential or high-risk, speculative growth scenarios.
If you prioritize capital efficiency and a proven competitive moat, Otis outshines ATS due to consistent value creation and operational strength. However, if you seek exposure to a speculative recovery with better short-term liquidity, ATS offers a riskier but potentially higher-reward profile. Each represents distinct investor archetypes with differing risk tolerances and strategic goals.
Disclaimer: Investment carries a risk of loss of initial capital. The past performance is not a reliable indicator of future results. Be sure to understand risks before making an investment decision.
Go Further
I encourage you to read the complete analyses of Otis Worldwide Corporation and ATS Corporation to enhance your investment decisions: